Page MenuHomePhabricator

MediaWiki\Logger\LoggerFactory::getInstance shows up high on xenon leaderboard
Closed, ResolvedPublic

Description

$ xenon-grep --entrypoint=api --resolution=daily --count=10
Top 10 functions, api.php:
--------------------------
   1 | Elastica\Request::send                      | 18.68%
   2 | MediaWiki\Logger\LoggerFactory::getInstance | 7.73%
   3 | LuaSandboxFunction::call                    | 3.63%
   4 | ApiQueryBase::select                        | 2.76%
   5 | Preprocessor_Hash::preprocessToObj          | 2.69%
   6 | LinkCache::addLinkObj                       | 2.39%
   7 | Revision::fetchFromConds                    | 2.25%
   8 | LuaSandbox::loadString                      | 2.08%
   9 | File::getDescriptionText                    | 1.97%
  10 | Revision::loadText                          | 1.88%
--------------------------
Log files:
 - /srv/xenon/logs/daily/2015-10-15.api.log
 - /srv/xenon/logs/daily/2015-10-16.api.log

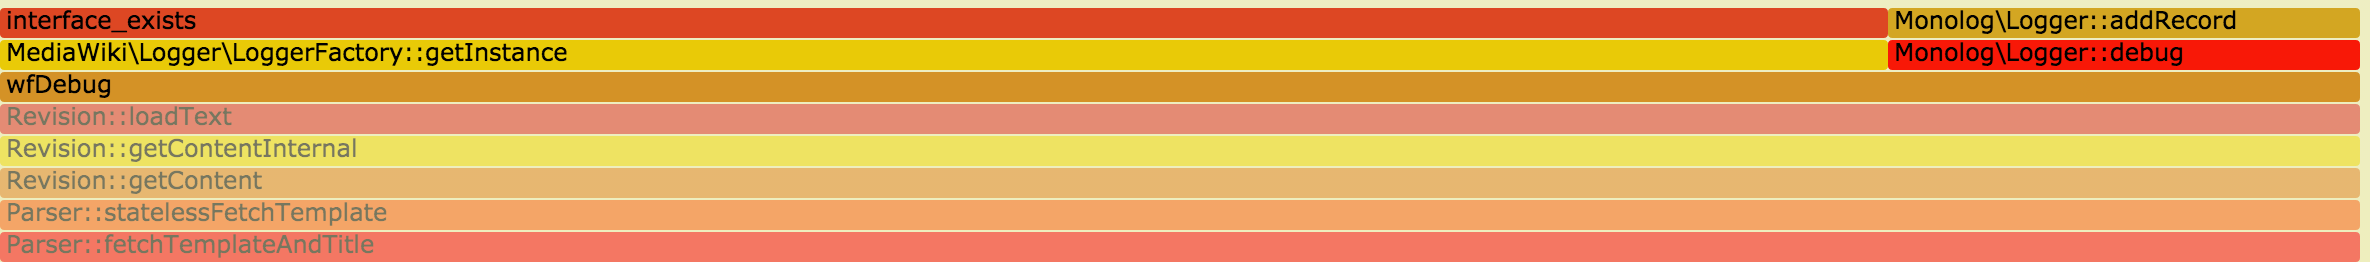
< ori> bd808: functions that get called very often but which run very quickly don't tend to show up in the leaderboard; it usually indicates that the function is not only called frequently but that it is slow as well
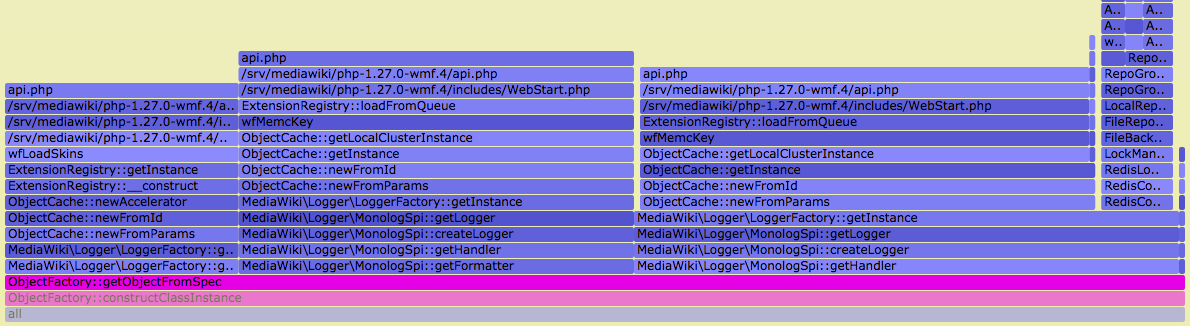
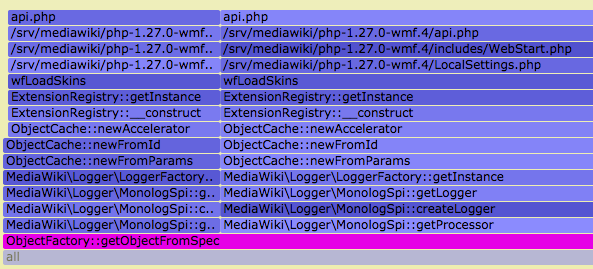
< ori> bd808: this is aggregating by the top (on-cpu) frame in the stack, minus some exclusions (like mysqli_query -- things where we'd rather know the caller)
< bd808> right, so it's basically counting on statistical modeling to tell us what is slow. We can look at it for sure

Event Timeline

bd808 raised the priority of this task from to Medium.
bd808 updated the task description. (Show Details)
bd808 subscribed.

LoggerFactory::getInstance() does these things:

  • checks interface_exists( '\Psr\Log\LoggerInterface' )
    • Should be a simple autoloader hit
  • LoggerFactory::getProvider()
    • cached statically after first hit
    • Uses ObjectFactory::getObjectFromSpec() to create factory if not cached
  • Spi::getLogger()
    • For WMF prod this is a call to MonologSpi::getLogger()

Since ObjectFactory::getObjectFromSpec() isn't showing up on the report, MonologSpi::getLogger() seems the most likely culprit. MonologSpi uses a memoization pattern to cache and reuse as many objects as it can during a request cycle but it does need to build quite a few object instances in order to deliver a fully functional Monolog\Logger instance. All of these instances are created using ObjectFactory::getObjectFromSpec() which is why I would have expected it to hit the high utilization rather than LoggerFactory::getInstance(), but maybe each call to ObjectFactory::getObjectFromSpec() is fast enough not to get caught on top of the call stack and LoggerFactory::getInstance() just gets blamed because it is wrapping many smaller calls and ending up on top in between each of them? If this was the case however it seems like MonologSpi::getLogger() would really be the one on top of the stack most often.

@bd808 The visual rendering with context can be seen at https://performance.wikimedia.org/xenon/svgs/daily/2015-10-22.api.svgz. Below is a single sample of such stack from e.g. the Parser in an api request:

Screen Shot 2015-10-23 at 22.59.59.png (262×2 px, 77 KB)

There is also an inverse flame graph at https://performance.wikimedia.org/xenon/svgs/daily/2015-10-22.api.reversed.svgz.
This can help find the lower-level culprits that have their calls separated over many smaller stacks. Below is the aggregated upside down callstack tip of LoggerFactory::getInstance:

Screen Shot 2015-10-23 at 22.58.28.png (390×2 px, 280 KB)

It would seem most calls come from wfDebug (also ObjectCache::newFromParams and wfDebugLog), and LoggerFactory::getInstance itself appears to spend most time (on average) in interface_exists. Monolog doesn't even show up here.

These appear to be more typical traces than the ones in T115729#1749622:

Screen Shot 2015-10-23 at 17.16.26.png (267×449 px, 60 KB)

Screen Shot 2015-10-23 at 17.18.51.png (394×449 px, 94 KB)

This points where I would expect, namely to the creation of new objects as the time sink.

This trace is starting to make a bit more sense:

Screen Shot 2015-10-24 at 11.18.51 AM.png (356×563 px, 74 KB)

This is pointing at the use of ReflectionClass by ObjectFactory as an expensive function. From the doc comments for ObjectFactory::getObjectFromSpec (emphasis added):

Object construction using a specification having both 'class' and 'args' members will call the constructor of the class using ReflectionClass::newInstanceArgs. The use of ReflectionClass carries a performance penalty and should not be used to create large numbers of objects. If this is needed, consider introducing a factory method that can be called via call_user_func_array() instead.

The Monolog configuration that we are using in production & beta cluster builds everything using 'class' + 'args' specifications so we are using ReflectionClass::newInstanceArgs a lot in constructing Logger instances.

I actually wrote that class and docblock so you'd think this would have dawned on me a bit earlier. Apparently not.

PHP 5.6 adds a "splat" operator ([[http://www.php.net/manual/en/migration56.new-features.php#migration56.new-features.splat|...]]) that would allow getObjectFromSpec to use $obj = new $clazz( ...$args ); instead of reflection. The version of HHVM that we are running in production supports splat so it's probably worthwhile to add support for that to ObjectFactory.

Or you can just do something like

switch ( count( $args ) ) {
    case 0:
        return new $clazz();
    case 1:
        return new $clazz( $args[0] );
    case 2:
        return new $clazz( $args[0], $args[1] );
    case 3:
        return new $clazz( $args[0], $args[1], $args[2] );
    default:
        // ...reflection...
}

It's ugly but gets the job done.

Change 248636 had a related patch set uploaded (by BryanDavis):
ObjectFactory: avoid using ReflectionClass

https://gerrit.wikimedia.org/r/248636

Change 248650 had a related patch set uploaded (by BryanDavis):
LoggerFactory: Only check for Psr\Log\LoggerInterface once

https://gerrit.wikimedia.org/r/248650

Change 248636 merged by jenkins-bot:
ObjectFactory: avoid using ReflectionClass

https://gerrit.wikimedia.org/r/248636

Change 248650 merged by jenkins-bot:
LoggerFactory: Only check for Psr\Log\LoggerInterface once

https://gerrit.wikimedia.org/r/248650

Change 249296 had a related patch set uploaded (by Ori.livneh):
ObjectFactory: avoid using ReflectionClass

https://gerrit.wikimedia.org/r/249296

Change 249297 had a related patch set uploaded (by Ori.livneh):
LoggerFactory: Only check for Psr\Log\LoggerInterface once

https://gerrit.wikimedia.org/r/249297

Change 249296 merged by Ori.livneh:
ObjectFactory: avoid using ReflectionClass

https://gerrit.wikimedia.org/r/249296

Change 249297 merged by Ori.livneh:
LoggerFactory: Only check for Psr\Log\LoggerInterface once

https://gerrit.wikimedia.org/r/249297

$ xenon-grep --entrypoint=api --resolution=daily --count=10
Top 10 functions, api.php:
--------------------------
   1 | Elastica\Request::send                | 19.04%
   2 | LuaSandboxFunction::call              | 3.75%
   3 | LuaSandbox::loadString                | 2.89%
   4 | ApiQueryBase::select                  | 2.89%
   5 | ObjectFactory::getObjectFromSpec      | 2.75%
   6 | Revision::fetchFromConds              | 2.63%
   7 | LinkCache::addLinkObj                 | 2.62%
   8 | ObjectFactory::constructClassInstance | 2.54%
   9 | Preprocessor_Hash::preprocessToObj    | 2.47%
  10 | Revision::loadText                    | 2.34%
--------------------------
Log files:
 - /srv/xenon/logs/daily/2015-10-29.api.log
 - /srv/xenon/logs/daily/2015-10-30.api.log

Screen Shot 2015-10-30 at 16.05.24.png (326×1 px, 177 KB)

Screen Shot 2015-10-30 at 16.07.01.png (269×593 px, 109 KB)

Much better! ObjectFactory::getObjectFromSpec and ObjectFactory::constructClassInstance are still showing up pretty high in the results so there may be additional things to investigate but the reduction from 7.73% to 5.29% (2.75% + 2.54%) is encouraging.

Change 250149 had a related patch set uploaded (by Krinkle):
objectcache: Use singleton cache in newAccelerator()

https://gerrit.wikimedia.org/r/250149

Change 250152 had a related patch set uploaded (by Ori.livneh):
objectcache: Use singleton cache in newAccelerator()

https://gerrit.wikimedia.org/r/250152

Change 250149 merged by jenkins-bot:
objectcache: Use singleton cache in newAccelerator()

https://gerrit.wikimedia.org/r/250149

Change 250152 merged by jenkins-bot:
objectcache: Use singleton cache in newAccelerator()

https://gerrit.wikimedia.org/r/250152

$ xenon-grep --entrypoint=api --resolution=daily --count=20
Top 20 functions, api.php:
--------------------------
   1 | Elastica\Request::send                 | 23.11%
   2 | LuaSandboxFunction::call               | 3.97%
   3 | ApiQueryBase::select                   | 3.44%
   4 | LuaSandbox::loadString                 | 2.96%
   5 | LinkCache::addLinkObj                  | 2.85%
   6 | Revision::fetchFromConds               | 2.78%
   7 | Revision::loadText                     | 2.47%
   8 | Preprocessor_Hash::preprocessToObj     | 1.81%
   9 | File::getDescriptionText               | 1.57%
  10 | ApiBase::getDB                         | 1.57%
  11 | Composer\Autoload\includeFile          | 1.25%
  12 | LocalFile::loadFromCache               | 1.18%
  13 | Closure$                               | 1.08%
  14 | MWWikiversions::readDbListFile         | 1.05%
  15 | ExtensionRegistry::queue               | 1.04%
  16 | PPFrame_Hash::expand                   | 1.03%
  17 | Preprocessor::cacheGetTree             | 0.99%
  18 | ReplacementArray::replace              | 0.74%
  19 | Monolog\Logger::addRecord              | 0.74%
  20 | ExtensionRegistry::exportExtractedData | 0.70%
--------------------------
Log files:
 - /srv/xenon/logs/daily/2015-11-04.api.log
 - /srv/xenon/logs/daily/2015-11-05.api.log

Logging and ObjectFactory have dropped completely out of the top 10!

Monolog\Logger::addRecord should be improved by T116550.