GRANT USAGE ON *.* TO 's51230' WITH MAX_USER_CONNECTIONS 1;
This was the real cause of:
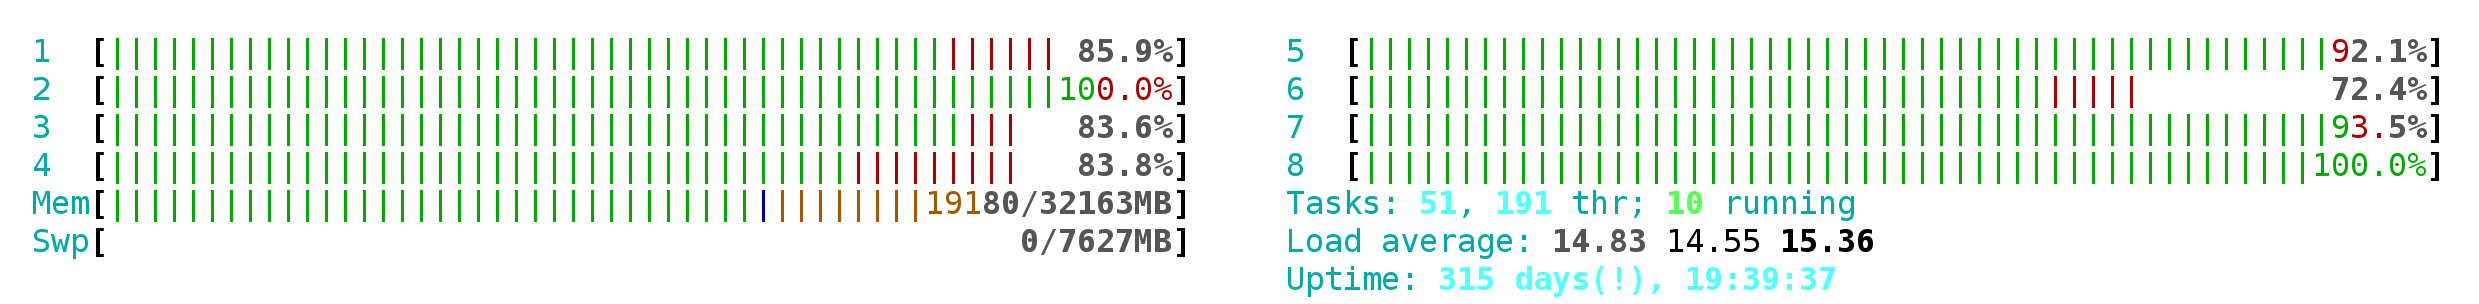
as, after applied, CPU consumption has gone from 700% to 50%.
| • jcrespo | |
| Dec 10 2015, 10:51 AM |
| F3061088: labsdb1005.png | |
| Dec 10 2015, 10:51 AM |
GRANT USAGE ON *.* TO 's51230' WITH MAX_USER_CONNECTIONS 1;
This was the real cause of:
as, after applied, CPU consumption has gone from 700% to 50%.
| Status | Subtype | Assigned | Task | ||
|---|---|---|---|---|---|
| Open | Feature | None | T18660 Database table cleanup (tracking) | ||
| Declined | None | T87716 Missing rows from categorylinks on production servers (dewiki) | |||
| Invalid | Feature | None | T69556 merl tools (tracking) | ||
| Resolved | LSobanski | T119601 Certain tools users create multiple long running queries that take all memory and/or CPU from labsdb hosts, slowing it down and potentially crashing (tracking) | |||
| Resolved | dcaro | T121094 Throttling linkwatcher tool user as it is consuming 100% CPU |
Please revert this. This is effectively killing the hole anti-spam effort on Wikipedia. The bot needs multiple user connections into the database.
Are we able to backtrack to see when this occurred? The bot has been running for years, so if it is a new phenomenon then maybe we can explore that issue.
Re one cxn, what a crock!
@jcrespo Thanks for reaching out for a discussion prior to throttling back on one of the major xwiki anti-spam tools.
It would indeed be good if we can figure out what is causing this instead of just throttling. It's been running for ages so causing massive issues is new and it serves a very important function.
@Billinghurst a more respectful tone towards the only person who is keeping labsdb up and running (and the rest of our databases up and running) will probably help in getting actual solutions.
@yuvipanda, @jcrespo - with all respect, this has just completely brought the complete Wikipedia anti-spam effort to a near halt (I've taken the bots offline). It is fine that there are problems, and that those need to be solved, but it would be great if we finally would get a bit more consideration from the WMF (this is not the first time that unannounced and undiscussed actions from WMF bring down bots - a couple of months ago my bots went down for days because of an unannounced and very minor change in server output) - your databases will run just fine when there are no bot operators that are willing to use Labs. Thank you.
Not performing this action would have mean all bots and utilities using toolsdb would be down due to massive CPU consumption. I receive complains every time there is a CPU/IO spike from other users.
I will be happy to add more connections once the issue has been solved.
@jcrespo .. what issue? What query is making this happening. It can't be the couple of hundred of usual insert queries that the bots do, it must be one (or a couple) of the select queries. Do I have a broken query, do I have a query that is not optimised, or do I have a missing index on a table ...??
@jcrespo - I receive complains every time there is a CPU/IO spike from other users - that means that you knew for a long time there was a CPU/IO spike every now and then .. and you could have seen then which bot there was causing that, and ask the bot-owner/maintainer
This is why this issue is not closed- we can figure it out. We cannot even query the server or debug the issue if it is at 100% utilization- this was a new state (not happening before) and I was forced to set a limit to fix the other users's problems. The bot is not banned, it only has been limited (hopefully temporarily) to one connection at a time. Let's fix it if there is an issue or give it a dedicated host if it cannot be fixed but requires more resources than the ones available at toolsdb. This ticket is how we can discuss that.
Can you share a link to the code querying the database?
Well, with one connection the bots cannot run. LiWa3 uses something like 50 parallel processes (to keep up with the 600+ edits a minute) with each their own connection. COIBot adds a couple more. The first bot's main process takes down the only connection, the rest of the processes the bot spawns crashes the main bot then.
This involves 40.000 lines of Perl code - which have been running without problem. The queries did not change for months/years ... the current queries may not cause any issues, until the specific one (or a similar one) pops up again. I'll try to paste the code somewhere....
If you mean that the usage was a one-time spike, I can reenable normal resources, but I will revert if the problem persists, ok with that? Maybe I can put it with 10-20 connection limit?
Also I would recommend setting different accounts for different services so one does not affect the other and we can limit the impact of throttling measures like this, is that possible?
Let me give you specific examples of problematic queries:
<SANITIZED> means I left some strings out due to privacy concerns (users names, ips, etc.), contact me privately.
Those where the main offenders. It could be several reasons why this is may be happening now and not before (I see a peak around the 8 december):
The truth is that maintenance is required even if code doesn't change- users and data change. I can tell you that, I suffer production, too.
Also this happened at the same time that other issue on the same server with another user performing costly imports for a short time.
Let me have a manual look at the 'offending queries' one of these days .. see if I can reproduce. When WikiData started I had problems with three bot that ran at hundreds of edits per minute which brought everything down. Maybe I have a similar problem here now.
The number of hits makes sense (domain, user and 'resolved' counting is where our stats are based on), but that some take so long does not - there is something not right there. Thanks!
Thanks for taking the time to fix the issue.
I've allowed 10 simultaneous connections for the user for now:
GRANT USAGE ON *.* TO 's51230' WITH MAX_USER_CONNECTIONS 10;
I will monitor it and adjust it up or down accordingly, depending on the new server impact.
Because my bot (dbuser s51826) also runs queries on linkwatcher_linklog if have checked statistics of my script. Mainly to exclude a deadlock problem or table locks caused by my script.
I don't know the runtime of single queries but of the hole scripts which make three queries to linklog and two queries for importing the result to my table which is cleared before.
Performance of the last days is good. Script runtime is about 14-30 seconds without an outlier. There is a great constant peak from Sep 11th till Nov 7th where runtime was always between 65-123 seconds with four exceptions of 10 minutes (my script kills the query then). Before September the runtime was about 10-20 seconds.
@Merl, I only throttled user s51230. I did not touch s51826, nor I did see any problems with its queries. It is true that if MyISAM tables are used, reads can block writes, but all of those are InnoDB tables.
Performance of the last days is good.
That usually happens when the server is happy and not at 100% cpu :-)
Please note that I am not blaming any of you, sometimes, for example, a web service becomes too popular and a lot of queries are done, or as Beetstra mentioned, when data or patterns change, new problems appear. I would love to dedicate enough time to each of you to investigate myself all the potential issue of each , but sadly this is just one server among many, including the production ones. It would be great if you could help each other with debugging, as that would benefit us all in the end.
Was that really WMF's fault? Even if it was, I don't see how it's related to @jcrespo restricting database usage. I very much doubt he was involved in the decisions over API changes. If you rely on a tool to such an extent, you should be expected to make sure it does not start causing issues for other users, because then administrators will step in and shut your tool down. I would expect a volunteer database administrator to do exactly the same thing to you.
@yuvipanda Respect is a two way street. This is not a convenience tool.
When the bulk of the url spam handling for enWP goes down (Xlinkbot) and the reporting and analysis (COIBot), it would be great if staff did acknowledge that this is the case, and could pro-actively report this to the volunteer who writes and maintains, and the volunteers who undertake the spam management. When the volunteers spend hours over the weekend struggling through wondering what is going on with the tools, trying to fix what they can see, and also try to manage spam by other means, imagine the frustration that they can have when they find that staff knew about the issue, took actions, and that is where it apparently stopped (on Thursday).
I would love for WMF to be more actively involved in providing a better solution to restricting spambots, designing a preventative system, but that doesn't seem to happen and has little priority over the years. So excuse my frustration when the one defensive mechanism that we have is taken offline, and no-one says anything, and the best that I see is this report which one would need to know exists. Volunteers may grow on trees, but like trees they too don't like being burnt.
it would be great if staff did acknowledge that this is the case, and could pro-actively report this to the volunteer who writes and maintains
What are you talking about? *I* created this ticket, and as you can see in the history, the maintainer on the records (Beetstra) was notified immediately. It took 3 days for him to even respond, and the answer has been:
Let me have a manual look at the 'offending queries' one of these days
Let me also quote some policies from enwiki regarding bot operators:
Users who read messages or edit summaries from bots will generally expect a high standard of cordiality and information, backed up by prompt and civil help from the bot's operator if queries arise. Bot operators should take care in the design of communications, and ensure that they will be able to meet any inquiries resulting from the bot's operation cordially, promptly, and appropriately.
Administrators may block bot accounts that operate without approval, operate in a manner not specified in their approval request, or operate counter to the terms of their approval or bot usage policy.
Sysadmins will inform the community if performance issues of any significance do arise, and in such situations, their directives must be followed.
Performance issues were so bad, that I was forced to take action immediately, despite taking me some time to track down the issue. The user was contacted immediately, too (Phabricator sends an email to each CC user).
Also, I did not shutdown the bot, only limited the number of connections that it created. He did shutdown it:
I've taken the bots offline
@jcrespo: I was notified immediately, but unfortunately at the start of my weekend, with an email which is hardly telling me anything, just that the number of connections were restricted. I reacted immediately after the weekend, and it still took time to realise why the bots were affected by this. Moreover, the en.wikipedia policy that you quote regards the editing on-wiki, which was here not the problem (the main bot does not even edit on-wiki) - it was the database.
Anyway, I have brought the first bot partially online to see what is going on.
@jcrespo: I have implemented new counting tables based on the three 'offending' queries above (and will implement if there are more, just tell me here what is being queried and I will devise a solution for it).
This is an extension to the earlier solution, where the 'analyser instance' did store in it's memory the count for a specific link (but the there are ~20 'analyser instances' running at the same time, and they self-respawn after a certain amount of time). That data is now stored in the database, so running stats on data that has high counts is avoided (which is useless anyway).
These counting tables need to be populated, which does mean that it will every now and then run a 'offending query' for the first count of the 'subject'.
There are still problems with thousands of queries executing:
SELECT COUNT(*) as total_record FROM linkwatcher_linklog WHERE domain='<const>'
SELECT COUNT(distinct domain) as total_record FROM linkwatcher_webbug WHERE webbug LIKE '%<const>%'
SELECT COUNT(*) as total_record FROM linkwatcher_linklog WHERE user='<const>'
Taking up to 2 minutes to execute. They are still maximizing the CPU.
The load is mostly constant, but the peak was between 13-20h (UTC) on 2015-12-23. I count >50 000 of those in the last 128 hours.
I will not take action if you please promise to work on this soonish (I understand there are vacations, etc.).
Working on it again. Some of the new counting mechanisms were not performing as requested, but that has now been updated.
Note that these bots do require to run a large/huge number of queries per unit of time (reverting of spammers and catching of spammers works best in 'real time'). I need however to make sure that the number of long-running queries is minimized.
@Beetstra Having a lot of transactions per second is not a problem,
that can be handled by the existing resources, and if it was
necessary, more resources can be invested. The main problem is long
running transactions and huge amounts of concurrency (usually the
second is caused by the first).
Thanks for working on this, this will probably make the application
faster for you and for the rest of tools db users.
@jcrespo. The last upgrade of the bot seems to have brought down the load significantly over the (my) night - doing successive 'show processlist;' statements does not show many queries running longer than 5 seconds, and hardly any longer than 10 seconds (which should now really happen less and less). When this bot ([[:m:User:LiWa3]]) is back up and running in full, I will turn my attention to the second bot (([[:m:User:COIBot]]) that makes heavy use of this db.
Q: are there any ways for me to see the load caused by my db-accounts, when it peaks and which queries are the problem?
This is a "last 48 hours" report:
Hits 	Tmax 	Tavg 	Tsum 	Hosts 	Users 	Schemas
4874	36	5	24,918	labsdb1005	s51230	s51230__linkwatcher
SELECT COUNT(*) as total_record FROM linkwatcher_linklog WHERE domain='?.' /* dcf34f7acddf5a59c54453cec31cd9a6 labsdb1005 s51230__linkwatcher 2s */
2665	28	4	11,743	labsdb1005	s51230	s51230__linkwatcher
SELECT COUNT(*) as total_record FROM linkwatcher_linklog WHERE user='?' /* a78223ea7bf4ea108c9d38bd4f9a24ac labsdb1005 s51230__linkwatcher 7s */
Sadly, with the current monitoring tools, private information is disclosed, so there is no public access (I have to manually delete ip or user information before posting it here). However, any admin or volunteer with a signed NDA can provide you this very same information.
I am working right now to integrate other tools to make query monitoring available: T99485
There are several things that I can recommend you to improve your query performance:
MariaDB TOOLSDB master localhost information_schema > SELECT * FROM user_statistics ORDER BY CPU_TIME DESC LIMIT 10;
+--------+-------------------+------------------------+----------------+--------------------+--------------------+----------------+---------------+----------------------+----------------+-------------+--------------+---------------+--------------+-----------------+-----------------+----------------+---------------------+-----------------------+--------------------+------------------+---------------+---------------+
| USER   | TOTAL_CONNECTIONS | CONCURRENT_CONNECTIONS | CONNECTED_TIME | BUSY_TIME          | CPU_TIME           | BYTES_RECEIVED | BYTES_SENT    | BINLOG_BYTES_WRITTEN | ROWS_READ      | ROWS_SENT   | ROWS_DELETED | ROWS_INSERTED | ROWS_UPDATED | SELECT_COMMANDS | UPDATE_COMMANDS | OTHER_COMMANDS | COMMIT_TRANSACTIONS | ROLLBACK_TRANSACTIONS | DENIED_CONNECTIONS | LOST_CONNECTIONS | ACCESS_DENIED | EMPTY_QUERIES |
+--------+-------------------+------------------------+----------------+--------------------+--------------------+----------------+---------------+----------------------+----------------+-------------+--------------+---------------+--------------+-----------------+-----------------+----------------+---------------------+-----------------------+--------------------+------------------+---------------+---------------+
| s51230 |           1347938 |                      0 |      368114873 |   81299711.2201239 |  53723620.50059047 |   185491801581 |  764480493647 |          30960725399 | 52610415710904 |   830642646 |      3127998 |      91713940 |      3763859 |      1638306511 |        51054894 |          32860 |          1740401202 |                   509 |                 21 |                0 |             7 |    1558254245 |
| s51512 |           9440845 |                      0 |       98644949 | 14816278.866112227 | 13959037.286527593 |    11469670282 |   39321050007 |           5518845389 |       77498516 |    42048456 |         8057 |       1594456 |     22271159 |        56668973 |        22494486 |        9441614 |            97040832 |               2305228 |                 11 |                0 |            11 |      43645673 |
| s51434 |            787014 |                      0 |       31772352 | 15903539.425553104 | 12006658.779976306 |    20825946652 |  277807760669 |           4198830911 | 10438511814420 |  1289269515 |      1100812 |     170118528 |      3702243 |       172892445 |        15756355 |        1129042 |           144026630 |                  2805 |                  7 |                0 |             5 |     147482689 |
| s51999 |            351566 |                      0 |       25168310 |   8744374.96968273 |  7166010.986397289 |    42602682934 |  254098781523 |          44071282447 |   981022530813 |  4236156654 |       294927 |    1213251691 |      6726316 |       180737844 |        92396492 |            127 |            92610319 |                     7 |               4165 |             2113 |             4 |     153835051 |
| s52421 |           1771580 |                      0 |        8099811 |  7233605.924835308 |  6909184.534048288 |    23765703624 |   33238678360 |          38533309115 |  3881261653347 |    90228052 |       204931 |      52188057 |      2838207 |          741094 |        51188207 |             18 |            51962603 |                     0 |                  1 |               83 |             1 |        389267 |
| u11916 |             51013 |                      0 |        6100123 | 3887655.5920485617 | 3143612.3515187167 |     1723157478 |    2058500034 |           1809903379 |  1833277181971 |    19807468 |      2075244 |       5151571 |       630459 |          218067 |         8250449 |          56246 |            13587785 |                    93 |               8403 |                0 |           242 |         35196 |
| s51071 |           1552170 |                      0 |        5183238 |  5112150.366570913 | 2454295.8934034365 |     1330457461 |  182594930486 |         325785364419 |   738831297018 |  3034039186 |          189 |    3154585863 |            0 |         3295696 |         3271994 |         468580 |                5938 |                     3 |                 22 |                0 |             5 |        282623 |
| s51412 |          31457858 |                      0 |       25758349 | 13911113.929966208 | 2225328.5891959267 |   568027540096 | 1360487798780 |         702599481013 |  1233130821924 | 27737227740 |    310105250 |    1900849067 |   2306921911 |      1108691412 |      1473009965 |       55906623 |          2010660466 |             228801774 |                 95 |                0 |            24 |     132227842 |
| s51401 |             59820 |                      0 |        5621132 |  2518899.464454003 | 1774178.9583080332 |   872707559435 |  327296111689 |         867503841421 |    23771035104 | 10990138277 |  10985165290 |   12729456272 |   1718646415 |        22073270 |        47478418 |          83707 |            47479590 |                     0 |                  0 |                0 |             0 |         70692 |
| s52129 |            698493 |                      0 |        2768695 |  2746254.528713612 |  1680509.609197573 |      222172519 |   11531236231 |                    0 |   628549213738 |    40761273 |            0 |             0 |            0 |          698531 |               0 |              7 |                   0 |                     0 |                  0 |                0 |             0 |        109284 |
+--------+-------------------+------------------------+----------------+--------------------+--------------------+----------------+---------------+----------------------+----------------+-------------+--------------+---------------+--------------+-----------------+-----------------+----------------+---------------------+-----------------------+--------------------+------------------+---------------+---------------+
Thank you. Not sure if I understand the situation with the privacy, you mean that there is no way to exclude the queries from other people which may contain information that I should not see - as the bot operator, I do know (in principle) which queries the bot runs.
Regarding the three points:
Note: I see I use about 4 times as much CPU. I will throttle the bot further later.
P.S. I managed to break one of the keys on the table (now regenerating), which results in very long queries at this moment. I hope the key will be ready soon.
Grr, I noted a bug on one of the counts (resolved) - it is now counting those and filling the proper table to reduce the counts. Re-indexing of the broken index is now done.
Not sure if I understand the situation with the privacy, you mean that there is no way to exclude the queries from other people which may contain information that I should not see - as the bot operator, I do know (in principle) which queries the bot runs.
I did not mention (or at least did not intend to mention) anything regarding privacy- I was suggesting asking for *dedicated* resources outside of tools db so both you and the rest of users have more cpu. I cannot guarantee such a request would be approved, but you should ask it with a separate phab ticket and I would support it. You would also have better profiling over that instance and I would help you migrating it.
One option would be to use https://wikitech.wikimedia.org/wiki/RCStream instead of the database for changes. However, link changes are not updated in real time. I could get you a such a feed on the replicas, with a trigger so it is "push" instead of "pull", but that would require mariadb 10.1, and not the current 10.
Hi. Is it possible to have at least COIBot reporting again at Meta-Wiki? Our anti-spam efforts ain't much productive if we can't have those reports. Regards.
I think linkwatcher DB was moved out of toolsdb to it's own trove DB T328691: [toolsdb] Migrate linkwatcher db to Trove, so this task can be resolved \e/
There's still things that can be done to improve the DB performance (see T224154: Reduce size of linkwatcher db if at all possible), but it should not be affecting other toolforge users anymore.