Page MenuHomePhabricator

Investigate the increase in the number of requests to Swift after the Page Previews deploy
Closed, ResolvedPublic

Description

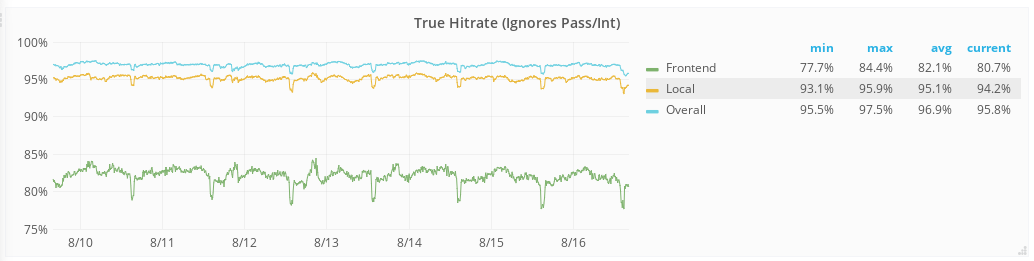
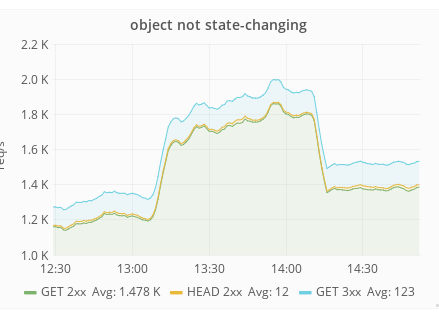
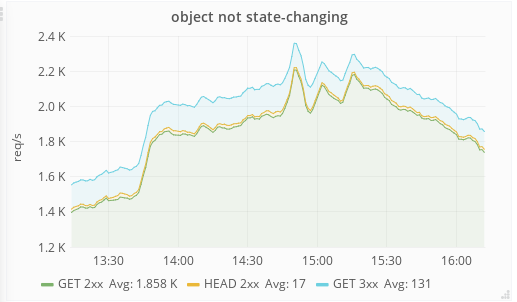
Page Previews was enabled by default for all anons on another 100 wikis on Wednesday, 16th August between 1-2 PM UTC.

Soon after @fgiunchedi noticed a spike in the number of requests to Swift. Obviously, Page Previews will result in an increased number of requests for images so it seems likely that this spike is related to the deployment.

Is the spike damagingly high? How is cache_upload holding up under increased pressure? How does this feed back into the Page Previews deployment plan?

Event Timeline

Restricted Application added a subscriber: Aklapper. · View Herald Transcript
phuedx renamed this task from [Spike] Investigate the increase in the number of requests to Swift after the Page Previews deploy to Investigate the increase in the number of requests to Swift after the Page Previews deploy.Aug 16 2017, 3:35 PM

So the increase in swift requests seem to be cyclic (daily) and corresponds to dips in cache_upload hitrate as per the graph below.

2017-08-16-180748_1034x261_scrot.png (261×1 px, 44 KB)
And an equivalent spike in swift requests (zoomed in on a given day)
2017-08-16-180049_439x316_scrot.png (316×439 px, 23 KB)

Today's spike is different in the sense that it started around 13:43 when EU swat was finished but didn't (yet? never?) "recovered" clean-cut as other days:

2017-08-16-181325_517x302_scrot.png (302×517 px, 28 KB)

Though I can't find a corresponding big increase request rate in action API at the same time, which would mean actual link hovers from PPs (unless I'm missing something?).

The spikes in the latest swift requests from today is me cycling through varnish with big mailbox lags and expected/normal.

tl;dr the spike in swift requests might have been a coincidence with today's PP deploy. (to answer @phuedx first question of "is the spike damagingly high?")

re: cache_upload's pressure I can't tell for sure if the additional 100 wikis had a significant impact in terms of req/s

You can see a view of cache_upload's over all 2xx (and everything else) here: https://grafana.wikimedia.org/dashboard/db/varnish-aggregate-client-status-codes?panelId=2&fullscreen&orgId=1&var-site=All&var-cache_type=upload&var-status_type=2&from=now-30d&to=now .

There might have been a small average increase, but we don't yet have a full week of data to compare for before/after the 16th. It looks like about a 3% increase in reqs/sec so far, but once we have a full week for comparison (same days-of-week in comparison windows) that may change (probably become smaller).

Cache hitrate graphs for upload are here: https://grafana.wikimedia.org/dashboard/db/varnish-caching?refresh=15m&orgId=1&var-cluster=upload&var-site=All&from=now-30d&to=now . Again, there doesn't seem to be a significant effect starting on the 16th. There are some small variations we could try to parse out, but honestly there's always small variations and changes going on there, and the effect falls well within normal noise at this level.

So from cache_upload's own perspective, the changes don't seem very significant. However, keep in mind that the average hitrate for the upload cluster is around 94% of overall requests, and 96.8% of potentially-cacheable requests (the difference being caused by things like internal redirects, error outputs, etc). Therefore, what looks like a minimal effect in cache_upload's graphs could be a significant swing in Swift requests. For example, a shift from 96.8% true hitrate to 95% true hitrate would look insignificant at the cache_upload layer, but implies Swift traffic went from 3.2% of cacheable requests to 5% of cacheable requests, which is a 56% increase in Swift traffic.

So in that sort of light, if we zoom in on your approximate timeframe for the change on the 16th, we see the overall true hitrate at the 13:00 mark was 96.8% (happens to be an average time!), but by about 13:40 there's a significant shift downwards happening. It bottoms out at a worst sample of 94.9% around 14:49 and then begins slowly recovering, eventually reaching back to normal levels. I was tempted to say this pattern might have been related to your deployment (cache contents adapting to new hotness patterns?), and perhaps it was exacerbated by the deployment. However, if you scroll around several days before and after, there's a cyclic dip in hitrate around this time. I don't know the cause of it (there's a lot of global patterns in play), but there's almost always a notable dropoff in hitrate for an hour or two somewhere around the ~12:00-14:00 mark. You can see it here in the days before the 16th deployment:

https://grafana.wikimedia.org/dashboard/db/varnish-caching?refresh=15m&orgId=1&var-cluster=upload&var-site=All&from=1502530133567&to=1502799759087

@BBlack do you have any qualms about us continuing our roll out in T162672 ? The remaining wikis are quite small, zh being the biggest.

No qualms on the cache end of things!

I'm +1 on the swift side to resume rollout everywhere but en/de

I think we can resolve this task, for swift I got T173721 going. The increase doesn't seem related to the PP deploy and happens periodically anyway, it will need separate investigation. Thoughts?

phuedx claimed this task.

@fgiunchedi: +1

🎉🎉🎉