Page MenuHomePhabricator

Trends for editor types, and new editors in particular (in Wikistats 2.0)
Open, MediumPublic

Description

It does not seem to be possible to make a graph of editors trends in Wikistats 2.0, especially for new editors. The current Wikipedia Statistics English has a column (B) for new editors. Still note that the current definition from the old wikistats is a bit confusing.

It seems like the Wikistats 2.0 focus on technical differences, aka bot or real user (Split by editor type), but for the community it is more important to know the trends for active editors. How many new editors are there, how does editors become more active, what makes them go to lower activity. It is especially important to identify changes in editor retention. How many has been active previous three months that hasn't been active last three months. It could be better to use one year averages as that would remove some noise, but that makes the changes show up very slowly. Shorter averages should be a multiple of weeks to suppress noise.

Nowiki-new-editors.2013-05-19.png (340×605 px, 22 KB)

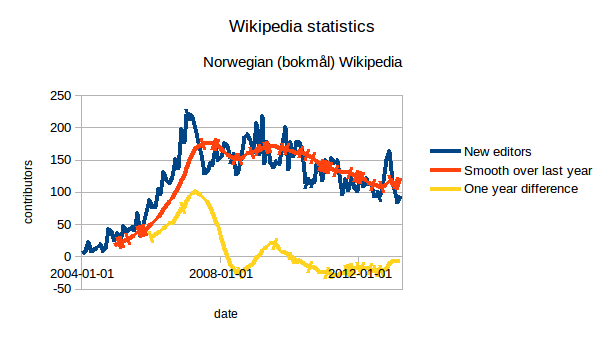
In this example the red graph is a one year average, and the yellow graph is a one year difference over the average.

Event Timeline

Restricted Application added a subscriber: Aklapper. · View Herald Transcript

Nice, cc @Erik_Zachte does this one have an equivalent in stats.wikimedia.org?

The way I calculate this is pretty dumb. It is a simple average over last twelve months and previous twelve months, and the difference between them. As there is a trend over those intervals, the average is lagging. That creates a slight problem with the interpretation.

Also, the current wikistats 1.0 has a problem with the definition of a new editor, as it constantly redefines what is a new editor. That makes it difficult to compare numbers, as the numbers constantly increases for previous months. Instead of the current definition (or lack thereof) a definition should be used where a new editor is one that has registered and then within a given timeframe makes a specific number of edits. There might be some additional spurious new users for previous months, but they are better catched by larger selectable timeframes.

Note that it should not be possible to make a graph for a time closer to now than the current timeframe. If you select a one month timeframe, then the graph must end at the previous month.

Milimetric triaged this task as Medium priority.Mar 9 2020, 4:33 PM
Milimetric moved this task from Backlog (Later) to Wikistats on the Analytics board.

Two years later it does not seem likely that rolling averages will be implemented.

Two years later it does not seem likely that rolling averages will be implemented.

That's correct, the work we expect to tackle in the mid term is arround calculating active editors for all projects, which is a lot more basic that the features requested on this ticket

This is real important and seems fairly easy to achieve. The graphs as they are now have limited usefulness for answering real-world questions (which tend to be of the type, "are we doing better or worse than last year?" or "we did this thing, what effect did it have on the stats?").

(Granted, it could be done in a Toolforge tool just as easily, the API already provides all the necessary data.)