Page MenuHomePhabricator

db1114 connection issues
Closed, ResolvedPublic

Description

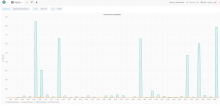
db1114 is having more connection errors than all other servers. https://logstash.wikimedia.org/goto/fe57fdbf7cdd60e3e2114ef27fa255b9

Screenshot_20180411_180655.png (911×1 px, 56 KB)

At first I thought it was some missing grants (eg. missing or using old_passwords), so I reloaded the grants. The errors keep happening.
Then I tried increasing the connection pool size, to see if there was too much delay on getting a connection. That also doesn't seem to affect.

Needs research, but I don't want to depool it because connections seem to succeed and execute queries, only a percentage (but a high ones) seems to fail to connect.

UPDATE of what have been seen/debugged
As there are lots of comments, this is a sum up of the fact that we have seen or debugged.

  • The traffic spikes happen every 10 minutes, even to the second. These are examples of logged errors
05:20:10
05:30:10
05:40:12

This can been seen at: https://logstash.wikimedia.org/goto/f0353f4fa142a6484867fe3941baa340

And after a reboot they moved to XX:24:11 kind of timing: T191996#4133478

  • While those spikes happen, the server drop packets - this has been confirmed by looking at the ifconfig output after every burst. T191996#4129334
    • This has been mitigated by increasing the RX buffers and looks like it is not dropping anymore - but we still have connection errors: T191996#4138553
  • While these errors happen. tcpdump doesn't show any traffic from terbium or tendril. Just traffic coming from mw hosts. Almost double the traffic during those seconds, but "normal" traffic apparently. T191996#4129117
  • These errors only happen on db1114 while it servers API traffic. If the server is removed from API traffic and only servers main, this doesn't happen.
  • This server is the only one suffering this. Neither db1066 or db1080 (other enwiki api slaves) suffer this. Not even when db1114 is depooled and they assume its traffic.
  • db1114 is running stretch and mariadb 10.1. db1066 and db1080 run jessie and mariadb 10.0
  • db1114 has the same schema definition in all the tables than db1066 and db1080.
  • No HW errors found on the idrac
  • Dropping traffic from einsteinium doesn't make errors to stop. So not related to that.
  • Changed network cable - no effect T191996#4136190
  • Went back to previous kernel+network driver - there was not a big significant change on the number of errors or dropped packets T191996#4133555
  • Idle % looks like to drop below 80 during the events. These are two examples: T191996#4138764
  • NICs smp affinity is distributed across cores: T191996#4139205
  • The culprit was atop: T191996#4139494 T191996#4141772 T191996#4142677

Next tests:

- Use NIC #2 instead of #1 and monitor its behaviour
- Try to force eth speed instead of negotiating it
- Change switch port
- Change the host to a different rack and move it to a different "old" switch
- reimage the host to jessie
Event Timeline

There are a very large number of changes, so older changes are hidden. Show Older Changes

So during the errors, normally around 5 seconds or so, there is a burst in connections, which almost double the normal amount of connections.
Examples

Time and amount of hits on tcpdump to port 3306

07:10:10
952
07:10:11
33780
07:10:12
17168
07:10:13
18912
07:10:14
18225
07:10:15
18580
07:20:10
29894
07:20:11
19477
07:20:12
15058
07:20:13
13127
07:20:14
5499
07:20:15
8253

Change 425970 had a related patch set uploaded (by Marostegui; owner: Marostegui):
[operations/mediawiki-config@master] db-eqiad.php: Depool db1114

https://gerrit.wikimedia.org/r/425970

From the captures, I only see "normal" traffic as in: mw hosts, db1052 (the master) and db1115 (tendril).

Change 425970 merged by jenkins-bot:
[operations/mediawiki-config@master] db-eqiad.php: Depool db1114

https://gerrit.wikimedia.org/r/425970

Mentioned in SAL (#wikimedia-operations) [2018-04-13T08:24:50Z] <marostegui@tin> Synchronized wmf-config/db-eqiad.php: Fully depool db1114 - T191996 (duration: 01m 00s)

Mentioned in SAL (#wikimedia-operations) [2018-04-13T08:42:25Z] <marostegui@tin> Synchronized wmf-config/db-eqiad.php: Repool db1114 in API - T191996 (duration: 01m 00s)

We can now discard tendril for sure as a cause of this (it was hard to believe it was it anyways, but better to confirm it).
I used iptables to drop all the traffic coming from tendril DB (db1115) and I just saw errors again on logtash and on grafana while db1114 is pooled in API (and not main)

This host has dropped around 300 packets in 15h or so.
Yesterday I checked the amount of drops in its interface and it was 1815, today it is 2103.

More drops in the last bursts
Counter: 2433
After a burst: 2437
After another burst: 2440

By looking at the switch graphs I have seen that the port isn't marked as Full Duplex, whereas db1099 (also stretch) for instance is. I don't know if it is a graph thing only or not. But it is worth checking with @ayounsi
Looking at the interface on the OS:

root@db1114:/var/log# mii-tool eno1
eno1: negotiated, link ok

And this is db1099 (stretch too):

root@db1099:~# mii-tool eno1
eno1: negotiated 1000baseT-FD flow-control, link ok

However, ethtool does show Full duplex.
But the output is different on db1099 and db1114 (same ethtool version)

db1099

	Link partner advertised link modes:  10baseT/Half 10baseT/Full
	                                     100baseT/Half 100baseT/Full
	                                     1000baseT/Full
	Link partner advertised pause frame use: Symmetric
	Link partner advertised auto-negotiation: Yes

db1114

	Link partner advertised link modes:  1000baseT/Full
	Link partner advertised pause frame use: No
	Link partner advertised auto-negotiation: Yes

Change 426047 had a related patch set uploaded (by Marostegui; owner: Marostegui):
[operations/mediawiki-config@master] db-eqiad.php: Depool db1114

https://gerrit.wikimedia.org/r/426047

Change 426047 merged by jenkins-bot:
[operations/mediawiki-config@master] db-eqiad.php: Depool db1114

https://gerrit.wikimedia.org/r/426047

Mentioned in SAL (#wikimedia-operations) [2018-04-13T14:16:41Z] <marostegui@tin> Synchronized wmf-config/db-eqiad.php: Depool db1104 - T191996 (duration: 00m 59s)

Mentioned in SAL (#wikimedia-operations) [2018-04-13T14:22:39Z] <XioNoX> enable flow control on db1114's switch port - T191996

After changing the port configuration and for the records, this is what the interface is showing

RX errors 0  dropped 2487  overruns 0  frame 0

We'll see what happens once the server gets repooled again.

Mentioned in SAL (#wikimedia-operations) [2018-04-13T14:28:44Z] <marostegui@tin> Synchronized wmf-config/db-eqiad.php: Repool db1104 - T191996 (duration: 01m 07s)

Adding the tag to reflect work done at network layer.

Change 426051 had a related patch set uploaded (by Marostegui; owner: Marostegui):
[operations/mediawiki-config@master] db-eqiad.php: db1114 increase weight

https://gerrit.wikimedia.org/r/426051

Another burst of errors and more packet drops :-(

RX errors 0  dropped 2491  overruns 0  frame 0
db1114 ethtool eno1
Supported pause frame use: No
Advertised pause frame use: Symmetric
Link partner advertised pause frame use: No
db1114s switchport
Flow control: Disabled
Output drops: 242656
Link partner:
    Link mode: Full-duplex, Flow control: Symmetric
Local resolution:
    Flow control: None, Flow control tx: None, Flow control rx: None,
MAC pause frames                         0                0

To compare with db1099

db1099 ethtool eno1
Supported pause frame use: No
Advertised pause frame use: Symmetric
Link partner advertised pause frame use: Symmetric
db1099s switchport
asw-b-eqiad> show interfaces ge-2/0/9 extensive
Flow control: Enabled,
 Link partner:
     Flow control: Symmetric
 Local resolution:
     Flow control: Symmetric
MAC pause frames receive: 6360

db1099 is on a (very) old switch, that have flow-control enabled by default.
While db1114 is on a more recent switch, with flow-control disabled by default.

Some high level doc about flow-control: https://datacenteroverlords.com/2013/02/02/ethernet-congestion-drop-it-or-pause-it/

Note that (if it helps here), flow-control shouldn't be a long term solution to deal with traffic bursts.
More sustainable fix is to locate the cause of those bursts to reduce them, or see why/if a higher level protocol (eg. tcp) doesn't smooth those bursts out.

I enabled flow-control on the switchport to see if it solves or helps with the issue:

[edit interfaces ge-4/0/34]
+    ether-options {
+        flow-control;
+    }

Confirmed enabled:
Link partner advertised pause frame use: Symmetric

And switch is now seeing received MAC pause frames. Which confirms that the server is receiving busts of traffic it can't cope with.

@ayounsi thanks for your help.
If you want to compare it with the other two servers that receive exactly the same traffic, those are: db1066 and db1080.

Change 426051 merged by jenkins-bot:
[operations/mediawiki-config@master] db-eqiad.php: db1114 increase weight

https://gerrit.wikimedia.org/r/426051

Mentioned in SAL (#wikimedia-operations) [2018-04-13T16:24:58Z] <marostegui@tin> Synchronized wmf-config/db-eqiad.php: Give db1104 some main traffic - T191996 (duration: 01m 00s)

1/ Flow-control not helping, reverted

2/ Are the other servers seeing the same bursts of inbound sessions?

3/ The ifconfig input drop counter matches the nic stats (ethtool -S eno1) counters:
rx_discards: 2506
mbuf_lwm_thresh_hit: 2506

I couldn't find any doc about what "mbuf_lwm_thresh_hit" means, other than it seems to be a Broadcom specific counter and seems to be added by: https://www.spinics.net/lists/netdev/msg161734.html

4/ db1066 and db1114 use the same NIC, have the same NIC and kernel/os settings, but have different OS (Debian 8 vs. 9) and different firmware versions (ethtool -i eno1).

5/ Did the issue started recently? Did anything change that could potentially cause those issues?

6/ Possible next step is to try a different NIC on the server

So given that db1066 and db1080 have the same traffic than db1114 (and even more when db1114 gets depooled from API) and they don't suffer any kind of issues, could we assume this is related only to db1114, maybe we can do the following tests:

  • Enable eth1 and disable eth0 to discard physical issues with that nic

1/ Flow-control not helping, reverted

Cool

2/ Are the other servers seeing the same bursts of inbound sessions?

They do not show any connection errors on logtash like db1114. Which is almost every 10 minutes and to the second.
And they don't even show that when db1114 is depooled (and they assume that traffic)

3/ The ifconfig input drop counter matches the nic stats (ethtool -S eno1) counters:
rx_discards: 2506
mbuf_lwm_thresh_hit: 2506

I couldn't find any doc about what "mbuf_lwm_thresh_hit" means, other than it seems to be a Broadcom specific counter and seems to be added by: https://www.spinics.net/lists/netdev/msg161734.html

4/ db1066 and db1114 use the same NIC, have the same NIC and kernel/os settings, but have different OS (Debian 8 vs. 9) and different firmware versions (ethtool -i eno1).

Yeah, I talked to @jcrespo that one of the tests I wanted to do was to reimage this host as jessie, but wanted to try other things before.

5/ Did the issue started recently? Did anything change that could potentially cause those issues?

Nope, pretty much when we started to serve traffic with it. But it took us sometime to realise it was this bad.

6/ Possible next step is to try a different NIC on the server

:-) T191996#4130019 you beat me for a few seconds!
@Cmjohnson can you help us here?

We'd need to:

  • downtime the host
  • depool the server (Manuel)
  • configure OS network/interfaces (Manuel)
  • change the cable to the second interface (eno2) once the above steps are done @Cmjohnson
Marostegui updated the task description. (Show Details)

I have written a summary of the current state of debugging on the original task description, so it is easier to read instead of going thru all the comments

Mentioned in SAL (#wikimedia-operations) [2018-04-16T07:49:56Z] <marostegui> Stop MySQL and reboot db1114 - T191996

Change 426909 had a related patch set uploaded (by Marostegui; owner: Marostegui):
[operations/mediawiki-config@master] db-eqiad.php: Depool db1114

https://gerrit.wikimedia.org/r/426909

After the last reboot the errors have moved from being at times like:

XX:10:11
XX:20:11
XX:30:11

To:
XX:04:11
XX:24:11
XX:34:11

Change 426909 merged by jenkins-bot:
[operations/mediawiki-config@master] db-eqiad.php: Depool db1114

https://gerrit.wikimedia.org/r/426909

Mentioned in SAL (#wikimedia-operations) [2018-04-16T13:31:13Z] <marostegui> Stop MySQL on db1114 to reboot with another kernel - T191996

As another test to discard issues - I have rebooted db1114 with an older kernel.
So it is now running

root@db1114:~# uname -a
Linux db1114 4.9.0-4-amd64 #1 SMP Debian 4.9.65-3+deb9u1 (2017-12-23) x86_64 GNU/Linux

And the driver version

root@db1114:~# ethtool -i eno1
driver: tg3
version: 3.137
firmware-version: FFV20.6.18 bc 5720-v1.39
expansion-rom-version:
bus-info: 0000:01:00.0
supports-statistics: yes
supports-test: yes
supports-eeprom-access: yes
supports-register-dump: yes
supports-priv-flags: no

Instead of:

root@db1114:~# uname -a
Linux db1114 4.9.0-6-amd64 #1 SMP Debian 4.9.82-1+deb9u3 (2018-03-02) x86_64 GNU/Linux

Change 426915 had a related patch set uploaded (by Marostegui; owner: Marostegui):
[operations/mediawiki-config@master] db-eqiad.php: Slowly repool db1114

https://gerrit.wikimedia.org/r/426915

Change 426915 merged by jenkins-bot:
[operations/mediawiki-config@master] db-eqiad.php: Slowly repool db1114

https://gerrit.wikimedia.org/r/426915

Mentioned in SAL (#wikimedia-operations) [2018-04-16T14:43:14Z] <marostegui@tin> Synchronized wmf-config/db-eqiad.php: Fully repool db1114 in API - T191996 (duration: 00m 58s)

There is definitely an impact on which kernel we are running.
After running:

root@db1114:~# uname -a
Linux db1114 4.9.0-4-amd64 #1 SMP Debian 4.9.65-3+deb9u1 (2017-12-23) x86_64 GNU/Linux
root@db1114:~# ethtool -i eno1
driver: tg3
version: 3.137
firmware-version: FFV20.6.18 bc 5720-v1.39
expansion-rom-version:
bus-info: 0000:01:00.0
supports-statistics: yes
supports-test: yes
supports-eeprom-access: yes
supports-register-dump: yes
supports-priv-flags: no

For more than 12 hours, we can definitely see it is handling better the connection bursts (or whatever it is).
This is the errors graph for the last 72h:

screenshot-logstash.wikimedia.org-2018.04.17-07-03-07.png (173×1 px, 44 KB)

screenshot-grafana.wikimedia.org-2018.04.17-07-30-54.png (783×1 px, 184 KB)

And after almost 16h, there are only 155 dropped packets

RX errors 0  dropped 155  overruns 0  frame 0

I have rebooted the server to go back to the original kernel to see if the error rate goes back to as high as it used to:

root@db1114:~# uname -a
Linux db1114 4.9.0-6-amd64 #1 SMP Debian 4.9.82-1+deb9u3 (2018-03-02) x86_64 GNU/Linux
root@db1114:~# ethtool -i eno1
driver: tg3
version: 3.137
firmware-version: FFV20.6.18 bc 5720-v1.39
expansion-rom-version:
bus-info: 0000:01:00.0
supports-statistics: yes
supports-test: yes
supports-eeprom-access: yes
supports-register-dump: yes
supports-priv-flags: no

Note that the driver version is the same on both kernels.

Mentioned in SAL (#wikimedia-operations) [2018-04-17T06:03:55Z] <marostegui@tin> Synchronized wmf-config/db-eqiad.php: Fully repool db1114 in API - T191996 (duration: 00m 58s)

Change 427104 had a related patch set uploaded (by Marostegui; owner: Marostegui):
[operations/mediawiki-config@master] db-eqiad.php: Depool db1114

https://gerrit.wikimedia.org/r/427104

Change 427104 merged by jenkins-bot:
[operations/mediawiki-config@master] db-eqiad.php: Depool db1114

https://gerrit.wikimedia.org/r/427104

Cable has been replaced by @Cmjohnson just now.
Stats at the time:

RX errors 0  dropped 61  overruns 0  frame 0

And

root@db1114:~# ethtool -S eno1
NIC statistics:
     rx_octets: 96202680556
     rx_fragments: 0
     rx_ucast_packets: 419114226
     rx_mcast_packets: 88315217
     rx_bcast_packets: 11698
     rx_fcs_errors: 0
     rx_align_errors: 0
     rx_xon_pause_rcvd: 0
     rx_xoff_pause_rcvd: 0
     rx_mac_ctrl_rcvd: 0
     rx_xoff_entered: 0
     rx_frame_too_long_errors: 0
     rx_jabbers: 0
     rx_undersize_packets: 0
     rx_in_length_errors: 0
     rx_out_length_errors: 0
     rx_64_or_less_octet_packets: 0
     rx_65_to_127_octet_packets: 0
     rx_128_to_255_octet_packets: 0
     rx_256_to_511_octet_packets: 0
     rx_512_to_1023_octet_packets: 0
     rx_1024_to_1522_octet_packets: 0
     rx_1523_to_2047_octet_packets: 0
     rx_2048_to_4095_octet_packets: 0
     rx_4096_to_8191_octet_packets: 0
     rx_8192_to_9022_octet_packets: 0
     tx_octets: 126517880835
     tx_collisions: 0
     tx_xon_sent: 0
     tx_xoff_sent: 0
     tx_flow_control: 0
     tx_mac_errors: 0
     tx_single_collisions: 0
     tx_mult_collisions: 0
     tx_deferred: 0
     tx_excessive_collisions: 0
     tx_late_collisions: 0
     tx_collide_2times: 0
     tx_collide_3times: 0
     tx_collide_4times: 0
     tx_collide_5times: 0
     tx_collide_6times: 0
     tx_collide_7times: 0
     tx_collide_8times: 0
     tx_collide_9times: 0
     tx_collide_10times: 0
     tx_collide_11times: 0
     tx_collide_12times: 0
     tx_collide_13times: 0
     tx_collide_14times: 0
     tx_collide_15times: 0
     tx_ucast_packets: 372443072
     tx_mcast_packets: 1469
     tx_bcast_packets: 39
     tx_carrier_sense_errors: 0
     tx_discards: 0
     tx_errors: 0
     dma_writeq_full: 0
     dma_write_prioq_full: 0
     rxbds_empty: 1412
     rx_discards: 61
     rx_errors: 0
     rx_threshold_hit: 0
     dma_readq_full: 0
     dma_read_prioq_full: 0
     tx_comp_queue_full: 0
     ring_set_send_prod_index: 0
     ring_status_update: 0
     nic_irqs: 0
     nic_avoided_irqs: 0
     nic_tx_threshold_hit: 0
     mbuf_lwm_thresh_hit: 61

Mentioned in SAL (#wikimedia-operations) [2018-04-17T14:59:27Z] <marostegui@tin> Synchronized wmf-config/db-eqiad.php: Repool db1114 after changing the network cable - T191996 (duration: 01m 02s)

Changing the network cable didn't have any effect. Errors are still there

RX errors 0  dropped 219  overruns 0  frame 0
root@db1114:~# ethtool -S eno1
NIC statistics:
     rx_octets: 330503521066
     rx_fragments: 0
     rx_ucast_packets: 1498624880
     rx_mcast_packets: 202029939
     rx_bcast_packets: 29152
     rx_fcs_errors: 0
     rx_align_errors: 0
     rx_xon_pause_rcvd: 0
     rx_xoff_pause_rcvd: 0
     rx_mac_ctrl_rcvd: 0
     rx_xoff_entered: 0
     rx_frame_too_long_errors: 0
     rx_jabbers: 0
     rx_undersize_packets: 0
     rx_in_length_errors: 0
     rx_out_length_errors: 0
     rx_64_or_less_octet_packets: 0
     rx_65_to_127_octet_packets: 0
     rx_128_to_255_octet_packets: 0
     rx_256_to_511_octet_packets: 0
     rx_512_to_1023_octet_packets: 0
     rx_1024_to_1522_octet_packets: 0
     rx_1523_to_2047_octet_packets: 0
     rx_2048_to_4095_octet_packets: 0
     rx_4096_to_8191_octet_packets: 0
     rx_8192_to_9022_octet_packets: 0
     tx_octets: 459685625156
     tx_collisions: 0
     tx_xon_sent: 0
     tx_xoff_sent: 0
     tx_flow_control: 0
     tx_mac_errors: 0
     tx_single_collisions: 0
     tx_mult_collisions: 0
     tx_deferred: 0
     tx_excessive_collisions: 0
     tx_late_collisions: 0
     tx_collide_2times: 0
     tx_collide_3times: 0
     tx_collide_4times: 0
     tx_collide_5times: 0
     tx_collide_6times: 0
     tx_collide_7times: 0
     tx_collide_8times: 0
     tx_collide_9times: 0
     tx_collide_10times: 0
     tx_collide_11times: 0
     tx_collide_12times: 0
     tx_collide_13times: 0
     tx_collide_14times: 0
     tx_collide_15times: 0
     tx_ucast_packets: 1332283414
     tx_mcast_packets: 3755
     tx_bcast_packets: 39
     tx_carrier_sense_errors: 0
     tx_discards: 0
     tx_errors: 0
     dma_writeq_full: 0
     dma_write_prioq_full: 0
     rxbds_empty: 5776
     rx_discards: 219
     rx_errors: 0
     rx_threshold_hit: 0
     dma_readq_full: 0
     dma_read_prioq_full: 0
     tx_comp_queue_full: 0
     ring_set_send_prod_index: 0
     ring_status_update: 0
     nic_irqs: 0
     nic_avoided_irqs: 0
     nic_tx_threshold_hit: 0
     mbuf_lwm_thresh_hit: 219

Change 427314 had a related patch set uploaded (by Marostegui; owner: Marostegui):
[operations/mediawiki-config@master] db-eqiad.php: Depool db1114

https://gerrit.wikimedia.org/r/427314

Change 427314 merged by jenkins-bot:
[operations/mediawiki-config@master] db-eqiad.php: Depool db1114

https://gerrit.wikimedia.org/r/427314

Mentioned in SAL (#wikimedia-operations) [2018-04-18T05:20:29Z] <marostegui> Change RX buffers on db1114 - T191996

RX buffers changed:

root@db1114:~# ethtool -g eno1
Ring parameters for eno1:
Pre-set maximums:
RX:		2047
RX Mini:	0
RX Jumbo:	0
TX:		511
Current hardware settings:
RX:		200
RX Mini:	0
RX Jumbo:	0
TX:		511
root@db1114:~# ethtool -G eno1 rx 2047
root@db1114:~# ethtool -g eno1
Ring parameters for eno1:
Pre-set maximums:
RX:		2047
RX Mini:	0
RX Jumbo:	0
TX:		511
Current hardware settings:
RX:		2047
RX Mini:	0
RX Jumbo:	0
TX:		511

Dropped packets after the change, for the record:

RX errors 0  dropped 222  overruns 0  frame 0

Mentioned in SAL (#wikimedia-operations) [2018-04-18T05:27:13Z] <marostegui@tin> Synchronized wmf-config/db-eqiad.php: Repool db1114 after changing RX buffers - T191996 (duration: 01m 09s)

For the record, this is the amount of dropped packets per server, of all the servers that are on that switch:

ores1008
        RX errors 0  dropped 11  overruns 0  frame 0
        RX errors 0  dropped 0  overruns 0  frame 0
mc1036
          RX packets:794932434705 errors:0 dropped:31792 overruns:0 frame:0
          RX packets:64360461 errors:0 dropped:0 overruns:0 frame:0
mc1035
          RX packets:817070183847 errors:0 dropped:23843 overruns:0 frame:0
          RX packets:67698739 errors:0 dropped:0 overruns:0 frame:0
mc1034
          RX packets:867385089432 errors:0 dropped:33903 overruns:0 frame:0
          RX packets:65839395 errors:0 dropped:0 overruns:0 frame:0
mc1033
          RX packets:881024245265 errors:0 dropped:75039 overruns:0 frame:0
          RX packets:70902765 errors:0 dropped:0 overruns:0 frame:0
aqs1006
          RX packets:6929846572 errors:0 dropped:43247 overruns:0 frame:0
          RX packets:630347346 errors:0 dropped:0 overruns:0 frame:0
druid1003
          RX packets:519485466 errors:0 dropped:844 overruns:0 frame:0
          RX packets:32802359 errors:0 dropped:0 overruns:0 frame:0
labweb1002
wtp1048
        RX errors 0  dropped 0  overruns 0  frame 0
        RX errors 0  dropped 0  overruns 0  frame 0
wtp1047
        RX errors 0  dropped 0  overruns 0  frame 0
        RX errors 0  dropped 0  overruns 0  frame 0
wtp1046
        RX errors 0  dropped 0  overruns 0  frame 0
        RX errors 0  dropped 0  overruns 0  frame 0
snapshot1007
          RX packets:73438269568 errors:0 dropped:1597903 overruns:0 frame:265314
          RX packets:11175167451 errors:0 dropped:0 overruns:0 frame:0
restbase1015
          RX packets:23825829722 errors:0 dropped:178747 overruns:0 frame:0
          RX packets:1524689857 errors:0 dropped:0 overruns:0 frame:0
restbase1014
          RX packets:23934464707 errors:0 dropped:178652 overruns:0 frame:0
          RX packets:1431084565 errors:0 dropped:0 overruns:0 frame:0
mw1226
          RX packets:55196601683 errors:0 dropped:8932 overruns:0 frame:0
          RX packets:11432599465 errors:0 dropped:0 overruns:0 frame:0
mw1225
          RX packets:45485285804 errors:0 dropped:5803 overruns:0 frame:0
          RX packets:9261482461 errors:0 dropped:0 overruns:0 frame:0
mw1224
          RX packets:44082437209 errors:0 dropped:5339 overruns:0 frame:0
          RX packets:8898321420 errors:0 dropped:0 overruns:0 frame:0
mw1223
          RX packets:43939572583 errors:0 dropped:5731 overruns:0 frame:0
          RX packets:8852008388 errors:0 dropped:0 overruns:0 frame:0
mw1222
          RX packets:45406881692 errors:0 dropped:5500 overruns:0 frame:0
          RX packets:9239416739 errors:0 dropped:0 overruns:0 frame:0
mw1221
          RX packets:45227541731 errors:0 dropped:5678 overruns:0 frame:0
          RX packets:9196370082 errors:0 dropped:0 overruns:0 frame:0
conf1006
        RX errors 0  dropped 0  overruns 0  frame 0
        RX errors 0  dropped 0  overruns 0  frame 0
db1062
          RX packets:148836480149 errors:0 dropped:0 overruns:0 frame:0
          RX packets:5 errors:0 dropped:0 overruns:0 frame:0
puppetmaster1002
        RX errors 0  dropped 0  overruns 0  frame 0
        RX errors 0  dropped 0  overruns 0  frame 0
elastic1027
          RX packets:32883825271 errors:0 dropped:84547 overruns:0 frame:0
          RX packets:2137991935 errors:0 dropped:0 overruns:0 frame:0
elastic1026
          RX packets:32595349234 errors:0 dropped:169611 overruns:0 frame:0
          RX packets:2135345610 errors:0 dropped:0 overruns:0 frame:0
elastic1025
          RX packets:31835474052 errors:0 dropped:78093 overruns:0 frame:0
          RX packets:2154190786 errors:0 dropped:0 overruns:0 frame:0
elastic1024
          RX packets:31913920401 errors:0 dropped:80265 overruns:0 frame:0
          RX packets:2156225758 errors:0 dropped:0 overruns:0 frame:0
elastic1023
          RX packets:30054019093 errors:0 dropped:89500 overruns:0 frame:0
          RX packets:2147566687 errors:0 dropped:0 overruns:0 frame:0
analytics1041
          RX packets:38262877617 errors:0 dropped:146426 overruns:0 frame:0
          RX packets:2445570570 errors:0 dropped:0 overruns:0 frame:0
analytics1040
          RX packets:42406662940 errors:0 dropped:141705 overruns:0 frame:0
          RX packets:2380178273 errors:0 dropped:0 overruns:0 frame:0
analytics1039
          RX packets:38319631870 errors:0 dropped:150733 overruns:0 frame:0
          RX packets:2469585383 errors:0 dropped:0 overruns:0 frame:0
analytics1038
          RX packets:38128197713 errors:0 dropped:145297 overruns:0 frame:0
          RX packets:2436625366 errors:0 dropped:0 overruns:0 frame:0

I will check in 24h to see how it grows (if it does)

And switch is now seeing received MAC pause frames. Which confirms that the server is receiving busts of traffic it can't cope with.

@ayounsi does that mean that the switch is the one not being able to cope with the bursts and not the server? See: T191996#4138424 (the servers under that switch have quite lots of drop packets, which seem to be increasing all the time).
This is a diff of the dropped packets within one hour:

 restbase1014
-178665
+178747

 mw1226
-8937
+8941

 mw1225
-5806
+5811

 mw1222
-5507
+5508

 mw1221
-5684
+5686

 elastic1027
-84552
+84601

 elastic1026
-169798
+169860

 elastic1025
-78103
+78125

 elastic1024
-80266
+80268

 elastic1023
-89529
+89541

 analytics1041
-146487
+146555

 analytics1040
-141749
+141825

 analytics1039
-150786
+150887
 
analytics1038
-145348
+145448

https://kb.juniper.net/InfoCenter/index?page=content&id=KB25942 that says it is 300 seconds, any chance that could be 600 for us? Which would explain the connection errors?

RX buffers changed:

root@db1114:~# ethtool -g eno1
Ring parameters for eno1:
Pre-set maximums:
RX:		2047
RX Mini:	0
RX Jumbo:	0
TX:		511
Current hardware settings:
RX:		200
RX Mini:	0
RX Jumbo:	0
TX:		511
root@db1114:~# ethtool -G eno1 rx 2047
root@db1114:~# ethtool -g eno1
Ring parameters for eno1:
Pre-set maximums:
RX:		2047
RX Mini:	0
RX Jumbo:	0
TX:		511
Current hardware settings:
RX:		2047
RX Mini:	0
RX Jumbo:	0
TX:		511

Dropped packets after the change, for the record:

RX errors 0  dropped 222  overruns 0  frame 0

No more drops or rxbds_empty after this buffer change.

   RX errors 0  dropped 222  overruns 0  frame 0

rxbds_empty: 5845
rx_discards: 222
rx_errors: 0
rx_threshold_hit: 0
dma_readq_full: 0
dma_read_prioq_full: 0
tx_comp_queue_full: 0
ring_set_send_prod_index: 0
ring_status_update: 0
nic_irqs: 0
nic_avoided_irqs: 0
nic_tx_threshold_hit: 0
mbuf_lwm_thresh_hit: 222

However connection errors are still happening (a bit less than before) but still exactly every 10 minutes (to the second) //cc @ema
@ayounsi could this mean that it is the switch the one dropping packets now maybe? As the server iface looks stable?

I have captured iostat ouput during two bursts of errors. And there is some reads and cpu spike on both of them, but nothing too worrying or two massive compared to the rest of the normal values.
Errors logged on logtash at 09:50:11, the spike in reads in CPU shows on iostat at 09:50:10. But there is not so much difference between those values and the rest of them. However, in both examples, the idle % goes below 80 and only on those two cases.

04/18/2018 09:50:00 AM
avg-cpu:  %user   %nice %system %iowait  %steal   %idle
           7.27    0.00    3.39    0.31    0.00   89.03

Device:            tps    kB_read/s    kB_wrtn/s    kB_read    kB_wrtn
sda             590.00      3056.00      3964.00       3056       3964
dm-0            586.00      3056.00      3964.00       3056       3964

04/18/2018 09:50:01 AM
avg-cpu:  %user   %nice %system %iowait  %steal   %idle
           8.12    0.00    4.28    0.37    0.00   87.23

Device:            tps    kB_read/s    kB_wrtn/s    kB_read    kB_wrtn
sda             616.00      3088.00      3368.00       3088       3368
dm-0            613.00      3088.00      3368.00       3088       3368

04/18/2018 09:50:02 AM
avg-cpu:  %user   %nice %system %iowait  %steal   %idle
           8.35    0.00    3.36    0.25    0.00   88.04

Device:            tps    kB_read/s    kB_wrtn/s    kB_read    kB_wrtn
sda             602.00      2592.00      3932.00       2592       3932
dm-0            598.00      2592.00      3928.00       2592       3928

04/18/2018 09:50:03 AM
avg-cpu:  %user   %nice %system %iowait  %steal   %idle
           8.52    0.00    3.76    0.25    0.00   87.47

Device:            tps    kB_read/s    kB_wrtn/s    kB_read    kB_wrtn
sda             570.00      3120.00      3428.00       3120       3428
dm-0            567.00      3120.00      3428.00       3120       3428

04/18/2018 09:50:04 AM
avg-cpu:  %user   %nice %system %iowait  %steal   %idle
           7.13    0.00    2.97    0.25    0.00   89.65

Device:            tps    kB_read/s    kB_wrtn/s    kB_read    kB_wrtn
sda             524.00      2448.00      3880.00       2448       3880
dm-0            520.00      2448.00      3880.00       2448       3880

04/18/2018 09:50:05 AM
avg-cpu:  %user   %nice %system %iowait  %steal   %idle
           7.73    0.00    3.27    0.25    0.00   88.76

Device:            tps    kB_read/s    kB_wrtn/s    kB_read    kB_wrtn
sda             447.00      1968.00      3236.00       1968       3236
dm-0            444.00      1968.00      3236.00       1968       3236

04/18/2018 09:50:06 AM
avg-cpu:  %user   %nice %system %iowait  %steal   %idle
           6.47    0.00    8.61    0.25    0.00   84.67

Device:            tps    kB_read/s    kB_wrtn/s    kB_read    kB_wrtn
sda             362.00      2736.00      1708.00       2736       1708
dm-0            361.00      2736.00      1708.00       2736       1708

04/18/2018 09:50:07 AM
avg-cpu:  %user   %nice %system %iowait  %steal   %idle
           1.07    0.00    6.83    0.00    0.00   92.10

Device:            tps    kB_read/s    kB_wrtn/s    kB_read    kB_wrtn
sda             122.00       112.00      2580.00        112       2580
dm-0            119.00       112.00      2580.00        112       2580

04/18/2018 09:50:08 AM
avg-cpu:  %user   %nice %system %iowait  %steal   %idle
           4.53    0.00    8.30    0.00    0.00   87.17

Device:            tps    kB_read/s    kB_wrtn/s    kB_read    kB_wrtn
sda             157.00       240.00      3556.00        240       3556
dm-0            134.00       240.00      3420.00        240       3420

04/18/2018 09:50:09 AM
avg-cpu:  %user   %nice %system %iowait  %steal   %idle
           5.69    0.00    8.92    0.13    0.00   85.26

Device:            tps    kB_read/s    kB_wrtn/s    kB_read    kB_wrtn
sda             380.00      1936.00      4920.00       1936       4920
dm-0            375.00      1952.00      4920.00       1952       4920

04/18/2018 09:50:10 AM
avg-cpu:  %user   %nice %system %iowait  %steal   %idle
          15.26    0.00    6.91    0.57    0.00   77.26

Device:            tps    kB_read/s    kB_wrtn/s    kB_read    kB_wrtn
sda             571.00      5216.00      2332.00       5216       2332
dm-0            568.00      5200.00      2332.00       5200       2332

04/18/2018 09:50:11 AM
avg-cpu:  %user   %nice %system %iowait  %steal   %idle
           8.37    0.00    4.28    0.12    0.00   87.23

Device:            tps    kB_read/s    kB_wrtn/s    kB_read    kB_wrtn
sda             355.00      1120.00      3624.00       1120       3624
dm-0            351.00      1120.00      3624.00       1120       3624

04/18/2018 09:50:12 AM
avg-cpu:  %user   %nice %system %iowait  %steal   %idle
          10.86    0.00    3.72    0.31    0.00   85.10

Device:            tps    kB_read/s    kB_wrtn/s    kB_read    kB_wrtn
sda             612.00      3872.00      4812.00       3872       4812
dm-0            606.00      3872.00      4812.00       3872       4812

04/18/2018 09:50:13 AM
avg-cpu:  %user   %nice %system %iowait  %steal   %idle
          13.76    0.00    3.82    0.19    0.00   82.23

Device:            tps    kB_read/s    kB_wrtn/s    kB_read    kB_wrtn
sda             328.00      1136.00      2560.00       1136       2560
dm-0            325.00      1136.00      2560.00       1136       2560

04/18/2018 09:50:14 AM
avg-cpu:  %user   %nice %system %iowait  %steal   %idle
           7.95    0.00    0.75    0.00    0.00   91.30

Device:            tps    kB_read/s    kB_wrtn/s    kB_read    kB_wrtn
sda             256.00       128.00      3260.00        128       3260
dm-0            260.00       128.00      3260.00        128       3260

04/18/2018 09:50:15 AM
avg-cpu:  %user   %nice %system %iowait  %steal   %idle
           1.56    0.00    0.62    0.00    0.00   97.82

Device:            tps    kB_read/s    kB_wrtn/s    kB_read    kB_wrtn
sda             231.00         0.00      3312.00          0       3312
dm-0            223.00         0.00      3196.00          0       3196

04/18/2018 09:50:16 AM
avg-cpu:  %user   %nice %system %iowait  %steal   %idle
           6.70    0.00    3.07    0.13    0.00   90.10

Device:            tps    kB_read/s    kB_wrtn/s    kB_read    kB_wrtn
sda             321.00      1232.00      2536.00       1232       2536
dm-0            318.00      1232.00      2536.00       1232       2536

04/18/2018 09:50:17 AM
avg-cpu:  %user   %nice %system %iowait  %steal   %idle
           8.04    0.00    3.43    0.25    0.00   88.29

Device:            tps    kB_read/s    kB_wrtn/s    kB_read    kB_wrtn
sda             411.00      1680.00      3424.00       1680       3424
dm-0            408.00      1680.00      3424.00       1680       3424

04/18/2018 09:50:18 AM
avg-cpu:  %user   %nice %system %iowait  %steal   %idle
           7.52    0.00    4.17    0.50    0.00   87.81

Device:            tps    kB_read/s    kB_wrtn/s    kB_read    kB_wrtn
sda             619.00      5200.00      1484.00       5200       1484
dm-0            619.00      5200.00      1484.00       5200       1484

04/18/2018 09:50:19 AM
avg-cpu:  %user   %nice %system %iowait  %steal   %idle
           7.58    0.00    3.22    0.19    0.00   89.01

Device:            tps    kB_read/s    kB_wrtn/s    kB_read    kB_wrtn
sda             858.00      1776.00      7508.00       1776       7508
dm-0            852.00      1776.00      7508.00       1776       7508

04/18/2018 09:50:20 AM
avg-cpu:  %user   %nice %system %iowait  %steal   %idle
          10.16    0.00    3.13    0.31    0.00   86.39

Device:            tps    kB_read/s    kB_wrtn/s    kB_read    kB_wrtn
sda             806.00      2016.00      4724.00       2016       4724
dm-0            803.00      2016.00      4688.00       2016       4688

04/18/2018 09:50:21 AM
avg-cpu:  %user   %nice %system %iowait  %steal   %idle
          13.69    0.00    3.31    0.50    0.00   82.50

Device:            tps    kB_read/s    kB_wrtn/s    kB_read    kB_wrtn
sda            1084.00      4832.00      8980.00       4832       8980
dm-0           1076.00      4832.00      8980.00       4832       8980

04/18/2018 09:50:22 AM
avg-cpu:  %user   %nice %system %iowait  %steal   %idle
          13.70    0.00    3.25    0.38    0.00   82.67

Device:            tps    kB_read/s    kB_wrtn/s    kB_read    kB_wrtn
sda             757.00      2512.00      4320.00       2512       4320
dm-0            756.00      2512.00      4320.00       2512       4320

04/18/2018 09:50:23 AM
avg-cpu:  %user   %nice %system %iowait  %steal   %idle
          13.82    0.00    3.53    0.12    0.00   82.53

Device:            tps    kB_read/s    kB_wrtn/s    kB_read    kB_wrtn
sda             819.00      1024.00      8736.00       1024       8736
dm-0            805.00      1040.00      8712.00       1040       8712

04/18/2018 09:50:24 AM
avg-cpu:  %user   %nice %system %iowait  %steal   %idle
          12.16    0.00    2.81    0.31    0.00   84.73

Device:            tps    kB_read/s    kB_wrtn/s    kB_read    kB_wrtn
sda             848.00      2864.00      4852.00       2864       4852
dm-0            844.00      2848.00      4848.00       2848       4848

04/18/2018 09:50:25 AM
avg-cpu:  %user   %nice %system %iowait  %steal   %idle
          12.46    0.00    2.80    0.25    0.00   84.49

Device:            tps    kB_read/s    kB_wrtn/s    kB_read    kB_wrtn
sda             791.00      2176.00      9568.00       2176       9568
dm-0            778.00      2176.00      9568.00       2176       9568

04/18/2018 09:50:26 AM
avg-cpu:  %user   %nice %system %iowait  %steal   %idle
          10.24    0.00    3.72    0.31    0.00   85.72

Device:            tps    kB_read/s    kB_wrtn/s    kB_read    kB_wrtn
sda             607.00      3184.00      2928.00       3184       2928
dm-0            604.00      3184.00      2916.00       3184       2916

04/18/2018 09:50:27 AM
avg-cpu:  %user   %nice %system %iowait  %steal   %idle
          11.67    0.00    2.81    0.25    0.00   85.27

Device:            tps    kB_read/s    kB_wrtn/s    kB_read    kB_wrtn
sda             713.00      2624.00      7236.00       2624       7236
dm-0            704.00      2624.00      7236.00       2624       7236

04/18/2018 09:50:28 AM
avg-cpu:  %user   %nice %system %iowait  %steal   %idle
          12.23    0.00    4.01    0.31    0.00   83.45

Device:            tps    kB_read/s    kB_wrtn/s    kB_read    kB_wrtn
sda             685.00      3440.00      3008.00       3440       3008
dm-0            684.00      3440.00      3008.00       3440       3008

The second example is at 10:10:10.
Errors logged at 10:10:10 on logtash.
And again, we can see the idle % goes below 80 at that given time:

04/18/2018 10:10:00 AM
avg-cpu:  %user   %nice %system %iowait  %steal   %idle
          11.16    0.00    2.95    0.25    0.00   85.64

Device:            tps    kB_read/s    kB_wrtn/s    kB_read    kB_wrtn
sda             330.00      2352.00      1376.00       2352       1376
dm-0            329.00      2352.00      1376.00       2352       1376

04/18/2018 10:10:01 AM
avg-cpu:  %user   %nice %system %iowait  %steal   %idle
          14.11    0.00    3.96    0.19    0.00   81.75

Device:            tps    kB_read/s    kB_wrtn/s    kB_read    kB_wrtn
sda             659.00      1920.00      6600.00       1920       6600
dm-0            650.00      1920.00      6596.00       1920       6596

04/18/2018 10:10:02 AM
avg-cpu:  %user   %nice %system %iowait  %steal   %idle
          11.76    0.00    2.82    0.13    0.00   85.29

Device:            tps    kB_read/s    kB_wrtn/s    kB_read    kB_wrtn
sda             488.00      1920.00      2624.00       1920       2624
dm-0            484.00      1920.00      2556.00       1920       2556

04/18/2018 10:10:03 AM
avg-cpu:  %user   %nice %system %iowait  %steal   %idle
          10.34    0.00    2.44    0.31    0.00   86.90

Device:            tps    kB_read/s    kB_wrtn/s    kB_read    kB_wrtn
sda             569.00      2656.00      6252.00       2656       6252
dm-0            561.00      2656.00      6252.00       2656       6252

04/18/2018 10:10:04 AM
avg-cpu:  %user   %nice %system %iowait  %steal   %idle
           7.85    0.00    3.24    0.25    0.00   88.66

Device:            tps    kB_read/s    kB_wrtn/s    kB_read    kB_wrtn
sda             333.00      2256.00      1080.00       2256       1080
dm-0            333.00      2256.00      1080.00       2256       1080

04/18/2018 10:10:05 AM
avg-cpu:  %user   %nice %system %iowait  %steal   %idle
           7.12    0.00    6.18    0.12    0.00   86.58

Device:            tps    kB_read/s    kB_wrtn/s    kB_read    kB_wrtn
sda             427.00      1696.00      2368.00       1696       2368
dm-0            424.00      1696.00      2364.00       1696       2364

04/18/2018 10:10:06 AM
avg-cpu:  %user   %nice %system %iowait  %steal   %idle
           5.27    0.00    8.10    0.19    0.00   86.44

Device:            tps    kB_read/s    kB_wrtn/s    kB_read    kB_wrtn
sda             322.00      1648.00      2576.00       1648       2576
dm-0            319.00      1648.00      2576.00       1648       2576

04/18/2018 10:10:07 AM
avg-cpu:  %user   %nice %system %iowait  %steal   %idle
           9.43    0.00    9.62    0.19    0.00   80.75

Device:            tps    kB_read/s    kB_wrtn/s    kB_read    kB_wrtn
sda             286.00      1504.00      2720.00       1504       2720
dm-0            283.00      1504.00      2720.00       1504       2720

04/18/2018 10:10:08 AM
avg-cpu:  %user   %nice %system %iowait  %steal   %idle
           4.02    0.00    7.73    0.00    0.00   88.25

Device:            tps    kB_read/s    kB_wrtn/s    kB_read    kB_wrtn
sda             164.00       672.00       936.00        672        936
dm-0            164.00       672.00       936.00        672        936

04/18/2018 10:10:09 AM
avg-cpu:  %user   %nice %system %iowait  %steal   %idle
          12.28    0.00    7.66    0.19    0.00   79.87

Device:            tps    kB_read/s    kB_wrtn/s    kB_read    kB_wrtn
sda             337.00      3152.00       964.00       3152        964
dm-0            337.00      3152.00       964.00       3152        964

04/18/2018 10:10:10 AM
avg-cpu:  %user   %nice %system %iowait  %steal   %idle
          10.57    0.00    5.10    0.37    0.00   83.97

Device:            tps    kB_read/s    kB_wrtn/s    kB_read    kB_wrtn
sda             549.00      3168.00      3712.00       3168       3712
dm-0            544.00      3168.00      3700.00       3168       3700

04/18/2018 10:10:11 AM
avg-cpu:  %user   %nice %system %iowait  %steal   %idle
           7.90    0.00    4.23    0.12    0.00   87.75

Device:            tps    kB_read/s    kB_wrtn/s    kB_read    kB_wrtn
sda             448.00      1504.00      1636.00       1504       1636
dm-0            448.00      1504.00      1636.00       1504       1636

04/18/2018 10:10:12 AM
avg-cpu:  %user   %nice %system %iowait  %steal   %idle
           6.75    0.00    3.34    0.19    0.00   89.72

Device:            tps    kB_read/s    kB_wrtn/s    kB_read    kB_wrtn
sda             570.00      1952.00      6576.00       1952       6576
dm-0            569.00      1952.00      6576.00       1952       6576

04/18/2018 10:10:13 AM
avg-cpu:  %user   %nice %system %iowait  %steal   %idle
           8.53    0.00    4.04    0.19    0.00   87.24

Device:            tps    kB_read/s    kB_wrtn/s    kB_read    kB_wrtn
sda             348.00      1936.00      1084.00       1936       1084
dm-0            348.00      1936.00      1084.00       1936       1084

04/18/2018 10:10:14 AM
avg-cpu:  %user   %nice %system %iowait  %steal   %idle
          11.30    0.00    3.40    0.37    0.00   84.93

Device:            tps    kB_read/s    kB_wrtn/s    kB_read    kB_wrtn
sda             445.00      2928.00      1664.00       2928       1664
dm-0            444.00      2928.00      1664.00       2928       1664

04/18/2018 10:10:15 AM
avg-cpu:  %user   %nice %system %iowait  %steal   %idle
          11.69    0.00    3.53    0.25    0.00   84.54

Device:            tps    kB_read/s    kB_wrtn/s    kB_read    kB_wrtn
sda             465.00      2464.00      3912.00       2464       3912
dm-0            461.00      2464.00      3912.00       2464       3912

04/18/2018 10:10:16 AM
avg-cpu:  %user   %nice %system %iowait  %steal   %idle
          11.07    0.00    3.69    0.37    0.00   84.87

Device:            tps    kB_read/s    kB_wrtn/s    kB_read    kB_wrtn
sda             672.00      3536.00      3320.00       3536       3320
dm-0            670.00      3536.00      3320.00       3536       3320

04/18/2018 10:10:17 AM
avg-cpu:  %user   %nice %system %iowait  %steal   %idle
          11.11    0.00    2.87    0.37    0.00   85.64

Device:            tps    kB_read/s    kB_wrtn/s    kB_read    kB_wrtn
sda             606.00      2432.00      2920.00       2432       2920
dm-0            605.00      2432.00      2920.00       2432       2920

04/18/2018 10:10:18 AM
avg-cpu:  %user   %nice %system %iowait  %steal   %idle
          10.94    0.00    3.31    0.31    0.00   85.43

Device:            tps    kB_read/s    kB_wrtn/s    kB_read    kB_wrtn
sda             649.00      3536.00      4020.00       3536       4020
dm-0            646.00      3536.00      4020.00       3536       4020

04/18/2018 10:10:19 AM
avg-cpu:  %user   %nice %system %iowait  %steal   %idle
          11.89    0.00    4.09    0.43    0.00   83.59

Device:            tps    kB_read/s    kB_wrtn/s    kB_read    kB_wrtn
sda             638.00      3936.00      2788.00       3936       2788
dm-0            638.00      3952.00      2788.00       3952       2788

04/18/2018 10:10:20 AM
avg-cpu:  %user   %nice %system %iowait  %steal   %idle
           7.99    0.00    4.28    0.25    0.00   87.48

Device:            tps    kB_read/s    kB_wrtn/s    kB_read    kB_wrtn
sda             685.00      3200.00      3284.00       3200       3284
dm-0            683.00      3184.00      3284.00       3184       3284

04/18/2018 10:10:21 AM
avg-cpu:  %user   %nice %system %iowait  %steal   %idle
          12.02    0.00    3.78    0.37    0.00   83.83

Device:            tps    kB_read/s    kB_wrtn/s    kB_read    kB_wrtn
sda             800.00      3616.00      5320.00       3616       5320
dm-0            796.00      3616.00      5320.00       3616       5320

04/18/2018 10:10:22 AM
avg-cpu:  %user   %nice %system %iowait  %steal   %idle
          13.39    0.00    4.17    0.44    0.00   82.00

Device:            tps    kB_read/s    kB_wrtn/s    kB_read    kB_wrtn
sda             839.00      4432.00      7412.00       4432       7412
dm-0            830.00      4432.00      7412.00       4432       7412

04/18/2018 10:10:23 AM
avg-cpu:  %user   %nice %system %iowait  %steal   %idle
          10.52    0.00    3.30    0.25    0.00   85.93

Device:            tps    kB_read/s    kB_wrtn/s    kB_read    kB_wrtn
sda             603.00      2384.00      5164.00       2384       5164
dm-0            596.00      2384.00      5152.00       2384       5152

04/18/2018 10:10:24 AM
avg-cpu:  %user   %nice %system %iowait  %steal   %idle
           6.24    0.00    2.33    0.25    0.00   91.17

Device:            tps    kB_read/s    kB_wrtn/s    kB_read    kB_wrtn
sda             496.00      2224.00      2816.00       2224       2816
dm-0            494.00      2224.00      2816.00       2224       2816

04/18/2018 10:10:25 AM
avg-cpu:  %user   %nice %system %iowait  %steal   %idle
           5.93    0.00    2.71    0.19    0.00   91.17

Device:            tps    kB_read/s    kB_wrtn/s    kB_read    kB_wrtn
sda             666.00      2016.00      6796.00       2016       6796
dm-0            658.00      2016.00      6796.00       2016       6796

04/18/2018 10:10:26 AM
avg-cpu:  %user   %nice %system %iowait  %steal   %idle
           7.44    0.00    3.34    0.13    0.00   89.09

Device:            tps    kB_read/s    kB_wrtn/s    kB_read    kB_wrtn
sda             542.00      2096.00      3144.00       2096       3144
dm-0            539.00      2096.00      3144.00       2096       3144

04/18/2018 10:10:27 AM
avg-cpu:  %user   %nice %system %iowait  %steal   %idle
           7.34    0.00    3.39    0.13    0.00   89.15

Device:            tps    kB_read/s    kB_wrtn/s    kB_read    kB_wrtn
sda             610.00      1232.00      6916.00       1232       6916
dm-0            602.00      1232.00      6916.00       1232       6916

04/18/2018 10:10:28 AM
avg-cpu:  %user   %nice %system %iowait  %steal   %idle
           8.14    0.00    3.88    0.25    0.00   87.73

Device:            tps    kB_read/s    kB_wrtn/s    kB_read    kB_wrtn
sda             641.00      1520.00      5424.00       1520       5424
dm-0            636.00      1520.00      5424.00       1520       5424

04/18/2018 10:10:29 AM
avg-cpu:  %user   %nice %system %iowait  %steal   %idle
           7.10    0.00    3.27    0.31    0.00   89.31

Device:            tps    kB_read/s    kB_wrtn/s    kB_read    kB_wrtn
sda             633.00      2368.00      6348.00       2368       6348
dm-0            625.00      2368.00      6348.00       2368       6348

04/18/2018 10:10:30 AM
avg-cpu:  %user   %nice %system %iowait  %steal   %idle
           6.90    0.00    3.83    0.13    0.00   89.15

Device:            tps    kB_read/s    kB_wrtn/s    kB_read    kB_wrtn
sda             445.00      1808.00      2476.00       1808       2476
dm-0            443.00      1808.00      2476.00       1808       2476

Since the RX buffer change there are no more dropped packets.

For the record, the irq for eno1 is balanced across CPUs, so I don't think it is the bottleneck here:

root@db1114:/srv/tmp# for i in `cat /proc/interrupts | grep eno1 | awk -F ":" '{print $1}'`; do cat /proc/irq/$i/smp_affinity_list; done
0,2,4,6,8,10,12,14
0,2,4,6,8,10,12,14
0,2,4,6,8,10,12,14
0,2,4,6,8,10,12,14
0,2,4,6,8,10,12,14

During the errors spike I have captured the CPU stats and it is interesting to see that some sys or usr CPU get totally overloaded some seconds before the errors show:
Errors on logtash appeared at 14:00:11
This is the ouput of mpstat -P ALL 1 (I have removed the CPUs that are acting normally for reading it easily)

02:00:05 PM  CPU    %usr   %nice    %sys %iowait    %irq   %soft  %steal  %guest  %gnice   %idle
02:00:06 PM    5    0.00    0.00   98.00    0.00    0.00    0.00    0.00    0.00    0.00    2.00

02:00:06 PM  CPU    %usr   %nice    %sys %iowait    %irq   %soft  %steal  %guest  %gnice   %idle
02:00:07 PM   15    0.00    0.00  100.00    0.00    0.00    0.00    0.00    0.00    0.00    0.00

02:00:06 PM  CPU    %usr   %nice    %sys %iowait    %irq   %soft  %steal  %guest  %gnice   %idle
02:00:08 PM   15    0.00    0.00  100.00    0.00    0.00    0.00    0.00    0.00    0.00    0.00

02:00:10 PM  CPU    %usr   %nice    %sys %iowait    %irq   %soft  %steal  %guest  %gnice   %idle
02:00:11 PM    3  100.00    0.00    0.00    0.00    0.00    0.00    0.00    0.00    0.00    0.00

02:00:11 PM  CPU    %usr   %nice    %sys %iowait    %irq   %soft  %steal  %guest  %gnice   %idle
02:00:12 PM    4   95.00    0.00    0.00    0.00    0.00    0.00    0.00    0.00    0.00    5.00

A normal execution looks like this for most of the time:

02:00:26 PM  CPU    %usr   %nice    %sys %iowait    %irq   %soft  %steal  %guest  %gnice   %idle
02:00:27 PM  all    9.99    0.00    2.73    0.31    0.00    1.67    0.00    0.00    0.00   85.30
02:00:27 PM    0   17.31    0.00    6.73    0.96    0.00   13.46    0.00    0.00    0.00   61.54
02:00:27 PM    1    3.54    0.00    0.88    0.88    0.00   10.62    0.00    0.00    0.00   84.07
02:00:27 PM    2   18.37    0.00    5.10    0.00    0.00    0.00    0.00    0.00    0.00   76.53
02:00:27 PM    3    0.00    0.00    0.00    0.00    0.00    0.99    0.00    0.00    0.00   99.01
02:00:27 PM    4   17.17    0.00    5.05    0.00    0.00    0.00    0.00    0.00    0.00   77.78
02:00:27 PM    5    0.00    0.00    0.00    0.00    0.00    0.00    0.00    0.00    0.00  100.00
02:00:27 PM    6   17.35    0.00    4.08    0.00    0.00    0.00    0.00    0.00    0.00   78.57
02:00:27 PM    7    0.99    0.00    0.00    0.00    0.00    0.00    0.00    0.00    0.00   99.01
02:00:27 PM    8   21.78    0.00    5.94    0.00    0.00    0.00    0.00    0.00    0.00   72.28
02:00:27 PM    9    0.00    0.00    0.99    0.00    0.00    0.00    0.00    0.00    0.00   99.01
02:00:27 PM   10   13.54    0.00    5.21    0.00    0.00    0.00    0.00    0.00    0.00   81.25
02:00:27 PM   11    1.00    0.00    0.00    0.00    0.00    0.00    0.00    0.00    0.00   99.00
02:00:27 PM   12   17.35    0.00    4.08    0.00    0.00    0.00    0.00    0.00    0.00   78.57
02:00:27 PM   13    0.99    0.00    0.00    0.00    0.00    0.00    0.00    0.00    0.00   99.01
02:00:27 PM   14   17.00    0.00    6.00    0.00    0.00    0.00    0.00    0.00    0.00   77.00
02:00:27 PM   15   12.12    0.00    2.02    0.00    0.00    0.00    0.00    0.00    0.00   85.86

And this is a second capture with another burst.
Errors showed up at 14:20:10

02:20:04 PM  CPU    %usr   %nice    %sys %iowait    %irq   %soft  %steal  %guest  %gnice   %idle
02:20:05 PM   11  100.00    0.00    0.00    0.00    0.00    0.00    0.00    0.00    0.00    0.00

02:20:05 PM  CPU    %usr   %nice    %sys %iowait    %irq   %soft  %steal  %guest  %gnice   %idle
02:20:06 PM    2    0.00    0.00  100.00    0.00    0.00    0.00    0.00    0.00    0.00    0.00

02:20:07 PM  CPU    %usr   %nice    %sys %iowait    %irq   %soft  %steal  %guest  %gnice   %idle
02:20:08 PM    0    0.00    0.00   99.00    0.00    0.00    1.00    0.00    0.00    0.00    0.00

02:20:08 PM  CPU    %usr   %nice    %sys %iowait    %irq   %soft  %steal  %guest  %gnice   %idle
02:20:09 PM   13   95.00    0.00    2.00    0.00    0.00    0.00    0.00    0.00    0.00    3.00

02:20:09 PM  CPU    %usr   %nice    %sys %iowait    %irq   %soft  %steal  %guest  %gnice   %idle
02:20:10 PM   13  100.00    0.00    0.00    0.00    0.00    0.00    0.00    0.00    0.00    0.00

02:20:10 PM  CPU    %usr   %nice    %sys %iowait    %irq   %soft  %steal  %guest  %gnice   %idle
02:20:11 PM    4  100.00    0.00    0.00    0.00    0.00    0.00    0.00    0.00    0.00    0.00
02:20:11 PM   13  100.00    0.00    0.00    0.00    0.00    0.00    0.00    0.00    0.00    0.00
02:20:12 PM   13  100.00    0.00    0.00    0.00    0.00    0.00    0.00    0.00    0.00    0.00

02:20:12 PM  CPU    %usr   %nice    %sys %iowait    %irq   %soft  %steal  %guest  %gnice   %idle
02:20:13 PM   13  100.00    0.00    0.00    0.00    0.00    0.00    0.00    0.00    0.00    0.00

02:20:13 PM  CPU    %usr   %nice    %sys %iowait    %irq   %soft  %steal  %guest  %gnice   %idle
02:20:14 PM   13   91.00    0.00    0.00    0.00    0.00    0.00    0.00    0.00    0.00    9.00

Whether this is the cause or the consequence of something else is still to be found.

Mentioned in SAL (#wikimedia-operations) [2018-04-18T14:34:59Z] <marostegui> Disable puppet on db1114 - T191996

At the time of the errors (14:30:10), this is what I saw running for a couple of seconds before the errors:

14:30:06

PID USER      PR  NI    VIRT    RES    SHR S  %CPU %MEM     TIME+ COMMAND
 9476 root       0 -20   29232  12300   3540 R  35.1  0.0   5:44.59 atop

14:30:09

PID USER      PR  NI    VIRT    RES    SHR S  %CPU %MEM     TIME+ COMMAND
 9476 root       0 -20   29232  12300   3540 R  99.3  0.0   5:47.60 atop

14:30:12

PID USER      PR  NI    VIRT    RES    SHR S  %CPU %MEM     TIME+ COMMAND
 9476 root       0 -20   31680  14672   3540 S   5.0  0.0   5:47.75 atop

This is how atop is running: /usr/bin/atop -a -R -w /var/log/atop/atop_20180418 600
600 is the interval it is generating the reports.

I have disabled it for now and see what happens.

That's some great investigation!

@ayounsi does that mean that the switch is the one not being able to cope with the bursts and not the server? See: T191996#4138424 (the servers under that switch have quite lots of drop packets, which seem to be increasing all the time).

When enabled, MAC pause frames are sent by the server to the switch when its RX buffer is almost full, to tell the switch to briefly stop sending traffic (and thus use the switch buffer).
The switch dropped packets counters are not incrementing (and were not when congestion-control/MAC pause was enabled neither).

Dropped packets (in reasonable measures) are not an issue. For example TCP will scale its window depending on congestion.

https://kb.juniper.net/InfoCenter/index?page=content&id=KB25942 that says it is 300 seconds, any chance that could be 600 for us? Which would explain the connection errors?

That KB article is only for devices acting like a server (sending MAC pause) in this case, routers, not the switch side.

No more drops or rxbds_empty after this buffer change.
However connection errors are still happening (a bit less than before) but still exactly every 10 minutes (to the second) //cc @ema
@ayounsi could this mean that it is the switch the one dropping packets now maybe? As the server iface looks stable?

Makes sens than increasing the RX buffer made the server cope better with inbound spikes of traffic.
Switch is still not dropping packets.
A tcpdump of the traffic during the spike could be useful to see better what is going on.

That's some great investigation!

@ayounsi does that mean that the switch is the one not being able to cope with the bursts and not the server? See: T191996#4138424 (the servers under that switch have quite lots of drop packets, which seem to be increasing all the time).

When enabled, MAC pause frames are sent by the server to the switch when its RX buffer is almost full, to tell the switch to briefly stop sending traffic (and thus use the switch buffer).
The switch dropped packets counters are not incrementing (and were not when congestion-control/MAC pause was enabled neither).

Ah right, so it was coming FROM the server TO the switch. Thanks for clarifying that!

Dropped packets (in reasonable measures) are not an issue. For example TCP will scale its window depending on congestion.

https://kb.juniper.net/InfoCenter/index?page=content&id=KB25942 that says it is 300 seconds, any chance that could be 600 for us? Which would explain the connection errors?

That KB article is only for devices acting like a server (sending MAC pause) in this case, routers, not the switch side.

Thanks for checking!

No more drops or rxbds_empty after this buffer change.
However connection errors are still happening (a bit less than before) but still exactly every 10 minutes (to the second) //cc @ema
@ayounsi could this mean that it is the switch the one dropping packets now maybe? As the server iface looks stable?

Makes sens than increasing the RX buffer made the server cope better with inbound spikes of traffic.
Switch is still not dropping packets.

Thanks for checking!

A tcpdump of the traffic during the spike could be useful to see better what is going on.

Already done and nothing relevant found T191996#4129117
Let's hold a bit as seems that killing atop has made some effect (T191996#4139494) no errors for the last 1.30h

So this is almost confirmed related to atop.
I killed it yesterday at around 14:30 and it was remained stopped till 00:00 (where it started automatically, I guess it restarts itself every day) and errors started at 00:00

root@db1114:~# ps aux | grep atop
root      7255  0.7  0.0  26256  9208 ?        S<Ls 00:00   2:20 /usr/bin/atop -a -R -w /var/log/atop/atop_20180419 600

screenshot-logstash.wikimedia.org-2018.04.19-07-29-33.png (194×1 px, 23 KB)

I am going to kill it again and revert the network changes and leave that for the whole day and see what happens.

Mentioned in SAL (#wikimedia-operations) [2018-04-19T05:33:24Z] <marostegui> Revert RX buffer changes on db1114 - T191996

RX buffers reverted

root@db1114:~# ethtool -g eno1
Ring parameters for eno1:
Pre-set maximums:
RX:		2047
RX Mini:	0
RX Jumbo:	0
TX:		511
Current hardware settings:
RX:		2047
RX Mini:	0
RX Jumbo:	0
TX:		511

root@db1114:~# ethtool -G eno1 rx 200
root@db1114:~# ethtool -g eno1
Ring parameters for eno1:
Pre-set maximums:
RX:		2047
RX Mini:	0
RX Jumbo:	0
TX:		511
Current hardware settings:
RX:		200
RX Mini:	0
RX Jumbo:	0
TX:		511

No more errors for the last 6 hours after killing atop.
Also no drops or connections errors running the RX original buffers after reverting them as can be seen in the previous comment.

I will give it a couple of more hours and will start atop again and see what happens.

For the record, the irq for eno1 is balanced across CPUs, so I don't think it is the bottleneck here:

root@db1114:/srv/tmp# for i in `cat /proc/interrupts | grep eno1 | awk -F ":" '{print $1}'`; do cat /proc/irq/$i/smp_affinity_list; done
0,2,4,6,8,10,12,14
0,2,4,6,8,10,12,14
0,2,4,6,8,10,12,14
0,2,4,6,8,10,12,14
0,2,4,6,8,10,12,14

Not that it's probably the issue here, but this probably isn't ideal. If you look at grep eno1 /proc/interrupts you can see all the interrupt counters always hit CPU#0. Also, half the cores listed above are virtual HT cores, not real hardware cores. On the plus side, apparently it did automatically confine itself to the even-numbered set (which is NUMA node 0 where the adapter is physically attached). A more-optimal setting at just the IRQ level, if you want to try manually, would be something like this for this very particular case (would be different on another hosts, possibly different after a reboot too):

IRQ#queue name in /proc/interruptssmp_affinity_list
58eno1-tx-00,2,4,6
59eno1-rx-10
60eno1-rx-22
61eno1-rx-34
62eno1-rx-46

We have a script already puppetized that does such things for cache/lvs nodes, but it needs some minor tweaks to support your particular tg3 ethernet card decently. We could do some readonly-mode experiments and figure out how to support its oddball way of mapping queues.

Thanks for taking a look @BBlack!
Yeah, when I was looking at the interrupts I saw all of them on the same core, which isn't ideal indeed as you said. But as it was exactly the same on the other slaves, I discarded it as a issue, and it was also not dropping packets any longer, so the investigation moved towards something else. Which is now pretty clear: atop !

I am going to do a couple of more tests and will open an specific task for atop on stretch.

Marostegui claimed this task.

So, as soon as I started atop, errors came back and packets dropped. So the culprit is clearly atop.
I am going to leave atop disabled on db1114 and consider the scope of this ticket resolved - going to open a general task to follow up with the rest of the team about atop and this version and potential fixes.

Mentioned in SAL (#wikimedia-operations) [2018-04-20T08:05:31Z] <marostegui@tin> Synchronized wmf-config/db-eqiad.php: Fully repool db1114 in API - T191996 (duration: 01m 16s)