Page MenuHomePhabricator

Investigate Gerrit troubles to reach the MariaDB database
Closed, ResolvedPublic

Description

From time to time, Gerrit is unable to access its database on m2-master.eqiad.wmnet. When establishing the connection, it apparently get lost unexpectedly. The connection attempt fails with:

Can not read response from server. Expected to read 4 bytes, read 0 bytes before connection was unexpectedly lost.

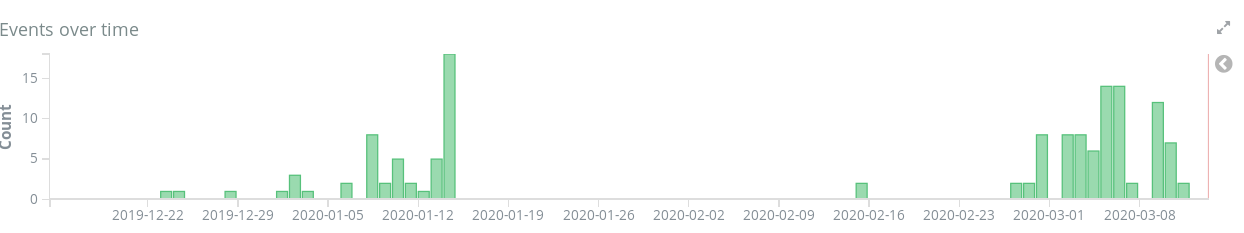
Logstash host:gerrit1001 AND "Cannot open ReviewDb" / https://logstash.wikimedia.org/goto/a5e73386bf3e1a2f0650577153e9d5d8

gerrit_cannot_open_reviewdb.png (233×1 px, 11 KB)

Gerrit parameters:

gerrit.config
[database]
    type = mysql
    hostname = m2-master.eqiad.wmnet
    database = reviewdb
    username = gerrit
    url = jdbc:mysql://m2-master.eqiad.wmnet/reviewdb?characterSetResults=utf8&characterEncoding=utf8&connectionCollation=utf8_unicode_ci

I am thus wondering whether there are indications of some failure on the database side since we do not have much details on Gerrit side :-\

A java trace showing the error occuring when opening a connection:

[2020-03-05 08:09:15,471] [SshCommandStart-2] WARN  com.google.gerrit.sshd.CommandFactoryProvider : Cannot start command "gerrit query --format json --all-approvals --comments --commit-message --current-patch-set --dependencies --files --patch-sets --submit-records change:577096" for user jenkins-bot
com.google.inject.ProvisionException: Unable to provision, see the following errors:

1) Cannot open ReviewDb
  at com.google.gerrit.server.util.ThreadLocalRequestContext$1.provideReviewDb(ThreadLocalRequestContext.java:69) (via modules: com.google.gerrit.server.config.GerritGlobalModule -> com.google.gerrit.server.util.ThreadLocalRequestContext$1)
  while locating com.google.gerrit.reviewdb.server.ReviewDb
    for the 1st parameter of com.google.gerrit.server.query.change.OutputStreamQuery.<init>(OutputStreamQuery.java:106)
  while locating com.google.gerrit.server.query.change.OutputStreamQuery
    for field at com.google.gerrit.sshd.commands.Query.processor(Query.java:27)
  while locating com.google.gerrit.sshd.commands.Query
  while locating org.apache.sshd.server.Command annotated with CommandName[gerrit query]

1 error
        at com.google.inject.internal.InternalProvisionException.toProvisionException(InternalProvisionException.java:226)
        at com.google.inject.internal.InjectorImpl$1.get(InjectorImpl.java:1053)
        at com.google.gerrit.sshd.DispatchCommand.start(DispatchCommand.java:95)
        at com.google.gerrit.sshd.DispatchCommand.start(DispatchCommand.java:122)
        at com.google.gerrit.sshd.CommandFactoryProvider$Trampoline.onStart(CommandFactoryProvider.java:208)
        at com.google.gerrit.sshd.CommandFactoryProvider$Trampoline.access$300(CommandFactoryProvider.java:111)
        at com.google.gerrit.sshd.CommandFactoryProvider$Trampoline$1.run(CommandFactoryProvider.java:167)
        at java.util.concurrent.Executors$RunnableAdapter.call(Executors.java:511)
        at java.util.concurrent.FutureTask.run(FutureTask.java:266)
        at java.util.concurrent.ScheduledThreadPoolExecutor$ScheduledFutureTask.access$201(ScheduledThreadPoolExecutor.java:180)
        at java.util.concurrent.ScheduledThreadPoolExecutor$ScheduledFutureTask.run(ScheduledThreadPoolExecutor.java:293)
        at com.google.gerrit.server.git.WorkQueue$Task.run(WorkQueue.java:558)
        at java.util.concurrent.ThreadPoolExecutor.runWorker(ThreadPoolExecutor.java:1149)
        at java.util.concurrent.ThreadPoolExecutor$Worker.run(ThreadPoolExecutor.java:624)
        at java.lang.Thread.run(Thread.java:748)
Caused by: com.google.gwtorm.server.OrmException: Cannot open database connection
        at com.google.gwtorm.jdbc.Database.newConnection(Database.java:130)
        at com.google.gwtorm.jdbc.JdbcSchema.<init>(JdbcSchema.java:43)
        at com.google.gerrit.reviewdb.server.ReviewDb_Schema_GwtOrm$$13.<init>(Unknown Source)
        at com.google.gerrit.reviewdb.server.ReviewDb_Schema_GwtOrm$$13_Factory_GwtOrm$$14.open(Unknown Source)
        at com.google.gwtorm.jdbc.Database.open(Database.java:122)
        at com.google.gerrit.server.schema.NotesMigrationSchemaFactory.open(NotesMigrationSchemaFactory.java:39)
        at com.google.gerrit.server.schema.NotesMigrationSchemaFactory.open(NotesMigrationSchemaFactory.java:25)
        at com.google.gerrit.server.config.RequestScopedReviewDbProvider.get(RequestScopedReviewDbProvider.java:46)
        at com.google.gerrit.server.config.RequestScopedReviewDbProvider.get(RequestScopedReviewDbProvider.java:27)
        at com.google.gerrit.server.util.ThreadLocalRequestContext$1.provideReviewDb(ThreadLocalRequestContext.java:69)
        at com.google.gerrit.server.util.ThreadLocalRequestContext$1$$FastClassByGuice$$75e0eb90.invoke(<generated>)
        at com.google.inject.internal.ProviderMethod$FastClassProviderMethod.doProvision(ProviderMethod.java:264)
        at com.google.inject.internal.ProviderMethod.doProvision(ProviderMethod.java:173)
        at com.google.inject.internal.InternalProviderInstanceBindingImpl$CyclicFactory.provision(InternalProviderInstanceBindingImpl.java:185)
        at com.google.inject.internal.InternalProviderInstanceBindingImpl$CyclicFactory.get(InternalProviderInstanceBindingImpl.java:162)
        at com.google.inject.internal.SingleParameterInjector.inject(SingleParameterInjector.java:42)
        at com.google.inject.internal.SingleParameterInjector.getAll(SingleParameterInjector.java:65)
        at com.google.inject.internal.ConstructorInjector.provision(ConstructorInjector.java:113)
        at com.google.inject.internal.ConstructorInjector.construct(ConstructorInjector.java:91)
        at com.google.inject.internal.ConstructorBindingImpl$Factory.get(ConstructorBindingImpl.java:306)
        at com.google.inject.internal.SingleFieldInjector.inject(SingleFieldInjector.java:52)
        at com.google.inject.internal.MembersInjectorImpl.injectMembers(MembersInjectorImpl.java:147)
        at com.google.inject.internal.ConstructorInjector.provision(ConstructorInjector.java:124)
        at com.google.inject.internal.ConstructorInjector.construct(ConstructorInjector.java:91)
        at com.google.inject.internal.ConstructorBindingImpl$Factory.get(ConstructorBindingImpl.java:306)
        at com.google.inject.internal.FactoryProxy.get(FactoryProxy.java:62)
        at com.google.inject.internal.InjectorImpl$1.get(InjectorImpl.java:1050)
        ... 13 more
Caused by: com.mysql.jdbc.exceptions.jdbc4.CommunicationsException: Communications link failure

The last packet successfully received from the server was 3,474 milliseconds ago.  The last packet sent successfully to the server was 0 milliseconds ago.
        at sun.reflect.GeneratedConstructorAccessor582.newInstance(Unknown Source)
        at sun.reflect.DelegatingConstructorAccessorImpl.newInstance(DelegatingConstructorAccessorImpl.java:45)
        at java.lang.reflect.Constructor.newInstance(Constructor.java:423)
        at com.mysql.jdbc.Util.handleNewInstance(Util.java:418)
        at com.mysql.jdbc.SQLError.createCommunicationsException(SQLError.java:989)
        at com.mysql.jdbc.MysqlIO.reuseAndReadPacket(MysqlIO.java:3559)
        at com.mysql.jdbc.MysqlIO.reuseAndReadPacket(MysqlIO.java:3459)
        at com.mysql.jdbc.MysqlIO.checkErrorPacket(MysqlIO.java:3900)
        at com.mysql.jdbc.MysqlIO.checkErrorPacket(MysqlIO.java:873)
        at com.mysql.jdbc.MysqlIO.proceedHandshakeWithPluggableAuthentication(MysqlIO.java:1710)
        at com.mysql.jdbc.MysqlIO.doHandshake(MysqlIO.java:1226)
        at com.mysql.jdbc.ConnectionImpl.coreConnect(ConnectionImpl.java:2194)
        at com.mysql.jdbc.ConnectionImpl.connectOneTryOnly(ConnectionImpl.java:2225)
        at com.mysql.jdbc.ConnectionImpl.createNewIO(ConnectionImpl.java:2024)
        at com.mysql.jdbc.ConnectionImpl.<init>(ConnectionImpl.java:779)
        at com.mysql.jdbc.JDBC4Connection.<init>(JDBC4Connection.java:47)
        at sun.reflect.GeneratedConstructorAccessor63.newInstance(Unknown Source)
        at sun.reflect.DelegatingConstructorAccessorImpl.newInstance(DelegatingConstructorAccessorImpl.java:45)
        at java.lang.reflect.Constructor.newInstance(Constructor.java:423)
        at com.mysql.jdbc.Util.handleNewInstance(Util.java:418)
        at com.mysql.jdbc.ConnectionImpl.getInstance(ConnectionImpl.java:389)
        at com.mysql.jdbc.NonRegisteringDriver.connect(NonRegisteringDriver.java:330)
        at com.google.gwtorm.jdbc.SimpleDataSource.getConnection(SimpleDataSource.java:104)
        at com.google.gwtorm.jdbc.Database.newConnection(Database.java:128)
        ... 39 more
Caused by: java.io.EOFException: Can not read response from server. Expected to read 4 bytes, read 0 bytes before connection was unexpectedly lost.
        at com.mysql.jdbc.MysqlIO.readFully(MysqlIO.java:3011)
        at com.mysql.jdbc.MysqlIO.reuseAndReadPacket(MysqlIO.java:3469)
        ... 57 more

Event Timeline

From time to time

Could you be more specific, at random times? When under high load? Which approximate frequency: Once every month, every week, every day?

I would bet (this is just a guess) it is not a network issue, but a misunderstanding between app and db of how long a connections should be open for (e.g. maybe gerrit tries to pool connections beyond the time that mysql likes to have it open for, if idle, or some other protocol issue.

Needs more research to say something concrete, but any pointer on how to get past occurences on log to match with what is mysql doing at that time, or a way to reproduce it manually, would make debugging easier.

Thanks for the extra info, I commented before you added the logstash link. Any way to reproduce it manually?

I could not find a way to reproduce it. From the log of events, that seems to be a transient issue, occurred early in january and again now. It started being noticeable for the last couple weeks as CI get stuck from time to time.

Maybe it is traffic related, Gerrit might be doing too many connections at the same time? We do not have much traces on the Gerrit side beside the java trace I pasted.

They all seem to be related to failing the connection:

...
        at com.mysql.jdbc.SQLError.createCommunicationsException(SQLError.java:989)
        at com.mysql.jdbc.MysqlIO.reuseAndReadPacket(MysqlIO.java:3459)
        at com.mysql.jdbc.MysqlIO.checkErrorPacket(MysqlIO.java:3900)
        at com.mysql.jdbc.MysqlIO.checkErrorPacket(MysqlIO.java:873)
        at com.mysql.jdbc.MysqlIO.proceedHandshakeWithPluggableAuthentication(MysqlIO.java:1710)
        at com.mysql.jdbc.MysqlIO.doHandshake(MysqlIO.java:1226)
        at com.mysql.jdbc.ConnectionImpl.coreConnect(ConnectionImpl.java:2194)
        at com.mysql.jdbc.ConnectionImpl.connectOneTryOnly(ConnectionImpl.java:2225)
        at com.mysql.jdbc.ConnectionImpl.createNewIO(ConnectionImpl.java:2024)
        at com.mysql.jdbc.ConnectionImpl.<init>(ConnectionImpl.java:779)
        at com.mysql.jdbc.JDBC4Connection.<init>(JDBC4Connection.java:47)
...

Maybe the MariaDB error logs might have some additional details?

The last ERROR actually happened during a period of low load on the database:
https://grafana.wikimedia.org/d/000000273/mysql?orgId=1&var-server=db1132&var-port=9104&var-dc=eqiad%20prometheus%2Fops&from=1583855885363&to=1583978307763

Same for a previous "spike".

Not close to max connection or other thing that would mean there is an overload, so my suspicions would be on some mismatch or issue keeping alive/not handling well idle connections.

@hashar Do you know if there is any configuration on refresh of connections/keep alive for the pool? At the moment, connections on m2-master (db1132) finish automatically, server side, after 3600 seconds being idle. Maybe those are kept open for longer if there is no activity?

m2-master is also scheduled for an upgrade next Thursday, you may want to have that in mind: T246098

doing too many connections at the same time

Not that, it is the first thing I checked, at least not from the perspective of the server (we have metrics of that, and it is not observed there). We have sometimes observed that under high contention on app servers, opening locally the socket to connect to mysql takes too much time if many happen per second, but I doubt gerrit has that kind of overload compared to a spike on a mw app server. For the point of view of mysql, there are no errors or high throughput that I could see- in fact, there is the least amount of load/new connections.

The other things that is interesting is the:

proceedHandshakeWithPluggableAuthentication

Could it be some kind of strange compatibility issue? MySQL 8 recently changed how authentication works, and that required a driver update. However, it should be backwards compatible if the driver updates, AND should fail always, not only at random. But worth investigating if the used driver has been updated recently.

Excellent @jcrespo thank you very much for the detailed answers!

I have no idea how Gerrit manages the database connections, the settings seem to be all default. Thus I don't know whether there is a keepalive or connection reuses. Will dig into that.

We also lack monitoring of JDBC connections on Gerrit side which is yet another rabbit hole to dig into.

So I guess for DBA side, there is not much more to look into. Thx!

Oh, wait, this will connect using the a dbproxy, so maybe the issue is there, not on mysql. Will give that a look.

I don't see immediate concerns about haproxy health, but I can see timeout is set as follows:

timeout connect 3000ms
timeout client  28800s
timeout server  28800s

Maybe the connection could have been aborted if it took more than 3 seconds, under certain conditions?

Excellent @jcrespo thank you very much for the detailed answers!

I have no idea how Gerrit manages the database connections, the settings seem to be all default. Thus I don't know whether there is a keepalive or connection reuses. Will dig into that.

We also lack monitoring of JDBC connections on Gerrit side which is yet another rabbit hole to dig into.

So I guess for DBA side, there is not much more to look into. Thx!

We use the java MySQL connector, so I think we should look there rather then Gerrit.

From Gerrit database configuration documentation ( https://gerrit.wikimedia.org/r/Documentation/config-gerrit.html#database )

database.connectionPool

If true, use connection pooling for database connections. Otherwise, a new database connection is opened for each request.

Default is false for MySQL, and true for other database backends.

We have database.type = mysql , though the connection url has jdbc:mysql://.... I am tempted to assume it is not using connection pooling. jdbc might have its own pooling but the trace seems to suggest it is establishing a new connection.

The messages have some timing as to when the packet was last send or received. They are usually under a couple miliseconds:

The last packet successfully received from the server was 1 milliseconds ago.
The last packet sent successfully to the server was 1 milliseconds ago.

I have found one with a higher timing:

The last packet successfully received from the server was 4,016 milliseconds ago.
The last packet sent successfully to the server was 0 milliseconds ago.

But it is still on a new jdbc connection and still with the same error message: Can not read response from server. Expected to read 4 bytes, read 0 bytes before connection was unexpectedly lost.

Jaime mentioned on IRC that might be TCP related.

I have looked at the Grafana board for gerrit1001. There are some TCP time_wait spikes and tcp/attemptfails, but they don't seem to correlate with the Gerrit connection errors.

That looks like a rabbit hole and I have no leads as to what could be the root cause (beside cosmic rays hitting the server).

@hashar - I recommend the following:

  • Wait for T246098, which may impact negatively or positively this
  • Later, try to get some stats regarding TCP for the gerrit host and the proxy, to see if there could be some slowdown there (there may be on prometheus already, but not show on grafana)

In the past, when the rate of errors was as low as this, it took us months until we discovered it was a third party program causing slowdowns on connections when running (T191996). I would bet on tcp waits on the proxy causing extra stalls/aborting connection.

I have looked at the Grafana board for gerrit1001. There are some TCP time_wait spikes and tcp/attemptfails, but they don't seem to correlate with the Gerrit connection errors.

It correlates, however, with a similar spike on the corresponding proxy: https://grafana.wikimedia.org/d/000000377/host-overview?orgId=1&from=1583912220700&to=1583930631516&var-server=dbproxy1015&var-datasource=eqiad%20prometheus%2Fops&var-cluster=mysql

It doesn't, however, with other occurrences. :-(

One rule SRE tries to follow is that if the error rate is lower than a given Software level agreement (e.g. 0.01% for a 99.99% SLA), it is not a priority. But I wonder if the impact is larger than that, based on the parent ticket?

@Paladox unlikely :] We need traces and try to find the root cause first!

Thanks for more hints Jaime. Indeed lets hold for the m2 upgrade.

We might also look into switching to connection pooling for Gerrit instead of reestablishing a new connections each time.

hashar changed the task status from Open to Stalled.Mar 13 2020, 5:55 PM
hashar triaged this task as Medium priority.

As Jaime pointed out, we have the upgrade in a few days, and if we keep observing this, we can also consider failing over the proxy itself to another host too.

I have checked logstash again, the issue has not occurred since March 11.

That mysteriously stopped even before the m2-master database got upgraded and hasn't occurred since. I guess that rules out the database.

Maybe there is was an overload somewhere, but it is unlikely we will figure it out any time soon :/

Thank you @jcrespo and @Marostegui for all the support!

I have checked logstash again, the issue has not occurred since March 11.

Checked again, we "just" had a spike of 26 errors between 2020-03-19T09:00:38 and 2020-03-19T09:01:26

Which match the database being restarted:

09:00 	<marostegui> 	Restart m2 primary database master - T246098

Beside that, the error hasn't occurred again since March 11th, so I guess the database had issue somehow and the upgrade definitely fixed it.

Thank you for the support dear DBA team!