Page MenuHomePhabricator

analyze and visualize the identifier landscape of Wikidata
Closed, ResolvedPublic

Description

Wikidata has over 3000 properties representing external identifiers. They link our concepts with concepts in other projects/databases/catalogs/... We'd like to better understand and visualize how we are connected to the rest of the world.

Some interesting questions to look into:

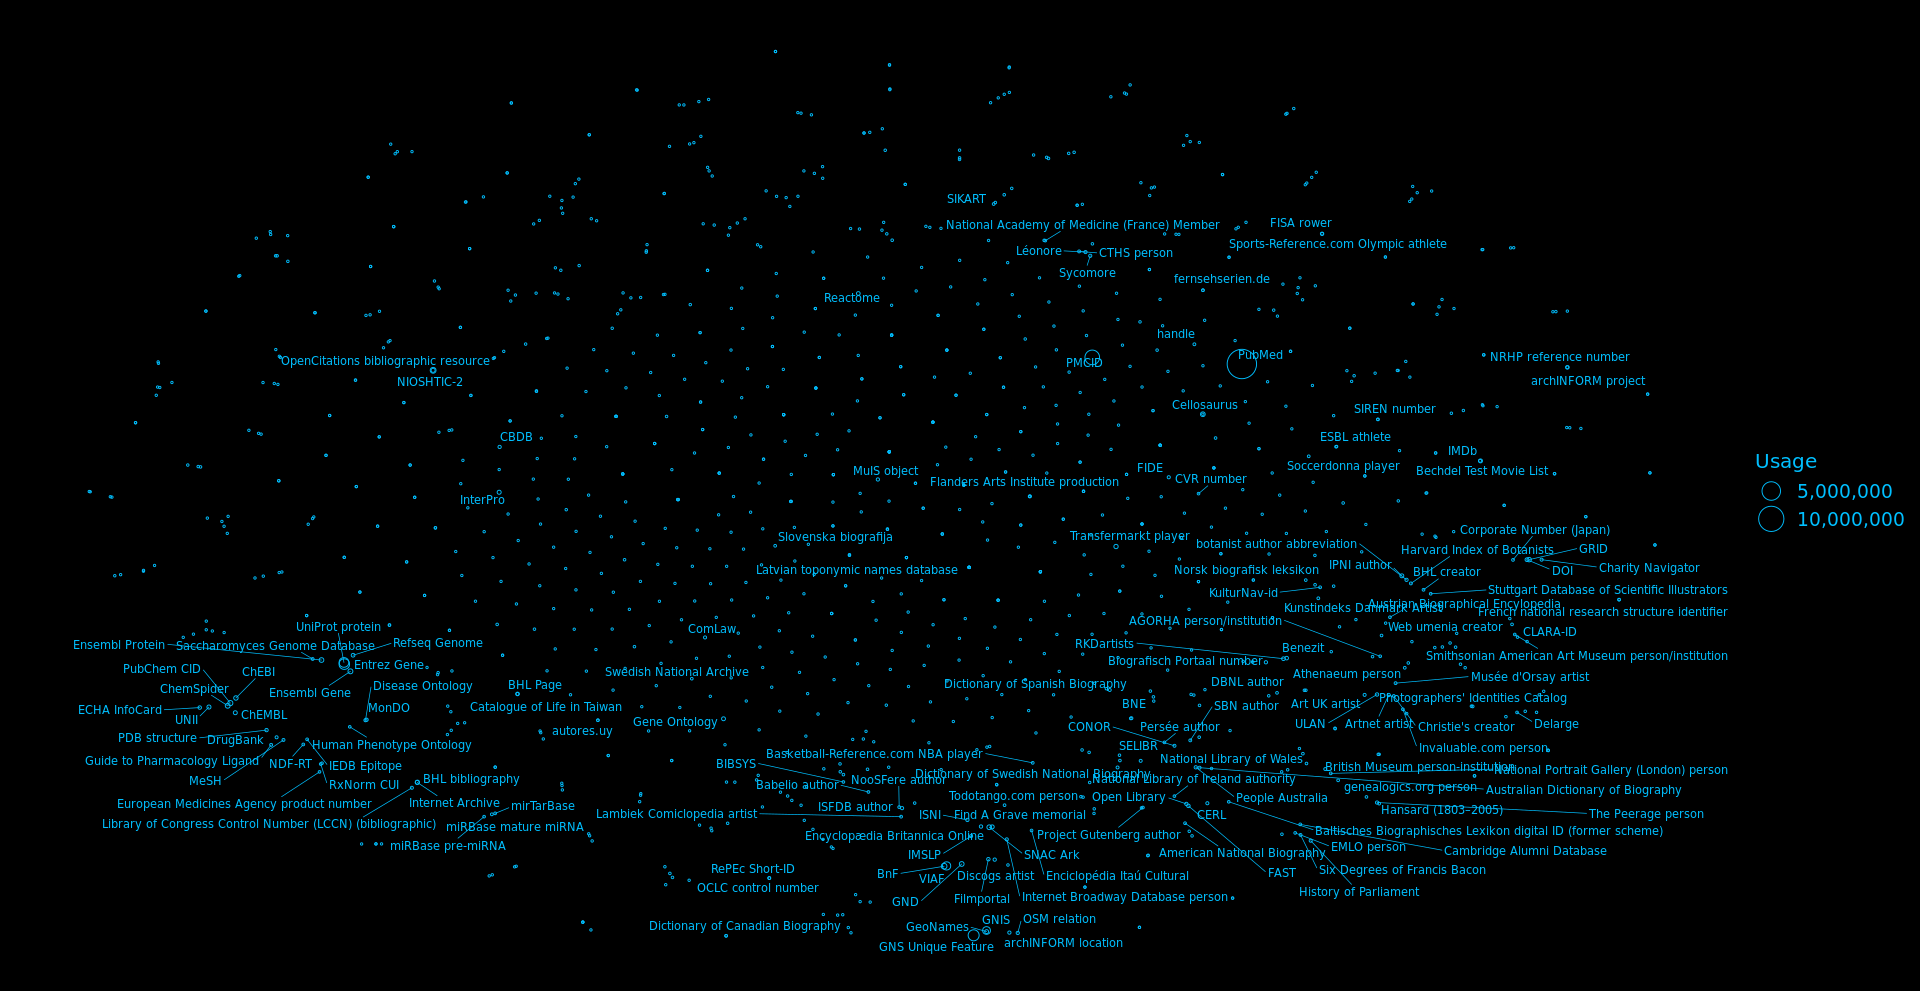
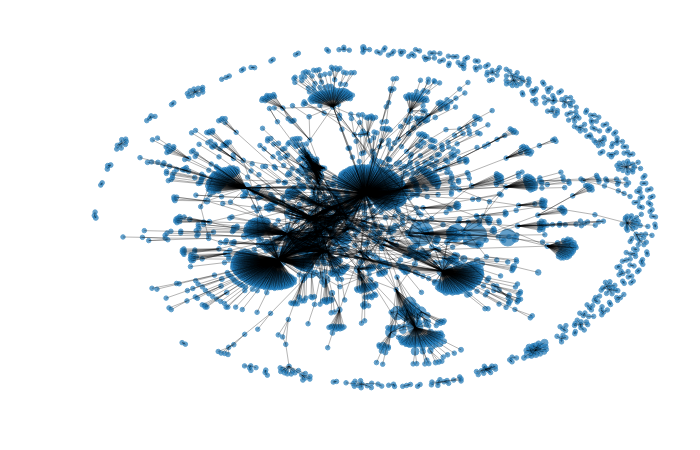
  • How much do our external identifiers overlap?
  • How many statements are there for them? How about combinations of external identifiers on the same item?
  • What topic areas do they represent?
  • What type of resource do they link to?

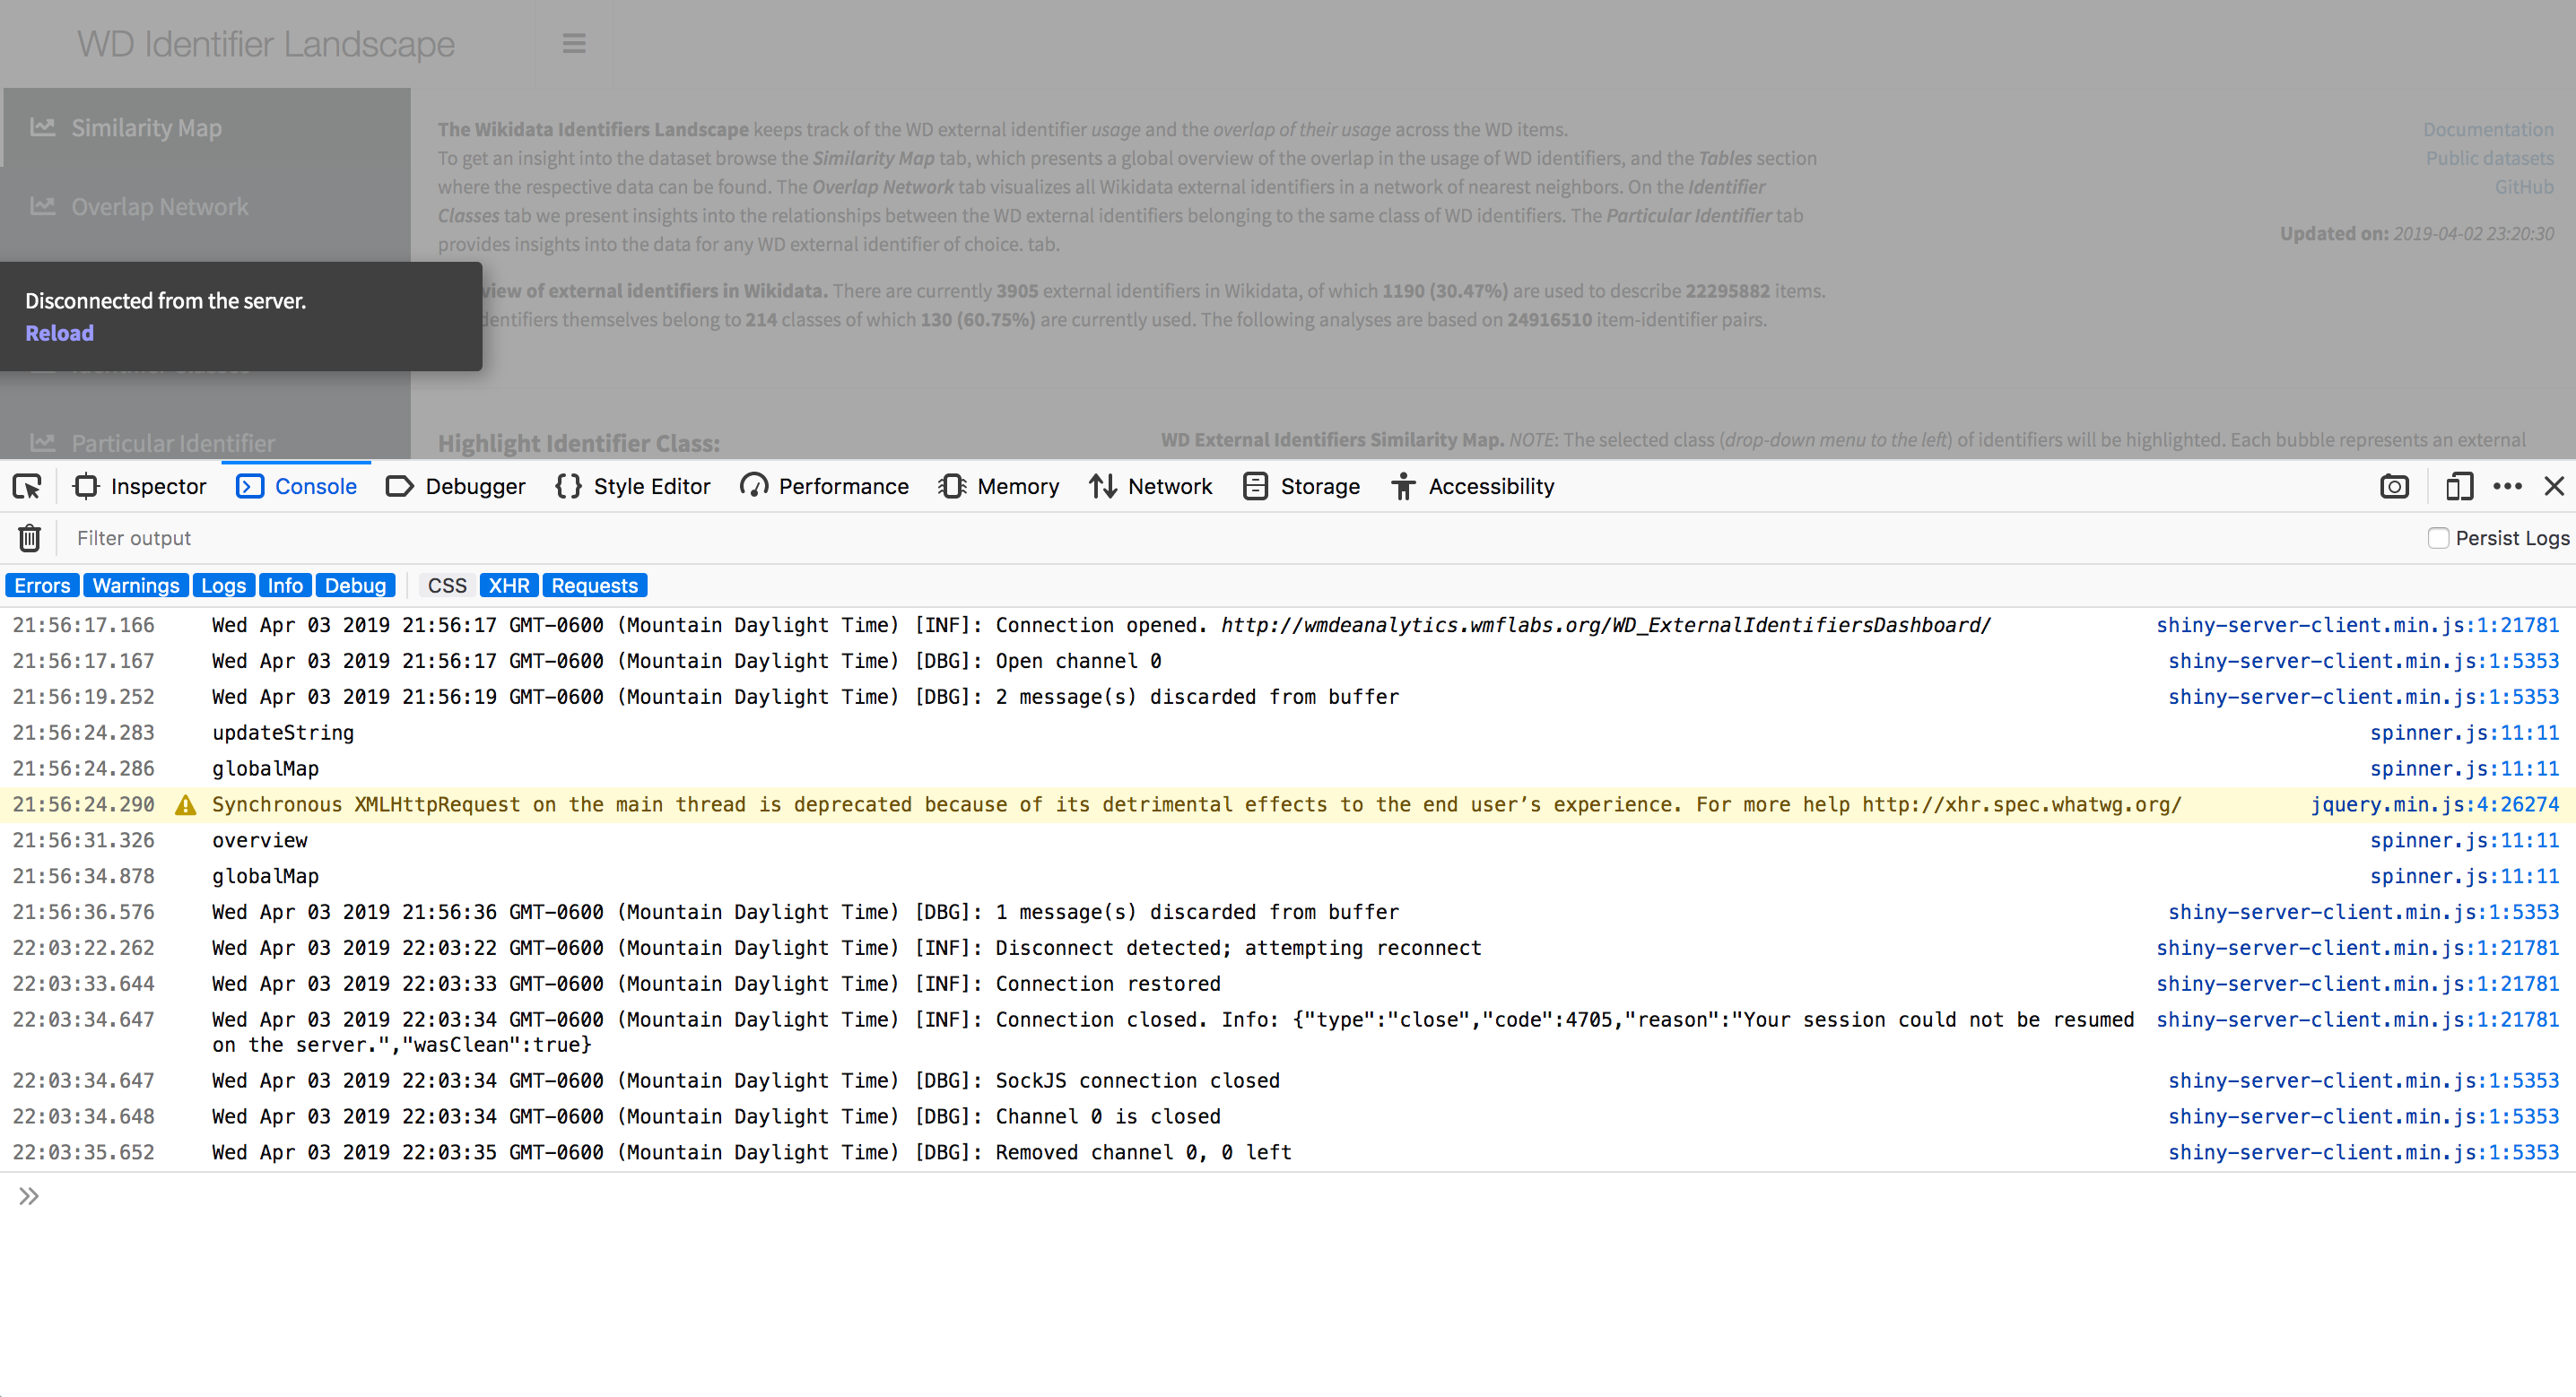
Something to take inspiration from:

Event Timeline

There are a very large number of changes, so older changes are hidden. Show Older Changes

@Lydia_Pintscher Something to begin with.

plot_zoom_png.png (991×1 px, 206 KB)

It will take some time before I have this thing sorted out perfectly - it's complicated.
I cannot exclude the possibility that I will have to re-open T214897 and re-engineer the data set.
But let's say we are on the right track with this.

@Lydia_Pintscher @RazShuty You can follow the development of the dashboard here.

Features will be added gradually and the dashboard should be fully completed by Friday, 29. March.

Great. Thank you! I'll have a closer look in the next days.

@Multichill Thank you for the examples, I will study them.

Would be nice to be visualize the overlap between properties and also the relation with other properties.

Go to the dashboard (note: beta, test only), the landing (Similarity Map) as well as the Overlap Network tab visualize the overlap between properties and map their relations.

  • Several bugs are fixed;
  • The Particular Identifier tab now runs a simple SPARQL query to fetch examples of the identifier's usage;
  • Working on documentation now.
  • The Particular Identifier tab now reports the number of statements for an identifier, as per request in the description.

@Lydia_Pintscher The identifier usage statistics are corrected and reported both

  • on the Similarity Map tab and
  • on the Particular Identifier tab.

FYI, I keep getting disconnected from the site for some reason.

Screen Shot 2019-04-03 at 10.05.19 PM.png (164×580 px, 15 KB)

Here are the console logs, if that helps at all:

Screen Shot 2019-04-03 at 10.06.04 PM.png (1×2 px, 702 KB)

My browser is Firefox Nightly 68.0a1 (2019-04-03) (64-bit), macOS 10.14.4

Also, when you go to the Particular Identifier tab and look at a property without enough data, there's a typo: "There is no enough data to compute the overlap graph for this identifier." Should be "not enough data".

I'm also kind of surprised by how much data is apparently needed, I was trying to check PCGamingWiki ID and it has 5600 uses, but that's not enough data for the tool to do anything with?

@connorshea Thanks for testing!

Disconnection issue

FYI, I keep getting disconnected from the site for some reason. My browser is Firefox Nightly 68.0a1 (2019-04-03) (64-bit), macOS 10.14.4

We use RStudio R {Shiny} package on the front-end. All our dashboards are already tested across a wide range of browsers and known to deliver successfully irrespective of the browser or the platform. The message that you are getting refers to a Shiny Server initiated disconnection that is expected in two situations (a) the user was idle for some time, and (b) there are was an automatically triggered server reboot that takes seconds only and is necessary from time to time (e.g. some dashboards' updates procedure trigger it). If any other cause is responsible for the disconnections - it's not on our side. Note that the Shiny Server Pro is more flexible in respect to managing situations in which a disconnection can occur, while we're using the open source Shiny Server (for obvious reasons).

Also, when you go to the Particular Identifier tab and look at a property without enough data, there's a typo: "There is no enough data to compute the overlap graph for this identifier." Should be "not enough data".

Thanks, will fix the typo now.

I'm also kind of surprised by how much data is apparently needed, I was trying to check PCGamingWiki ID and it has 5600 uses, but that's not enough data for the tool to do anything with?

Explain what do you mean by ... but that's not enough data for the tool to do anything with? (I've found that identifier of interest on the dashboard). Please first (a) read the dashboard documentation, and (b) learn from the documentation how to make a difference between (b1) identifier usage and (b2) overlap data to understand that having (b1) does not imply having (b2) necessarily.

  • Gerrit repo obtained, initial submit complete.
  • Next step: finalize Wikitech docs.

@Lydia_Pintscher I guess we can lower the priority of this ticket now?

This is nice! However, when visualizing properties by category, it seems that subclasses are not taken into account: only the properties bearing that exact category as P31 value are listed. This gives a pretty inaccurate view: it is crucial to respect this hierarchy, just like the prop-explorer tool does:
https://tools.wmflabs.org/prop-explorer/

For instance, when browsing the category Wikidata property to identify organisations, I want to see Corporate Number (Japan), because it is marked as a Wikidata property to identify organizations in company registers, which is a subclass.

I believe that might be the issue that confused @connorshea above: they might have looked for their property in a super-class of the classes explicitly declared on it.

@Pintoch Thank you! I think this should be fixed in line with your observation, and as soon as @Lydia_Pintscher and @RazShuty evaluate this proposal I will see to find some time to prioritize it.
Please take into your account that I work on many projects with WMDE and it is crucial for me to coordinate with Engineering and Product Managers on my priorities.

Hi, I just tested this new dashboard. The visualisations are great, but I'm more a number cruncher myself.

I've been to the "Tables" tab (gain great idea) but something seems a bit off with the numbers.
I tried for P380 (Mérimée id) which give right now these results:

archINFORM project ID (P5383)5
VIAF ID (P214)3
BnF ID (P268)1
DOI (P356)1
IMSLP ID (P839)1

But a simple query shows that the number of items sharing Mérimée id and VIAF id is much more higher (725 as of now, http://tinyurl.com/y55baqbd ).
Am I missing something here ?

@VIGNERON Our data rely on the pre-processed Wikidata JSON dump copy in Hadoop (see #T209655).
I will double check the dashboard, but the disagreement in numbers could be related to the fact that it does not reflect the latest updates in Wikidata.
Thank you for this observation!

@VIGNERON The latest processed dump in Hadoop has a timestamp of 20190204, so February 4th this year I would say.
Q. If you have followed the usage of P380 (Mérimée id), does it seem reasonable to you that the changes since Feb 4. 2019 could have produced a higher overlap with VIAF ID (P214) then what is observed on the dashboard?

No, most of these ID are present more than a year (maybe not all of them but clearly way more than the dashboard currently says).

Note that it's not just VIAF, other ID overlap with P380 seems off (P1529 for instance, I worked on this property back in 2014 so way before February 4th ;) ).

FYI, I also have very different results for P380 (even though it is data from the dump of 2019-04-08). If you follow the link "Usage history" on Property_talk:P380, you'll see that were no recent major change on the usage of this property.

I checked a few others properties (like P227), and it seems that a lot of data is missing.

@Envlh @VIGNERON Thank you very much for these observations of yours. I am on it.

Please get in touch here if you discover any similar disagreements on any other identifier(s). First, I need to figure out if P380 is - for any reason - a specific case on which my code failed. But if there are similar, huge disagreements in the data for other identifiers as well... then it's something systematic.

@Envlh I will also compare your and mine processing procedures. You observe this identifier (P380) on 48,202 items, my code finds 48,232 use cases, while I am using an older version of the dump. Of course, that is empirically possible, but I would normally expect an increase in the usage of an identifier with time.

This is nice! However, when visualizing properties by category, it seems that subclasses are not taken into account: only the properties bearing that exact category as P31 value are listed. This gives a pretty inaccurate view: it is crucial to respect this hierarchy, just like the prop-explorer tool does:
https://tools.wmflabs.org/prop-explorer/

For instance, when browsing the category Wikidata property to identify organisations, I want to see Corporate Number (Japan), because it is marked as a Wikidata property to identify organizations in company registers, which is a subclass.

I believe that might be the issue that confused @connorshea above: they might have looked for their property in a super-class of the classes explicitly declared on it.

Yeah let's do that.

@GoranSMilovanovic - I can confirm that the numbers on the tables seem a bit off for some other properties. I've been looking at P1614 (History of Parliament), which is complete and fairly stable. It currently has 21428 IDs on 17942 items (there's a lot of items with two/three IDs) and hasn't had any big changes since I finished matching in mid-2018.

The totals in the "usage data" column are pretty good. The dashboard has 17950, which is probably correct (I did some duplicate cleanup last month, so I'd expect the numbers to be a little different). But the "overlap data" column has the same sort of problems @Envlh and @VIGNERON report.

For VIAF (P214) the dashboard reports 440 items, against a SPARQL total of 2807. For Hansard ID (P2015), the dashboard has 110 and a SPARQL query has 2369. Most dramatically, for the Oxford DNB (P1415), the dashboard has two items and SPARQL has 3171. Both Hansard and Oxford IDs should be reasonably constant - there hasn't been any substantical activity around these identifiers for at least a year - so it shouldn't be linked to the dump timings.

Looking at P1415 specifically, since it's the weirdest one there, the "overlap data" for that property is even lower - the most frequent item is VIAF, but only 61 matches. In reality, this should be ~40,000 matches out of ~61,000 items. Perhaps some specific properties have worse data than others, for some reason?

The numbers in the overlap data table for P 1367 (Art UK Artist ID) are way off as well -- only one tenth of the VIAF and ULAN overlaps correctly reported, only one twentieth of the RKD Artist ID overlaps.

Compare https://en.wikipedia.org/wiki/Wikipedia:GLAM/Your_paintings#Stats for Listeria tables with accurate counts (which you can go back to look through the week-by-week updates for, if you are interested in what the numbers were in the past at a particular point in time).

Does this go any way to explain why the "Similarity Map" view seems so very wrong? I presume you're using something like a Jaccard similarity to score which identifiers should appear most closely together. It seems rather surprising that identifiers for people are not systematically clustered away from identifiers for places -- instead both seem more or less equally spread across the whole surface. This might indicate that either (i) the data is very incomplete (as seems to be the case); or (ii) some tweaks to the similarity function are required.

When you've got the data sorted, a table showing the closest identifiers by Jaccard similarity, rather than total overlap, might be quite interesting.

@Envlh I will also compare your and mine processing procedures. You observe this identifier (P380) on 48,202 items, my code finds 48,232 use cases, while I am using an older version of the dump. Of course, that is empirically possible, but I would normally expect an increase in the usage of an identifier with time.

@GoranSMilovanovic My tool checks overlaps only on properties used as statements, not when they are used as qualifiers or references. Maybe that can explain some discrepancy?

When you've got the data sorted, a table showing the closest identifiers by Jaccard similarity, rather than total overlap, might be quite interesting.

@Jheald It's available here: https://tools.dicare.org/properties/?type[]=ExternalId#jaccard_index
You can click on the name of a property to have its closest properties by Jaccard index. You can also reset the form at the top of the page to display all properties, not only external identifiers.

@Jheald

Does this go any way to explain why the "Similarity Map" view seems so very wrong?

Not necessarily. The map uses coordinates from the 2D tSNE dimensionality reduction which attempts to conserve the local similarity structures, and there are many, many constraints in this dataset that the algorithm needs to fit.
However: let's take a look at the map once the data are re-engineered.

I presume you're using something like a Jaccard similarity to score which identifiers ...

Of course I am using Jaccard, it's a dataset of binary vector representations of the identifiers.

@Envlh That's very nice. So for example, here are your comparison tables for
P 1367 (Art UK Artist ID): https://tools.dicare.org/properties/?property=1367&type[]=ExternalId
and for P 650 (RKDArtists ID): https://tools.dicare.org/properties/?property=650&type[]=ExternalId

The Jaccard measure seems to do a really nice job in identifying which identifiers seem to be the most similar, as a function of the items they get applied to.

@agray

I can confirm that the numbers on the tables seem a bit off for some other properties. I've been looking at P1614 (History of Parliament), which is complete and fairly stable. It currently has 21428 IDs on 17942 items (there's a lot of items with two/three IDs) and hasn't had any big changes since I finished matching in mid-2018.

  • For P1614 (History of Parliament), our dashboard reports: This identifier is used by 17950 WD items.
  • As of the following: "It currently has 21428 IDs on 17942 items (there's a lot of items with two/three IDs)" - the dashboard discards multiple uses of the same identifier on a same item. The data are "binarized": in our datasets, a particular item either makes use of the identifier, or not.

For VIAF (P214) the dashboard reports 440 items, against a SPARQL total of 2807.

  • For VIAF P214, the dashboard reports 1380767 items (tab: Tables, the table to the right, search for this identifier); are comparing the same data? What dashboard functionality have you used to find 440 items for P214 VIAF, please?

For Hansard ID (P2015), the dashboard has 110 and a SPARQL query has 2369.

  • For Hansard ID (P2015), the dashboard reports 14467 items, and overlap of 355 items with P214 VIAF ID. Are we looking at the same dashboard? :)

Most dramatically, for the Oxford DNB (P1415), the dashboard has two items and SPARQL has 3171.

  • For the Oxford DNB (P1415) the dashboard reports that 61143 items make use of it. Can you share your SPARQL queries, because I think we are discussing different datasets here.

Looking at P1415 specifically, since it's the weirdest one there, the "overlap data" for that property is even lower - the most frequent item is VIAF, but only 61 matches. In reality, this should be ~40,000 matches out of ~61,000 items. Perhaps some specific properties have worse data than others, for some reason?

  • I am inspecting the issue right now. The tests are difficult, they take time, but in the end we will have the correct overlap data for all identifiers. Again: we eliminate multiple uses of the same identifier on a same item in this dashboard, the only data that we are looking for are binary - an item does, or does not use a particular identifier.

Thank you very much for your comments. I will be reporting back on this ticket as the situation with the overlap data progresses.

@agray

For VIAF (P214) the dashboard reports 440 items, against a SPARQL total of 2807.

  • For VIAF P214, the dashboard reports 1380767 items (tab: Tables, the table to the right, search for this identifier); are comparing the same data? What dashboard functionality have you used to find 440 items for P214 VIAF, please?

For Hansard ID (P2015), the dashboard has 110 and a SPARQL query has 2369.

  • For Hansard ID (P2015), the dashboard reports 14467 items, and overlap of 355 items with P214 VIAF ID. Are we looking at the same dashboard? :)

Most dramatically, for the Oxford DNB (P1415), the dashboard has two items and SPARQL has 3171.

  • For the Oxford DNB (P1415) the dashboard reports that 61143 items make use of it. Can you share your SPARQL queries, because I think we are discussing different datasets here.

Sorry, I should have been clearer - my apologies! This was trying to demonstrate the partial overlaps.

The numbers I quoted are from the tables tab, looking at the left-hand "Overlap Data" column, when it's set to P1614 - ie for items with P1614, there are 440x P214 overlaps, 110x P2015 overlaps, and 2x P1415 overlaps. The live numbers for what I'd expect in terms of overlaps are at https://w.wiki/33B

I agree that the totals in the right-hand column ("Usage Data") seem broadly correct for all the properties I've looked at. (And thanks for clarifying how it handles duplicates - that's what I'd hoped for, but I wasn't sure.)

@agray Got it. Thank you. Still working on the overlap dataset.

  • Data engineering procedures code re-factored and in place;
  • testing now.
  • Data engineering test: success;
  • tSNE running now.

@Lydia_Pintscher @RazShuty

Overview/Status report for this task:

  1. The data engineering procedures in Apache Spark are re-factored;
    • we are using a much larger dataset now,
    • processing everything from statements, claims, and references
    • (note @Envlh your comment in T204440#5111313 was of crucial importance for me to figure what went wrong with the overlap data; I was accessing the JSON WD data model incorrectly in Spark; thank you);
  1. This change implies a different visualization approach in this dashboard:
    • the identifier graph needs to be pre-processed with MDS to produce a meaningful layout;
    • this and other computations over large datasets are now making the dashboard too heavy on the client-side (i.e. very slow to response), so
  1. I have informed @RazShuty in our 1:1 today that I will be:
    • moving all computations away from the dashboard to the back-end (stat1007, in this case);
    • the dashboard will then be downloading most of the outputs as already pre-processed and visualize only.

@Pintoch Your observation about the classes will be taken into account as soon as the above described "heavy" things are fixed. Thank you for your patience.

@agray @Envlh @Jheald @VIGNERON Thank you for testing and reporting on your findings. You can check the dashboard for data integrity now, but please take into your account the following:

  • everything from statements, claims and references is processed;
  • all cases of multiple use of a particular identifier in a particular item are discarded: in our dataset, the identifier is either used, or not used, with an item;
  • as described, the dashboard is currently very slow to respond, so you will have to be very patient if you want to test it now. I will decompose it today and send all the computations that were taking place in the front-end to one of our number crunchers. Following that operation (I report here as soon as it is completed) the dashboard should be light on the client-side and more responsive. Thank you.

@GoranSMilovanovic Overlap table for P 1367 (Art UK Artist ID) now showing about two-thirds of the overlap hits that it should be. (VIAF 6825, ULAN 6153, RKD 5582, ISNI 4240, Benezit 4643) vs true VIAF 11633, ULAN 10552, RKD 9769, ISNI 8237, Benezit 7529.

@Jheald Given that we discard all cases of multiple use of the same identifier with a particular item, does the number seem reasonable to you?

@GoranSMilovanovic thanks! Looking back at my tests for P.1614, these are the new numbers in the overlap data column (tables view, left hand column). They're a lot higher, but I think they're still incomplete.

  • P.1614/P.214 overlap - reported as 1654, should be ~2807
  • P.1614/P.2015 overlap - reported as 1194, should be ~2369
  • P.1614/P.1415 overlap - reported as 1650, should be ~3171 (SPARQL for all three)

Checking some random other pairs:

  • P.1802/P.213 overlap - reported as 3035, should be ~5707 (SPARQL)
  • P.2042/P.1816 overlap - reported as 532, should be ~1113 (SPARQL)
  • P.2040/P.5037 overlap - reported as 8393, should be ~11163 (SPARQL)
  • P.402/P.1566 overlap - reported as 31675, should be ~62623 (SPARQL)

The SPARQL for all of these *should* be ignoring multiple instances and only counting each item once, so I think this is still a real undercount. It's interesting that they're mostly around the same range (50-60%, one outlier at 75%).

@GoranSMilovanovic As per @agray : No -- my numbers were counting distinct items with the external IDs, rather than distinct statements, so should exactly match what you're aiming to compute.

@agray The SPARQL queries indeed select distinct items per property x property intersection... back to the drawing board: what is missing in my data?
I will have to dig deep to find out, the Pyspark ETL code for this dashboard is already looking into all statements, claims, and references. I fear it might be related to non-deterministic operations in Spark that could have affected the completeness of the datasets, but I've done everything to prevent such effects. I'm a bit puzzled, but I will find out the cause this or the other way. Thank you very much for testing.

Overview/Status Report:

  • the identifier graph needs to be pre-processed with MDS to produce a meaningful layout; - DONE
  • moving all heavy computations away from the dashboard to the back-end (stat1007, in this case); - DONE
  • the dashboard will then be downloading most of the outputs as already pre-processed and visualize only. - DONE

N.B. Not in production yet; testing locally.

  • (note @Envlh your comment in T204440#5111313 was of crucial importance for me to figure what went wrong with the overlap data; I was accessing the JSON WD data model incorrectly in Spark; thank you);

Glad my help was useful :) Thank you for your quick fix!

@Envlh It is not fixed yet. I am getting more data, but not all of it, see: T204440#5116460

  • Back-end re-factored; dashboard online, not all functionality complete:
    • the Overlap Network tab will have to wait until I figure out why we don't get all of the data from Spark;
    • there are some minor interventions that need take place in the visualizations code.
  • there are some minor interventions that need take place in the visualizations code. - DONE
  • Next steps:
    • revive the Overlap Network visualization;
    • check why 20 - 30% of data are not delivered from Spark; most probable cause: failures due to I/O operations.
  • revive the Overlap Network visualization - DONE
  • Next steps:
    • check why 20 - 30% of data are not delivered from Spark; most probable cause: failures due to I/O operations;
    • implement the suggestion by @Pintoch (see: T204440#5097057)

Update:

  • implement the suggestion by @Pintoch (see: T204440#5097057)
    • data structure: DONE
    • implementing changes in the WD external identifier class visualizations now;
  • Next:
    • check why 20 - 30% of data are not delivered from Spark; most probable cause: failures due to I/O operations;
  • Implementing changes in the WD external identifier class visualizations: DONE;
  • in relation to T204440#5097057, a compromise was introduced:
    • the WD identifier class network is generated to encompass all identifiers who belong to the class either by P31 or by P279 paths;
    • the table to the right of the network visualization will list only identifiers that belong to the class in a P31 sense.
  • Next:
    • check why 20 - 30% of data are not delivered from Spark; most probable cause: failures due to I/O operations;

@Lydia_Pintscher

  • Everything else takes place once the WD JSON dump copy to HDFS (T209655) is in production, and the Analytics-Engineering tell me that is going to take a while.
  • I think we should consider investing a bit more of my time here to optimize the dashboard (large datasets --> heavy on client-side processing). Please let me know what you think.

Status (final):

  • check why 20 - 30% of data are not delivered from Spark; most probable cause: failures due to I/O operations:
    • DONE (it was due to I/O failures when writing from Spark indeed)

Tests

@agray Replicating T204440#5112525 using your SPARQL query:

Tables tab, selected ID: P1614

  • Usage: dashboard reports 17946, your query: 17942;
  • Overlap with VIAF: dashboard reports 2787, your query: 2807;
  • Overlap with Hansard (1803–2005) ID (P2015): dashboard reports 2369, your query: 2369;
  • Overlap with ODNB P1415: dashboard reports 3171, your query: 3171.

Once again, please take into your consideration that we're still processing the February dump for the dashboard.

@Jheald Could you please check out the results for P1367 again, and let me know if everything is fine now? Thank you.

@VIGNERON

  • Mérimée id and VIAF id overlap: dashboard reports 640, SPARQL: 647;
  • usage of Mérimée id: it is used on 48128 items.

@Envlh Thanks once again; the moment you wrote

My tool checks overlaps only on properties used as statements, not when they are used as qualifiers or references...

in T204440#5111313, I've figured out where the things went wrong - besides facing I/O failures with Spark which is now fixed.

@GoranSMilovanovic oh hurrah - glad you've traced the problem! Those numbers for P1614 sound pretty much what I'd expect given it's data from February, so it looks like it's solved. Thanks for this, the dashboard looks like a really useful tool :-)

@Lydia_Pintscher

  • Everything else takes place once the WD JSON dump copy to HDFS (T209655) is in production, and the Analytics-Engineering tell me that is going to take a while.
  • I think we should consider investing a bit more of my time here to optimize the dashboard (large datasets --> heavy on client-side processing). Please let me know what you think.

Sounds good :)

  • The aesthetics are back:
    • {igraph} MDS layout deprecated in favor of
    • {igraph} Fruchterman-Reingold algorithm;
    • this solution is slower and I will try to optimize it as much as I can, but
    • the result is stunning.

newplot (1).png (450×700 px, 216 KB)

@Lydia_Pintscher

  • all computations that could have been moved to the back-end are now there;
  • the dashboard is not fully client-side dependent anymore (it wasn't realistic in the first place, mea culpa; too large datasets).

These actions have made the dashboard (a) load faster and (b) slightly increased its responsiveness.

Please, test the dashboard when you find some time. Thanks!

GoranSMilovanovic lowered the priority of this task from High to Low.Apr 23 2019, 7:56 PM

\o/
This looks great now. I think we can close the ticket now?