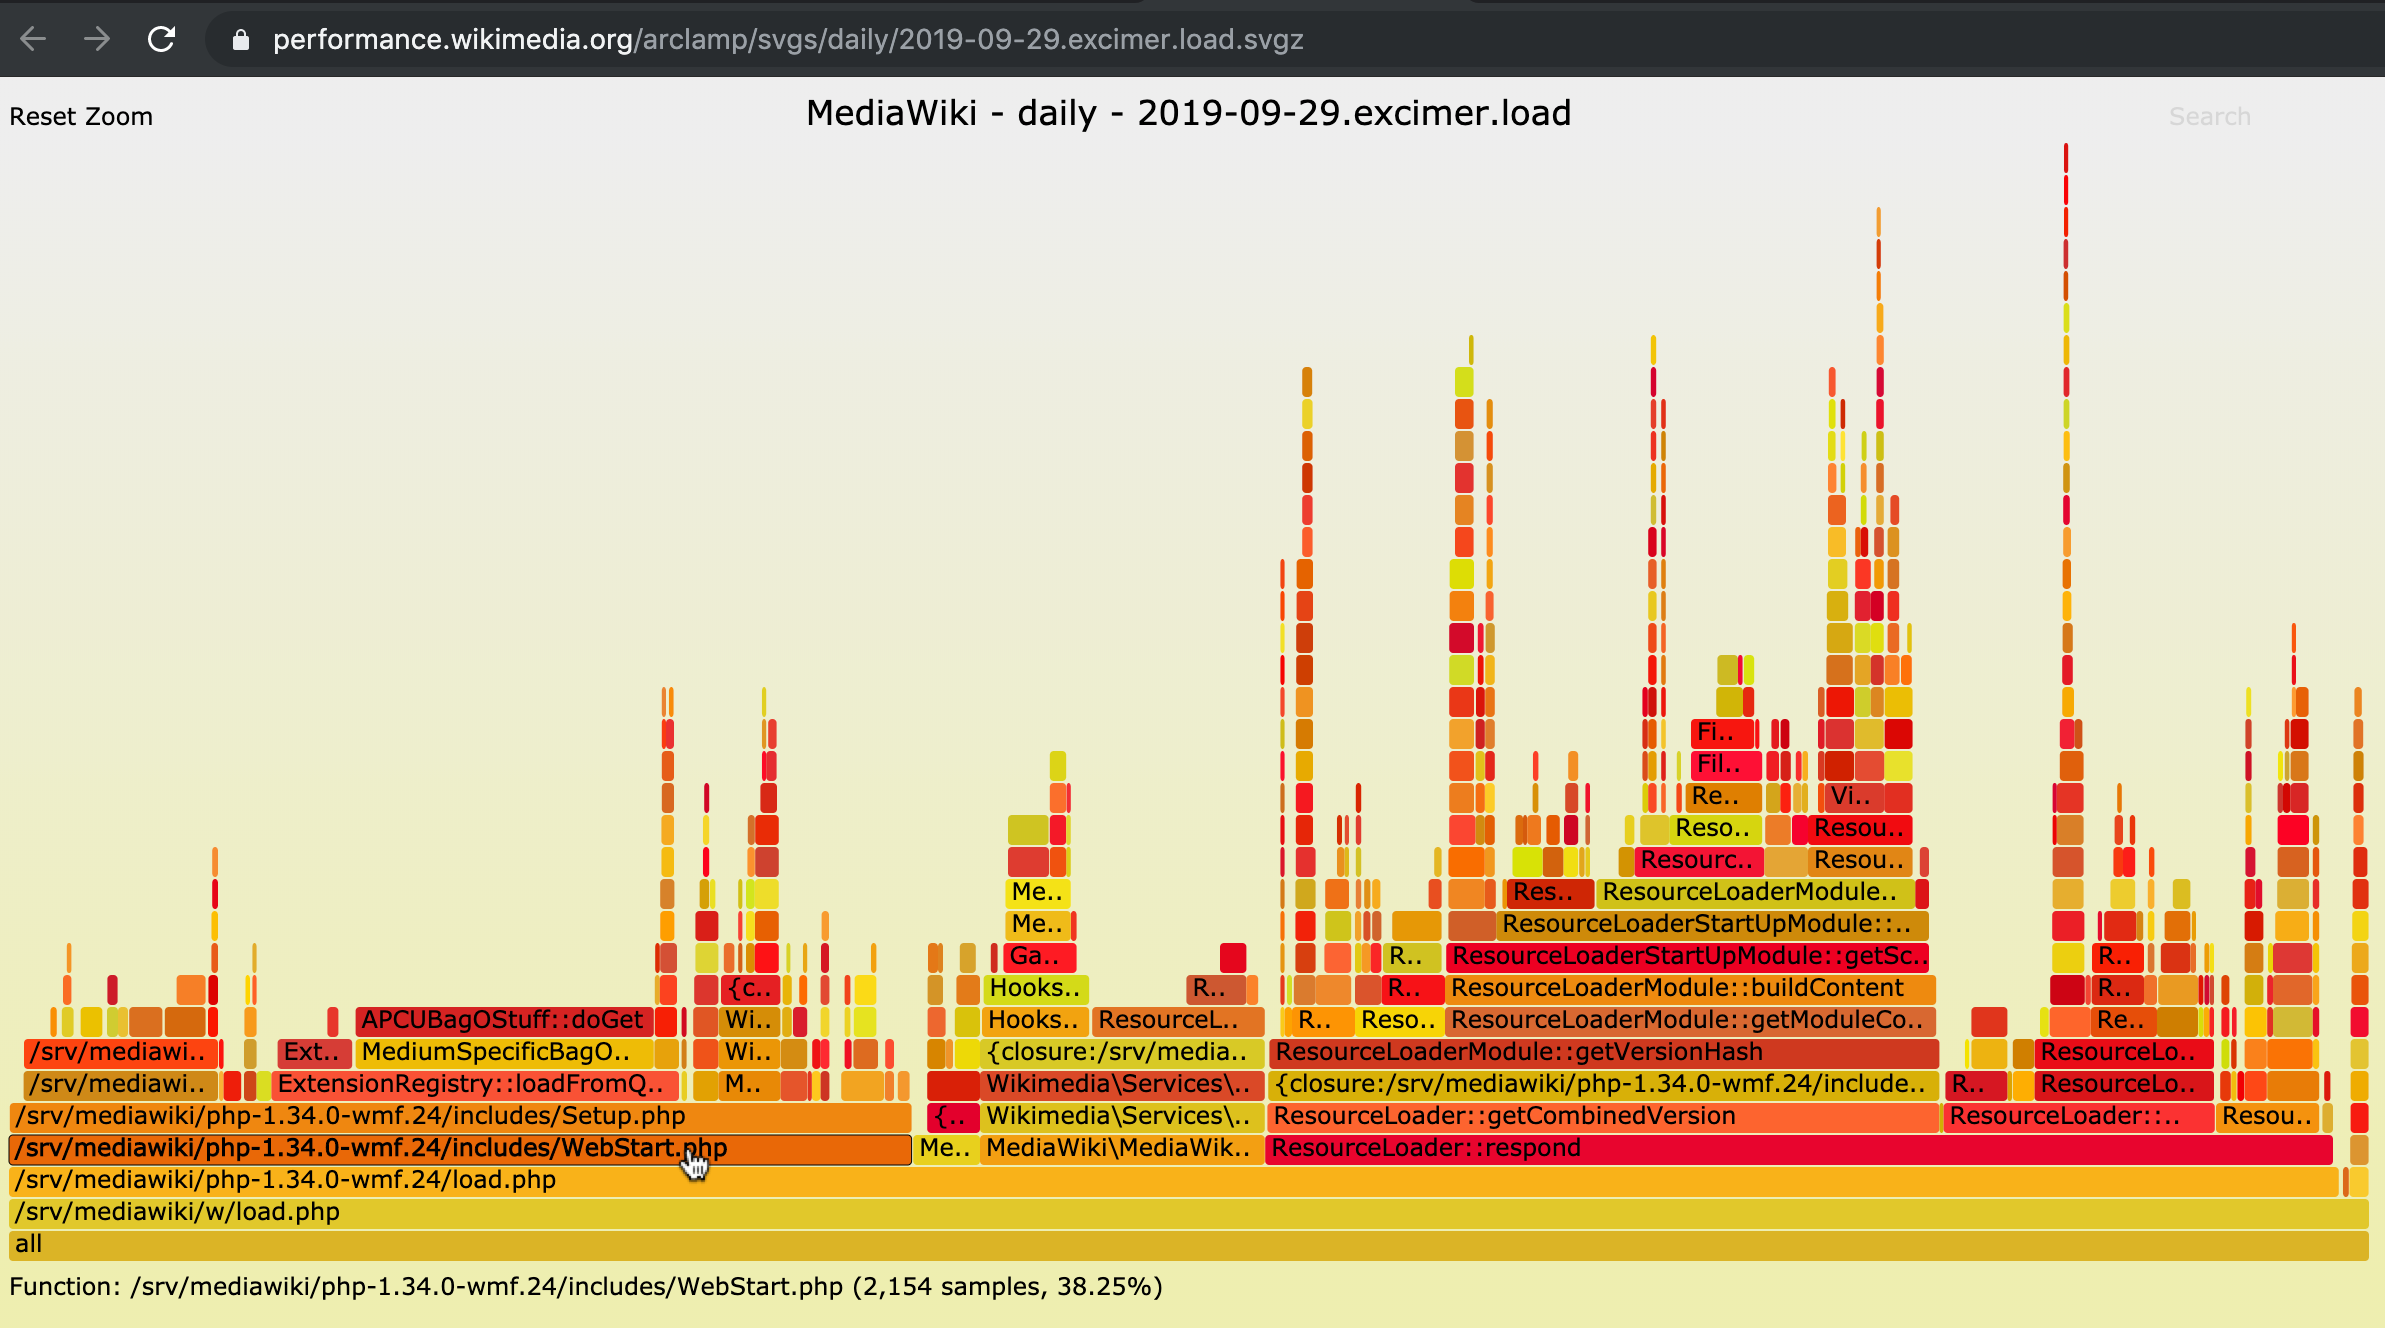
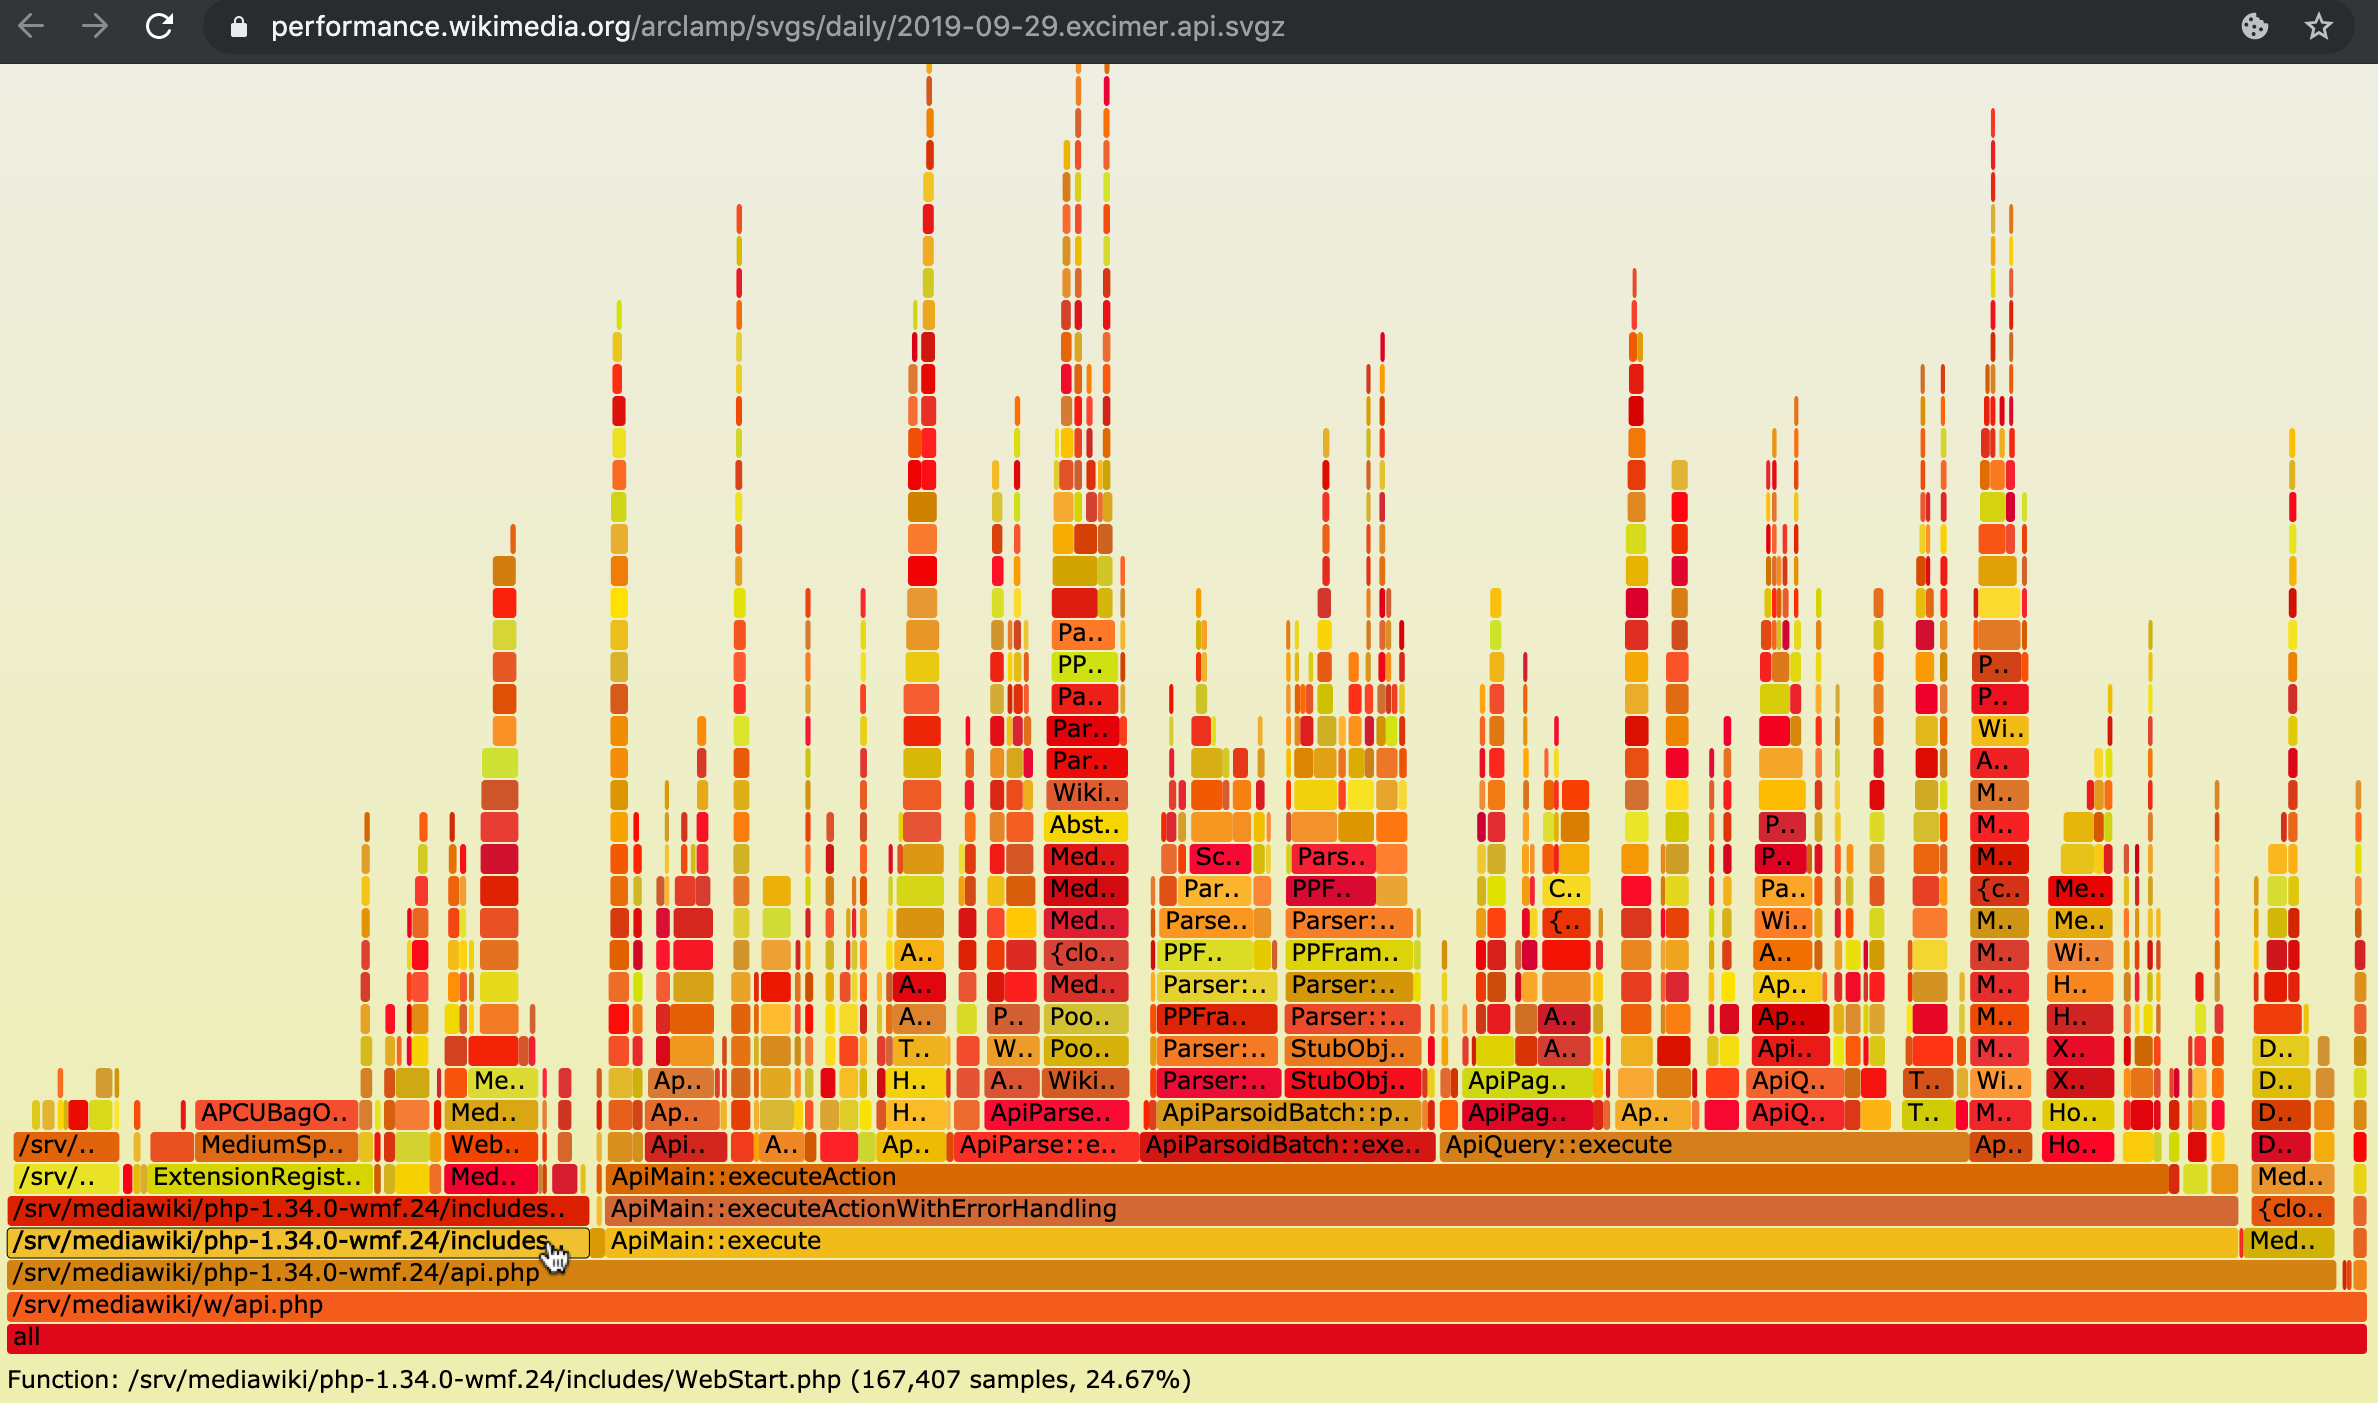
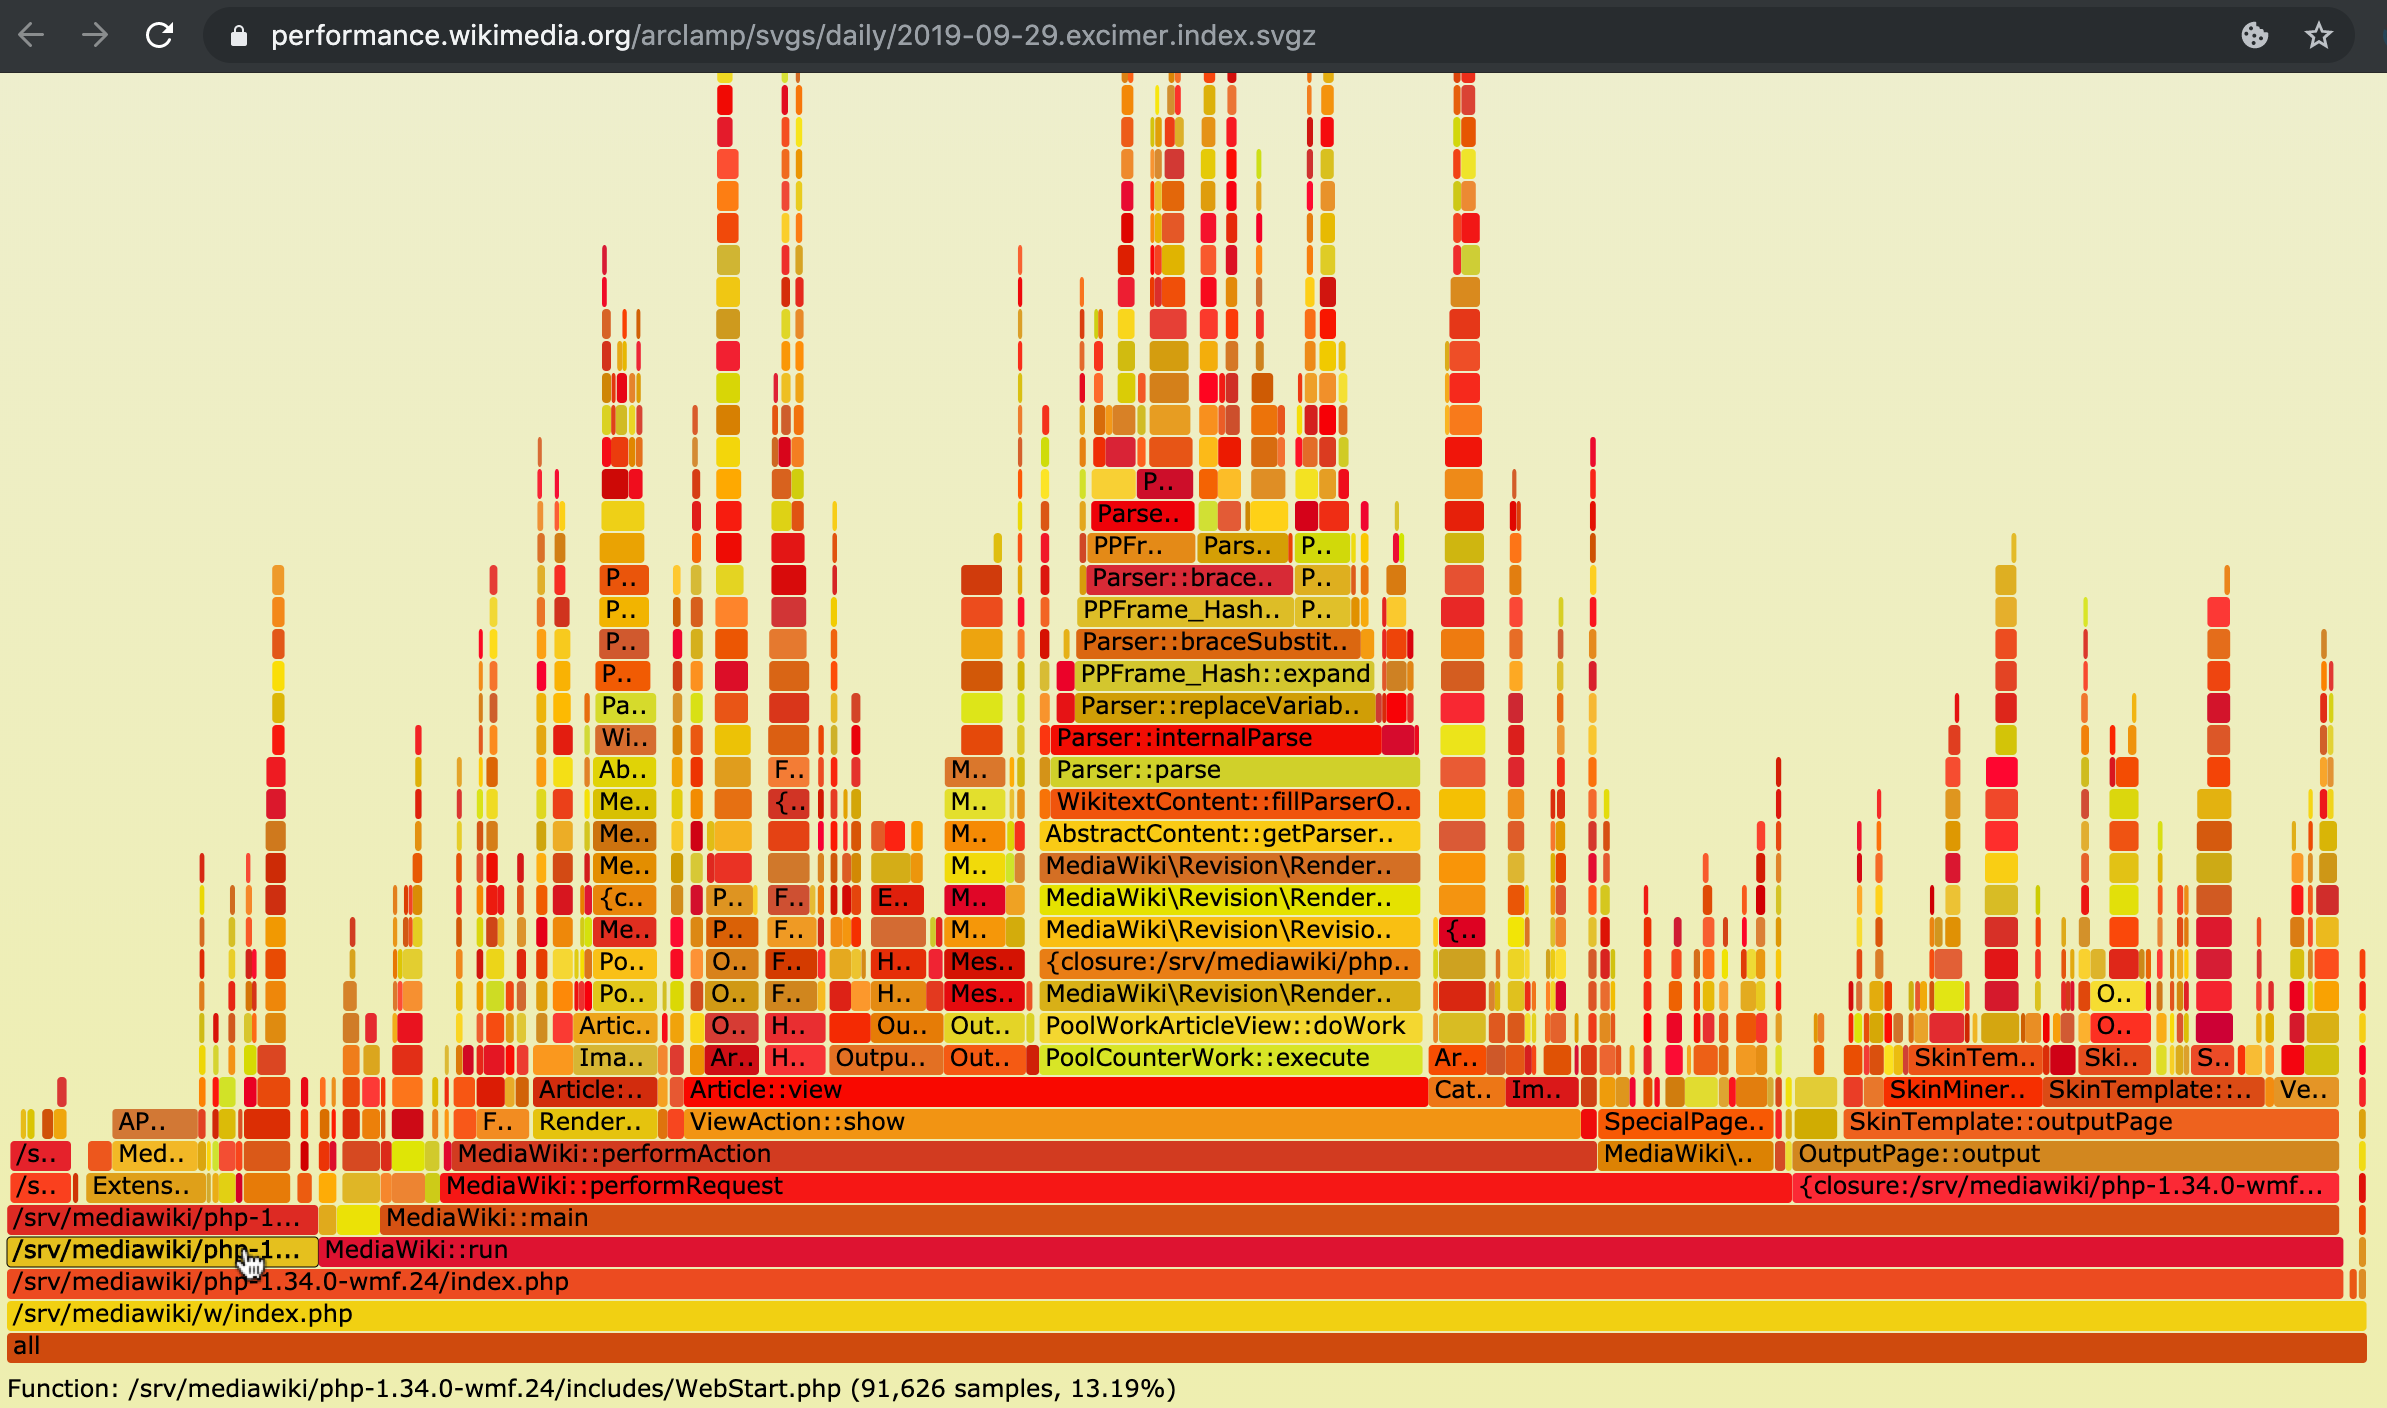
Gain visibility into how much time is spent on a typical request to get from "start of entry point file" to "end of WebStart/Setup.php".
This can be temporary and is to complete task T189966.
Some ideas:
- Broken down by entry point (e.g. focus on "index", "api" and "load").
- Broken down by: 1) entrypoint+Setup until LocalSetings, 2) LocalSettings (e.g. wmf-config), 3) Rest of Setup.
Given that we're fully on stacktrace-based profiling (both for debug and for sampling, Tideways/Excimer), we can't easily create fake spans of time measurements here.
Two approaches to consider:
- Ad-hoc microtime sent to StatsD from shutdown callback (would be coded in wmf-config + mutliversion).
- Or - leverage the stacktrace profiling by making sure the logical groups have a non-root stack frame, e.g. wrapped in a function call.
The latter would be easiest also long-term. The main hindering there is that LocalSettings must execute in the global scope (and emulating that is non-trivial, likely impossible in a way that would be performant and backward-compatible).
Perhaps a combination of the two.