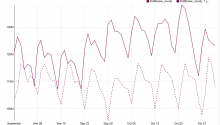
In September and October 2019, there was an increase in year-over-year pageviews (Sept 3.1% & Oct 4.9%). We'd like to look into possible reasons for this increase.
Description
Description
Related Objects
Related Objects
Event Timeline
Comment Actions
Here is a current summary of findings:
- Platform: there is a YoY increase in pageviews on mobile web (Sept 12.9% and Oct 12.3%), and the YoY decrease in pageviews on desktop is also diminishing compare to previous months (Sept -9.1% and Oct -4.4%).
- Project: The increase in pageviews was distributed across multiple Wikipedias, mainly form en.wikipedia and es.wikipedia.
- Country: the YoY increase are mainly from US for both two months.
- Referrers: There was a slightly YoY increase in external search engine (Sept 6% and Oct 2.6%) , and a larger increase in NONE referer class (Sept 6.5% and Oct 19.8%). Some further investigation regarding none referers:
- Tiktok updated with an integration of direct links to Wiki in later September, which is a direct referral source. But we didn't find any significant increase pageviews that look like brand related.
- By looking at ISP data from web request, lots of direct traffic from Google proxies. (likely Google weblight?).
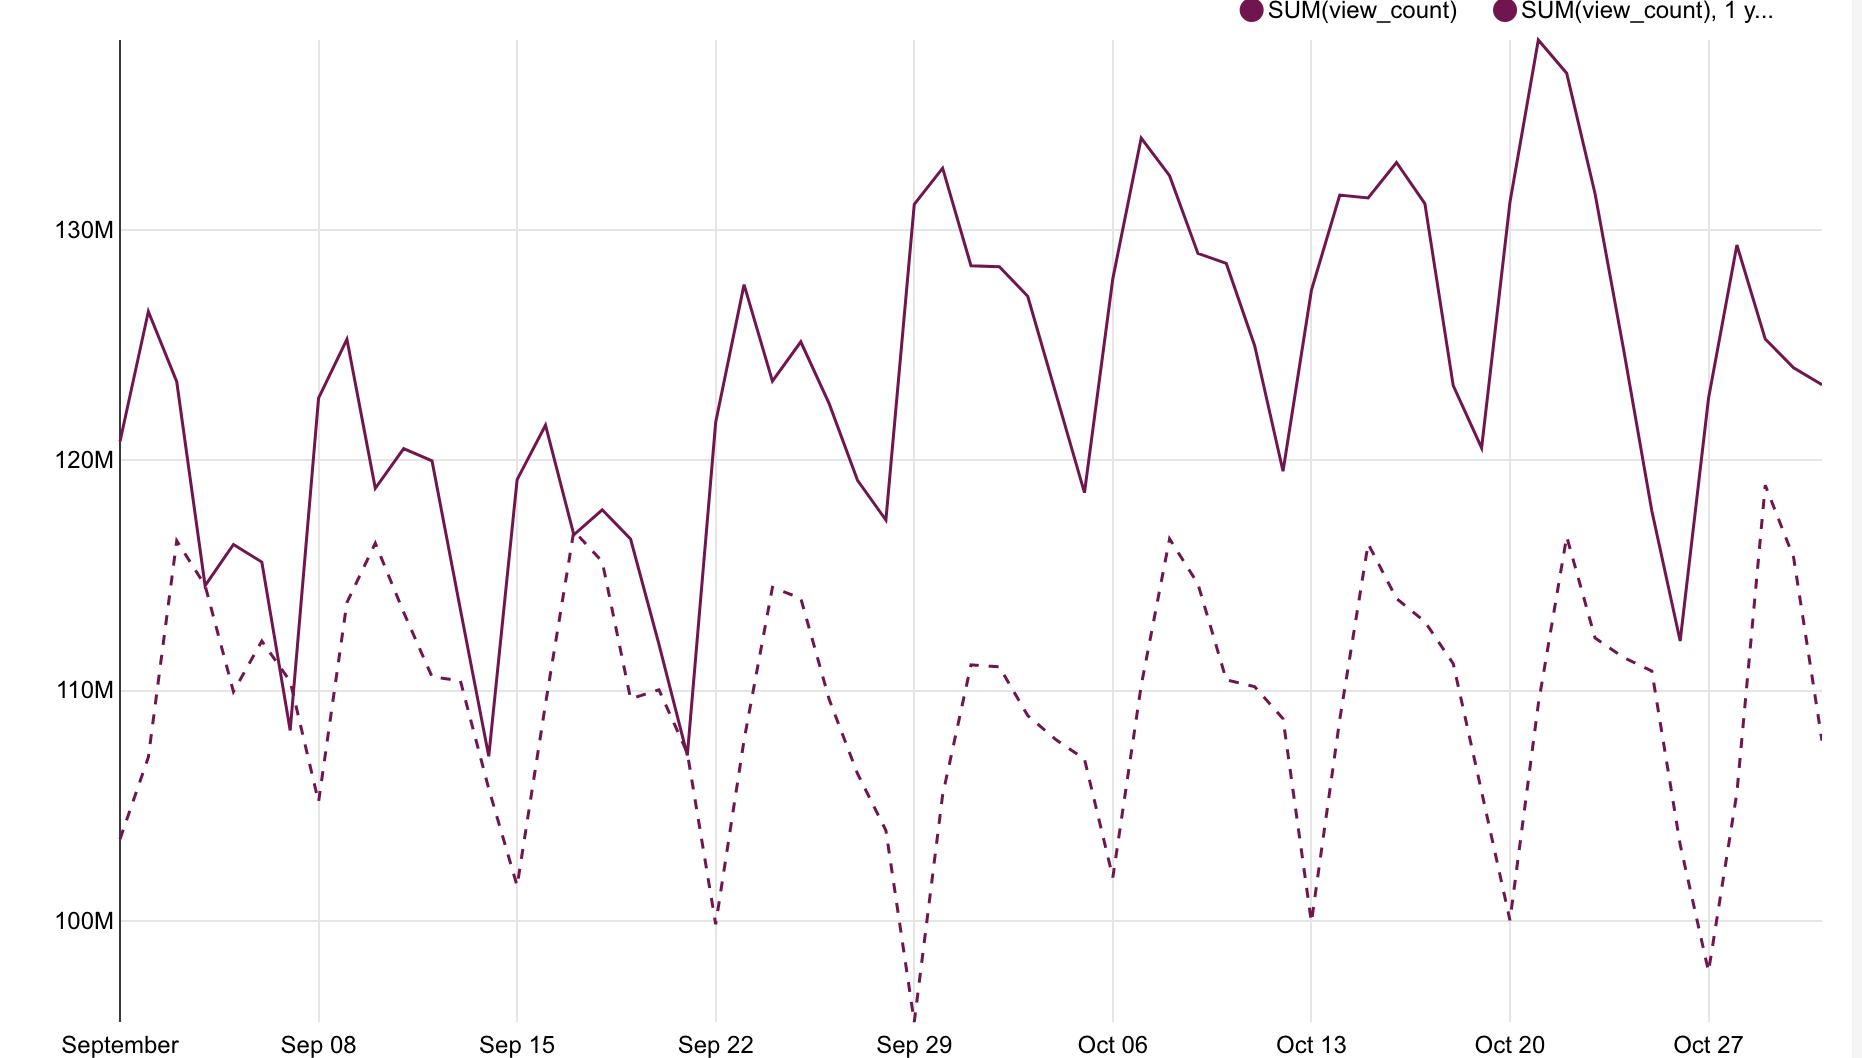
- As Nuria and Isaac mentioned in T195880#4429156, Chrome Mobile version 38 which is a Google Weblight Proxy in an older version of Android 4 is also a major culprit of YoY increase in no-referrer traffic.

- Some pages mostly viewed by direct traffic. e.g. in September, Solar_System with 1,121,740 pageviews and F5_Networks with 816,224 pageviews. in October, IPv4 with 2,317,561 pageviews and Petrodollar_recycling with 1,567,340 pageviews.
- Comparing refined data vs logs, not finding repeated counts.
Comment Actions
Tiktok updated with an integration of direct links to Wiki in later September, which is a direct referral source. But we didn't find any significant increase pageviews that look like brand related.
I also looked into this but couldn't find any videos yet that have linked to Wikipedia. I'm really curious to follow this though so if you find any examples, please let me know!
Some pages mostly viewed by direct traffic. e.g. in September, Solar_System with 1,121,740 pageviews and F5_Networks with 816,224 pageviews. in October, IPv4 with 2,317,561 pageviews and Petrodollar_recycling with 1,567,340 pageviews.
I've been curious about this spike as well and based on this it definitely looks like it's undetected bots. Most of these are consistent with bot traffic -- e.g., more evidence of spikes here that do not look at all human as with the Joker movie: https://tools.wmflabs.org/pageviews/?project=en.wikipedia.org&platform=all-access&agent=user&start=2019-09-01&end=2019-11-01&pages=IPv4|Simple_Mail_Transfer_Protocol|Solar_System|Petrodollar_recycling|Joker_(2019_film)|F5_Networks
At first the F5 Networks looked like it could be legitimate though as they evidently opened a fancy new tower and their daily traffic follows the usual weekly ebb/flow. Taking a glance at user agents though, they seem to fit this pattern here and here, though I don't know what to make of that.
Comment Actions
https://superset.wikimedia.org/r/1031
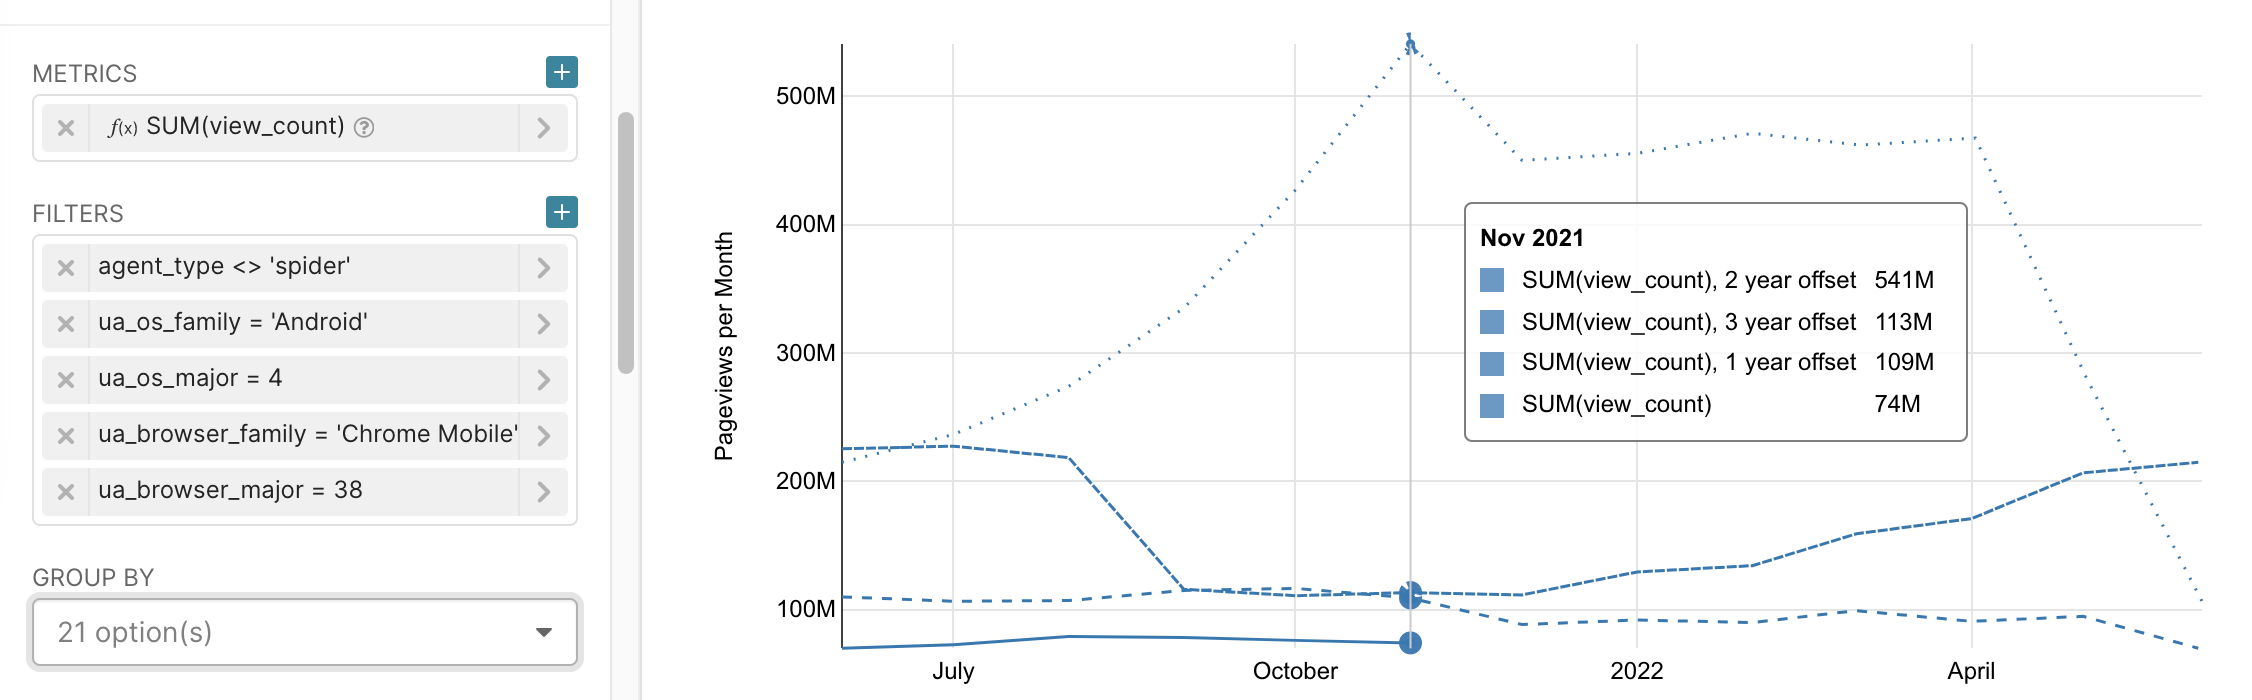
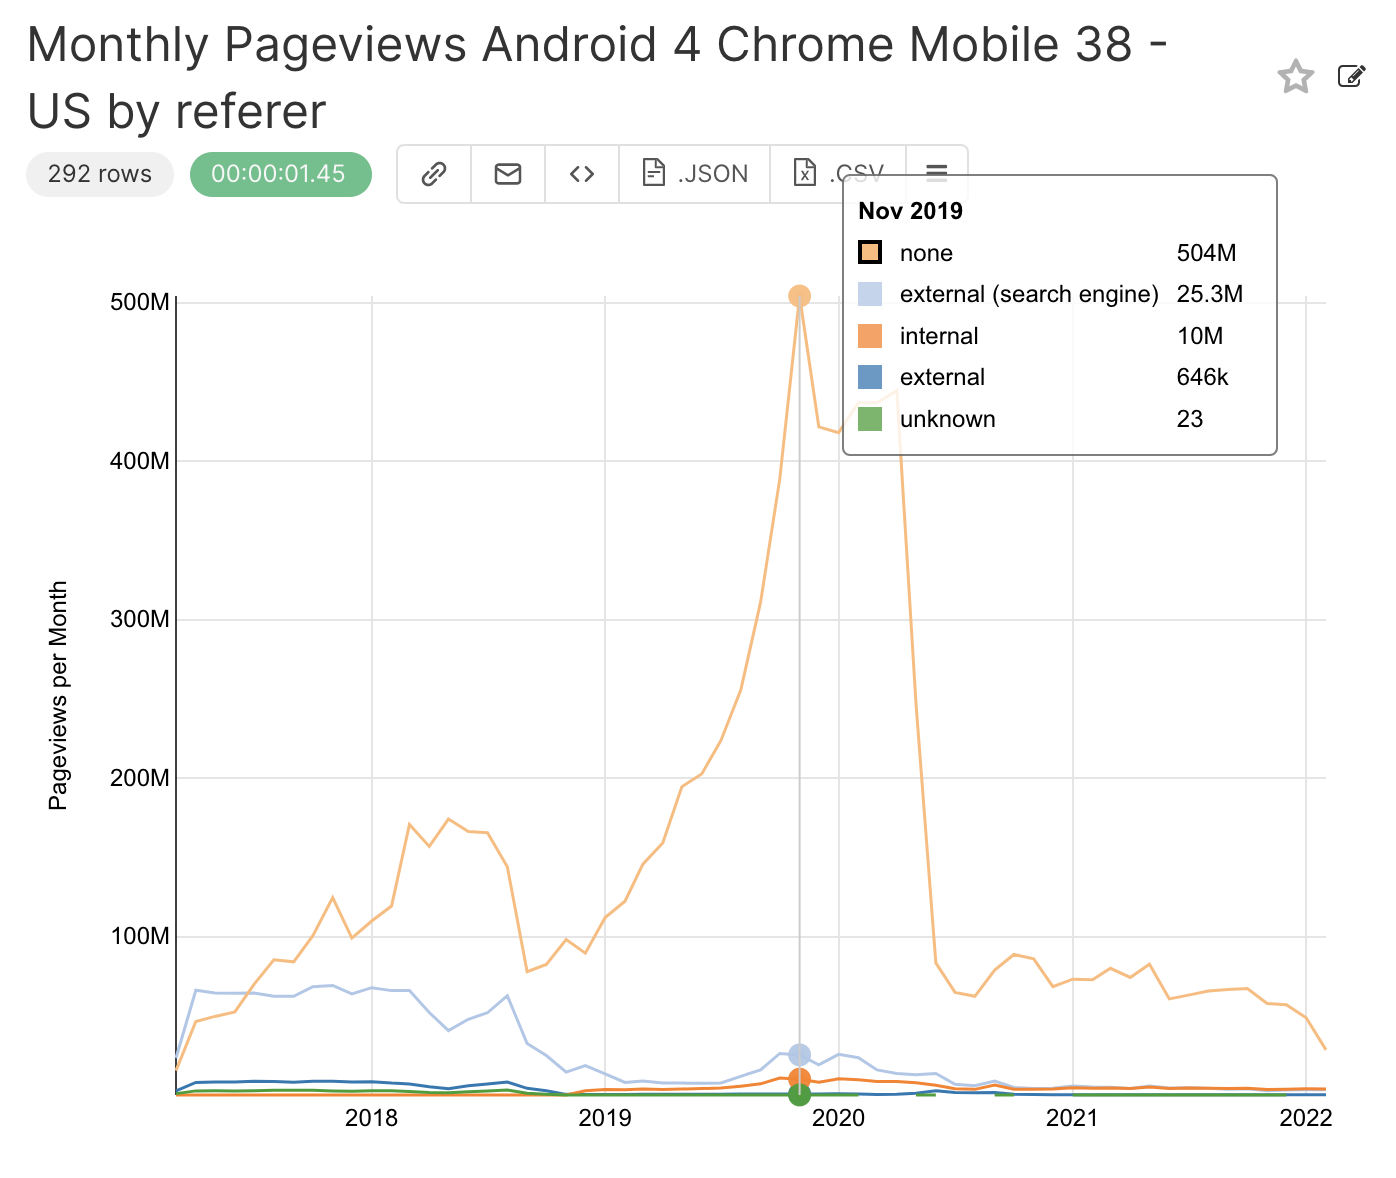
An update on how long the unidentified bot traffic persisted:
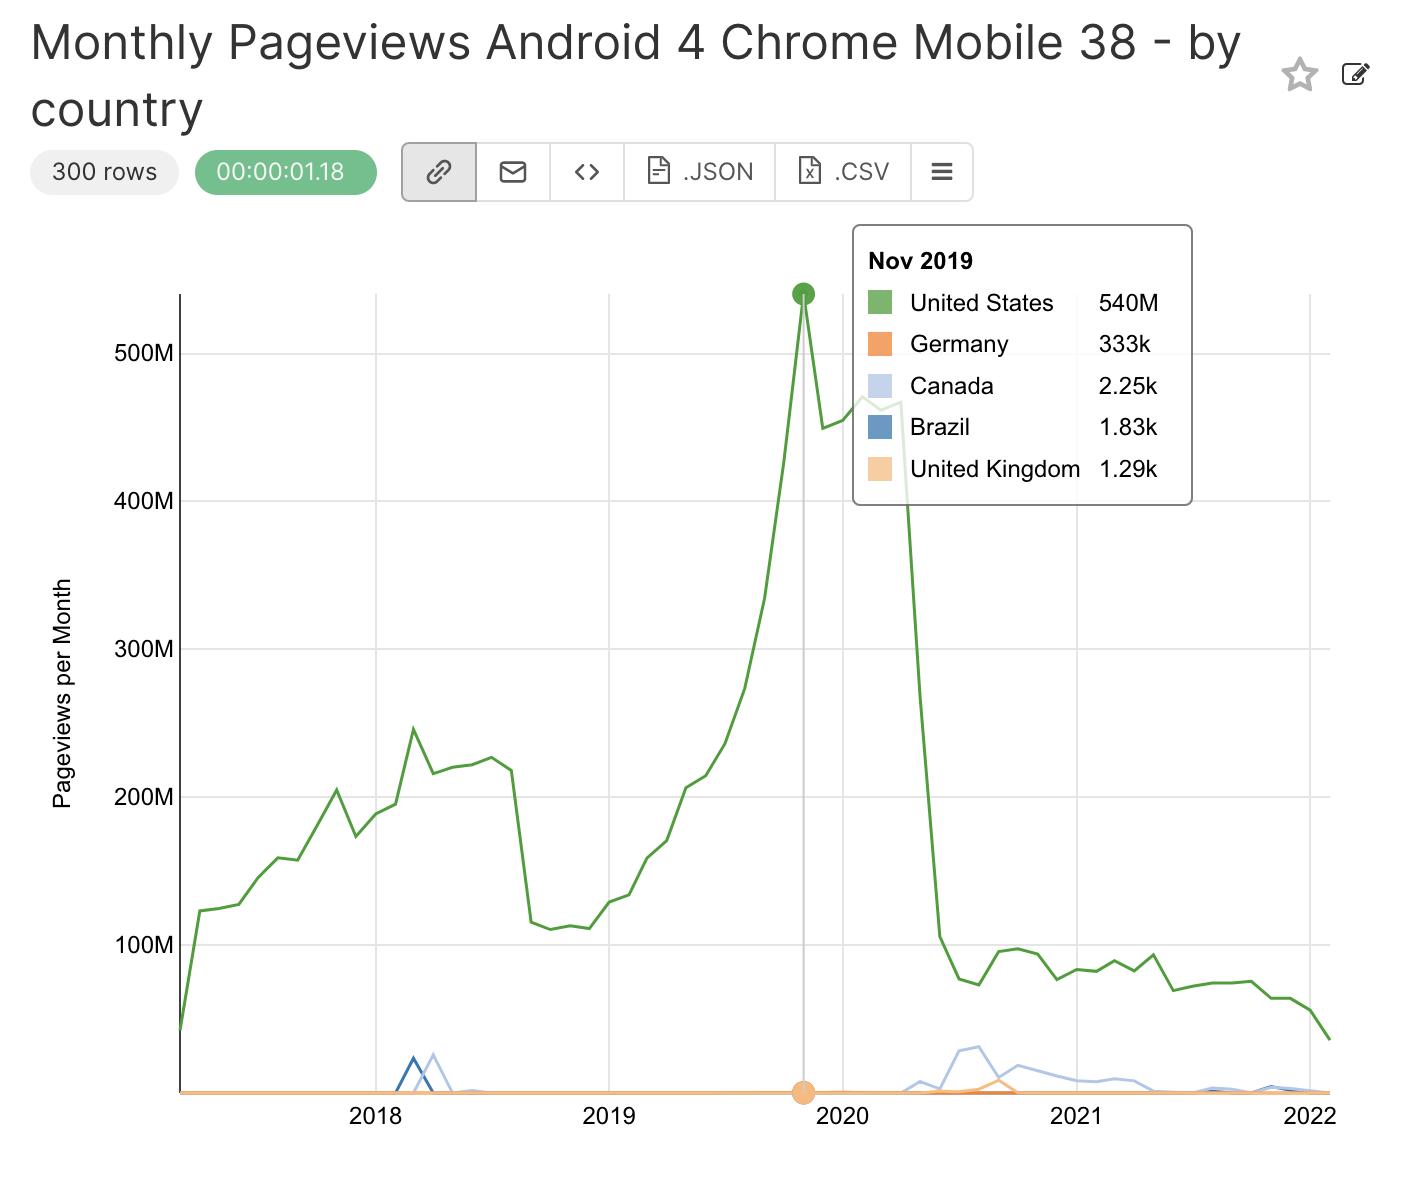
The unusual spike in from a Google Weblight proxy, Chrome Mobile version 38, peaked in November of 2019 and finally returned to historic levels in June 2020. It's possible some of the high numbers in March through May were related to the start of the pandemic.
https://superset.wikimedia.org/r/1031
Comment Actions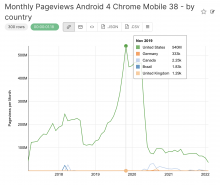
https://superset.wikimedia.org/r/1439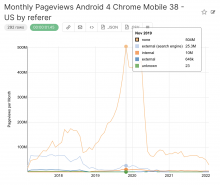
https://superset.wikimedia.org/r/1438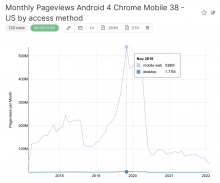
https://superset.wikimedia.org/r/1440
Noting for future reference - as Connie noted above (https://phabricator.wikimedia.org/T239811#5713328), the impact is largely specific to US traffic:
https://superset.wikimedia.org/r/1439
from "none" referers:
https://superset.wikimedia.org/r/1438
and access method is mobile web (the browser identified is a mobile browser)

https://superset.wikimedia.org/r/1440