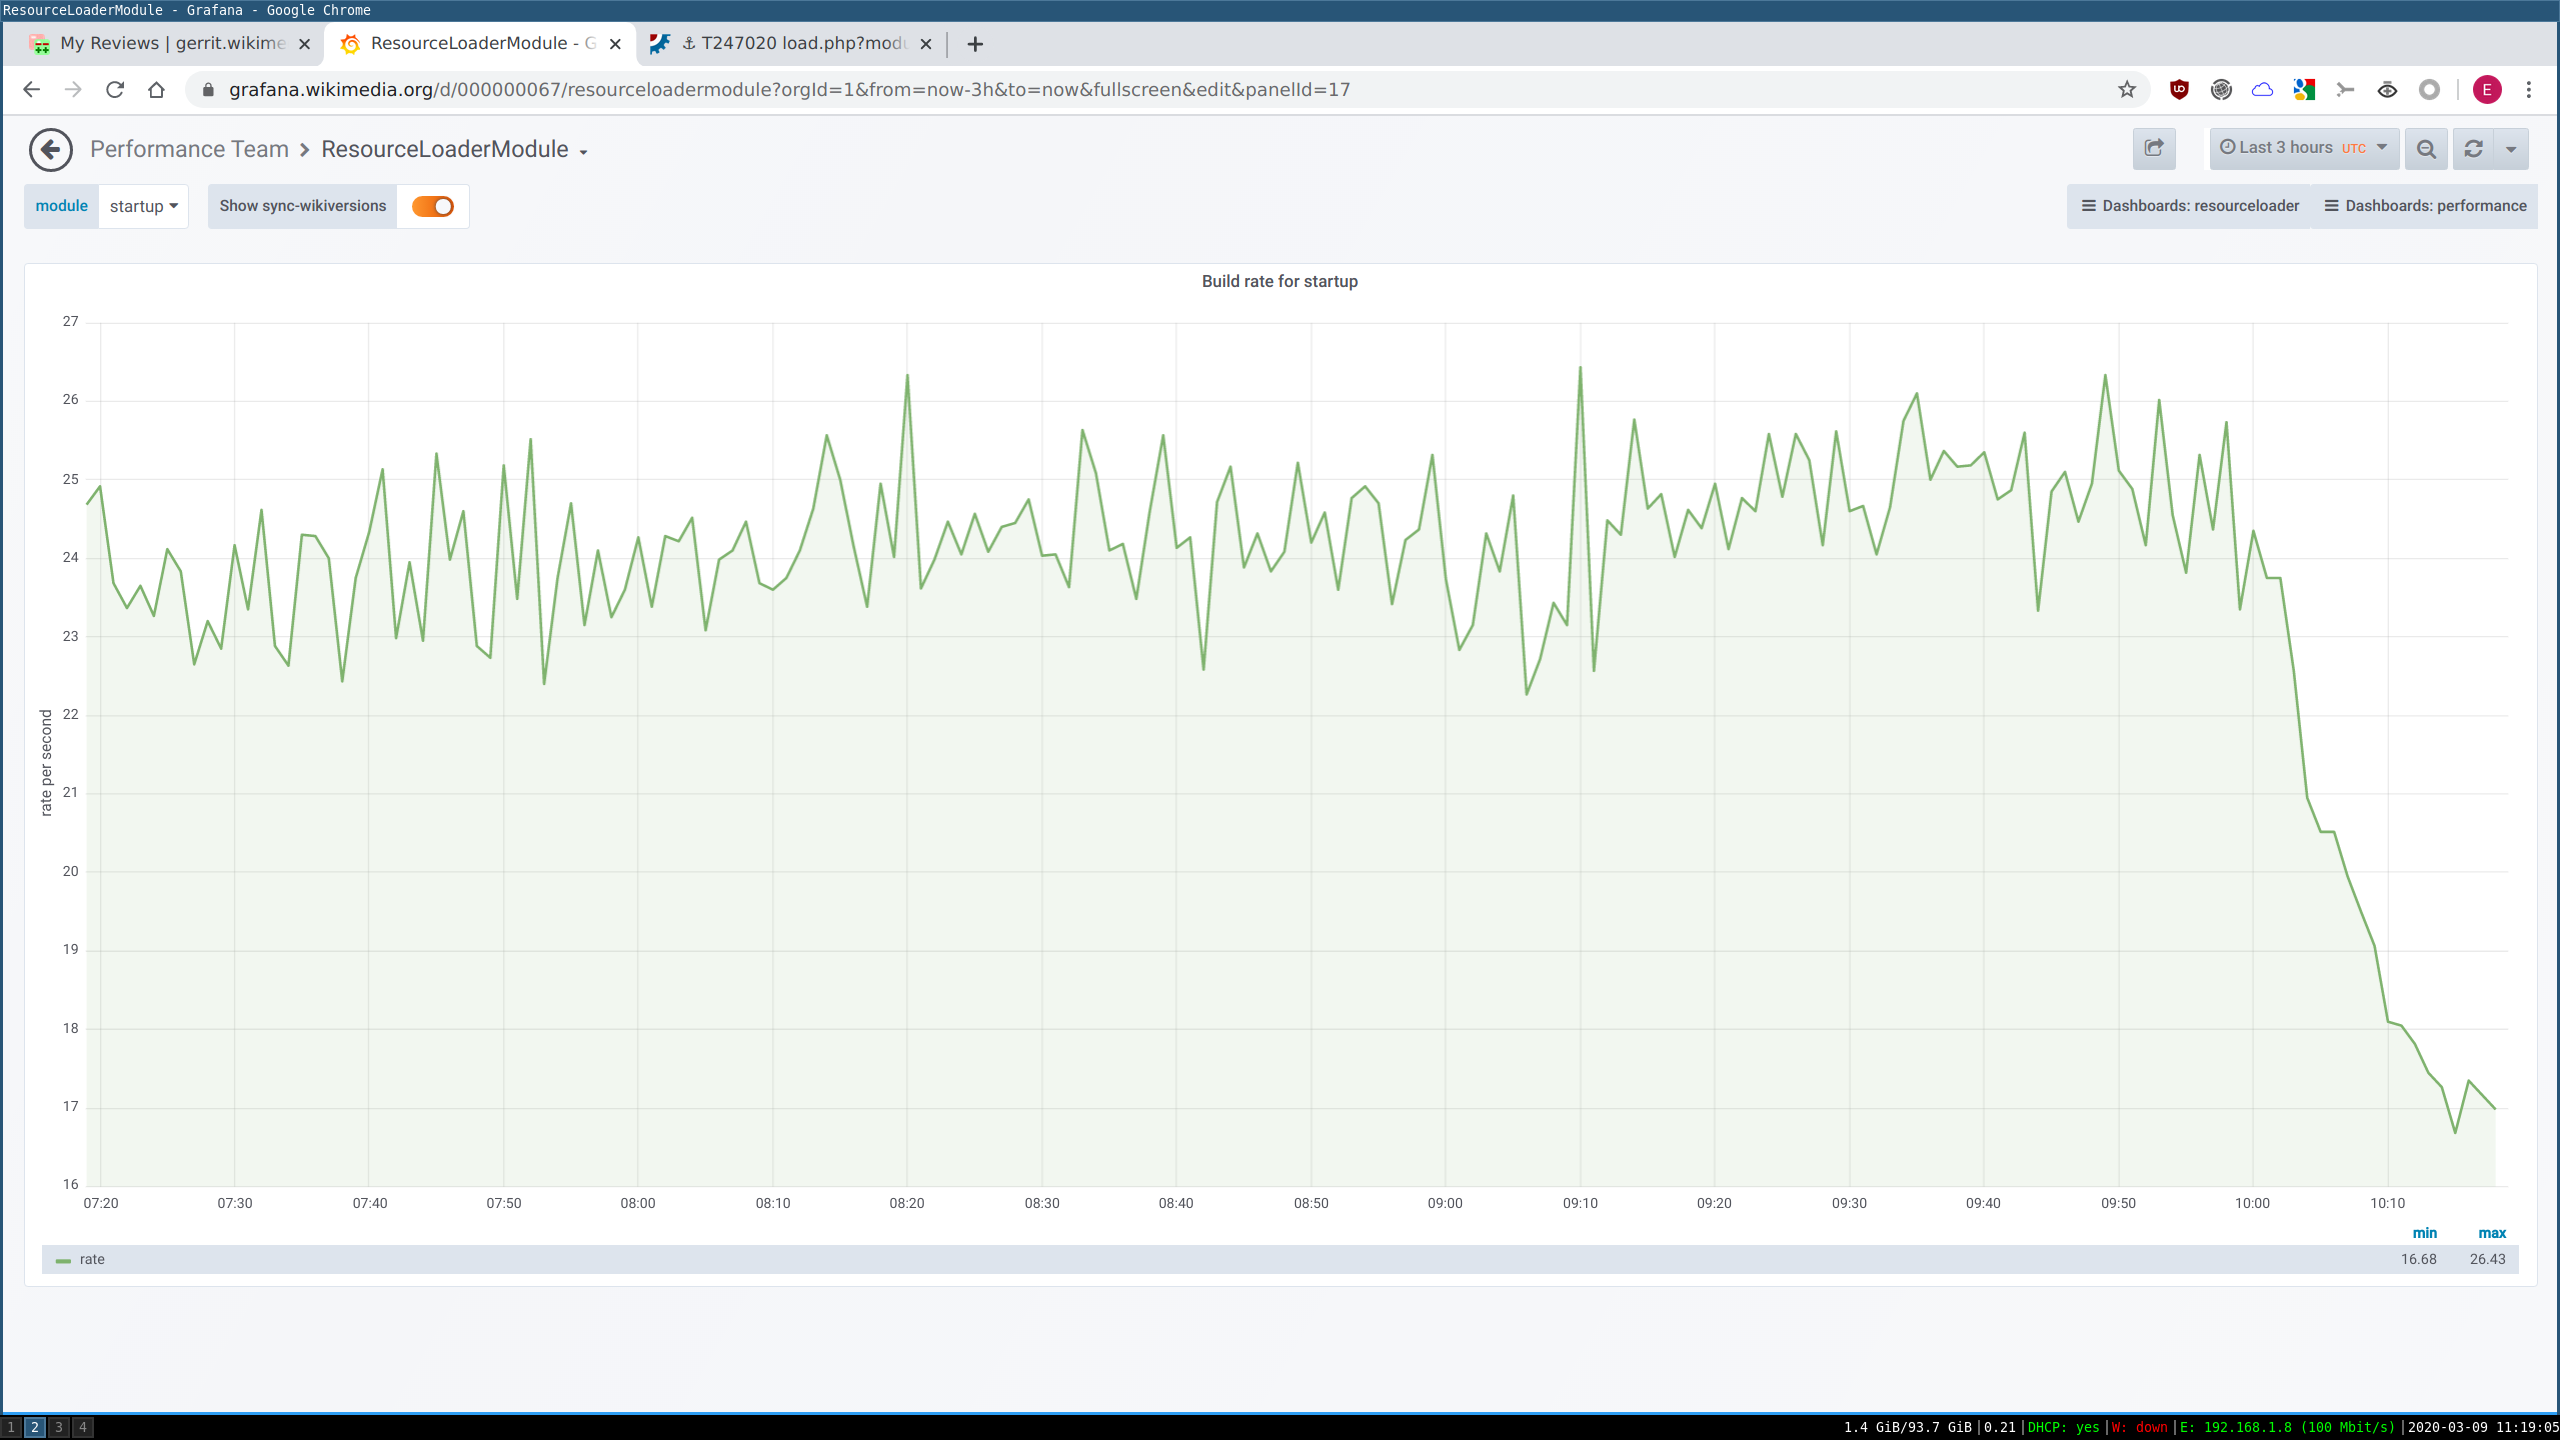
Grafana dashboard: resourceloadermodule/startup/rate
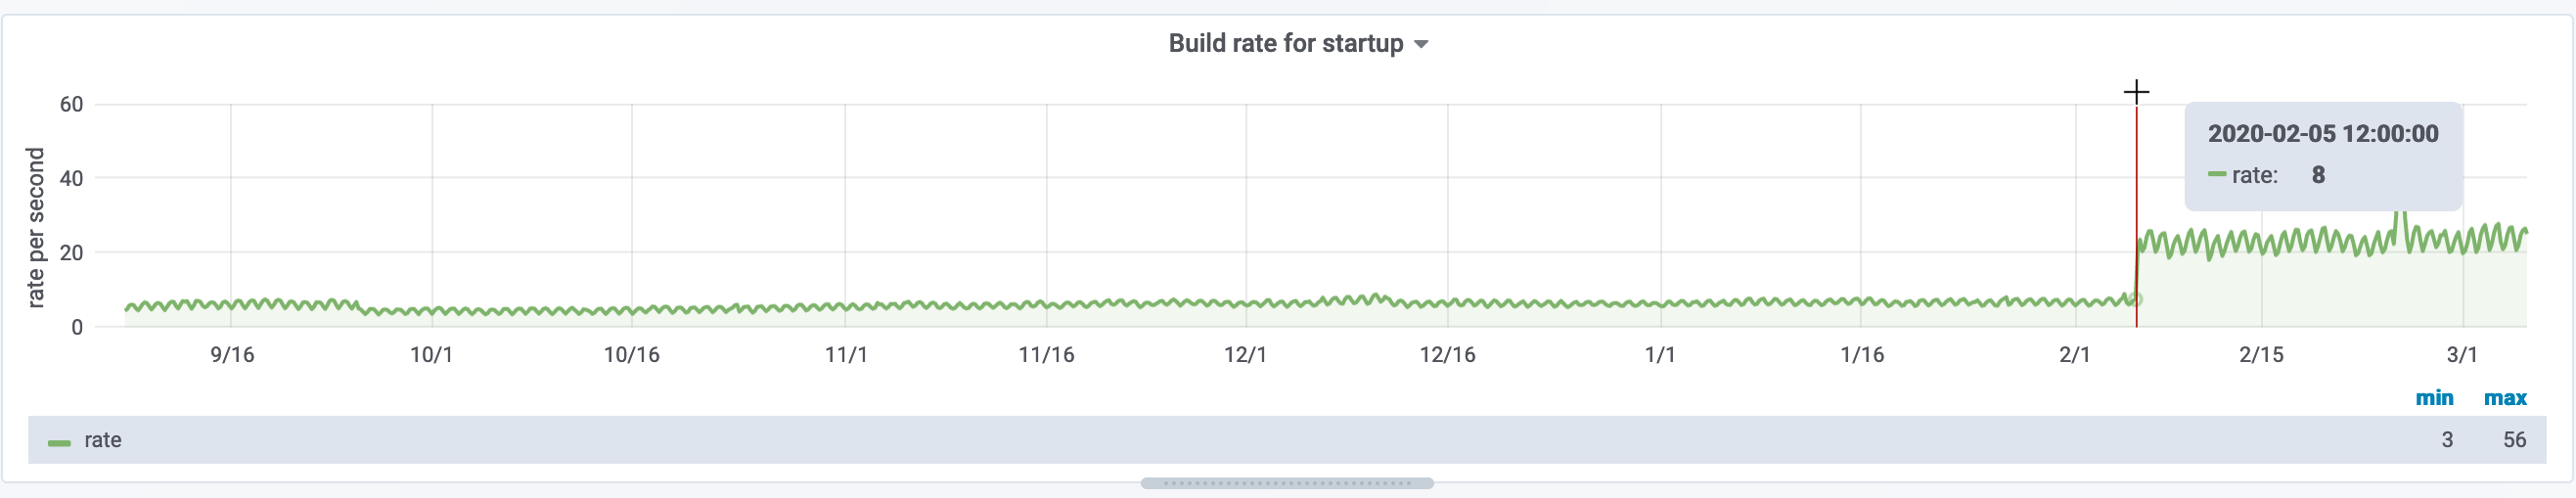
It went from a stable 8 cache-miss backend requests per second (~480/min), to now 20-25 rps (~1300/min).
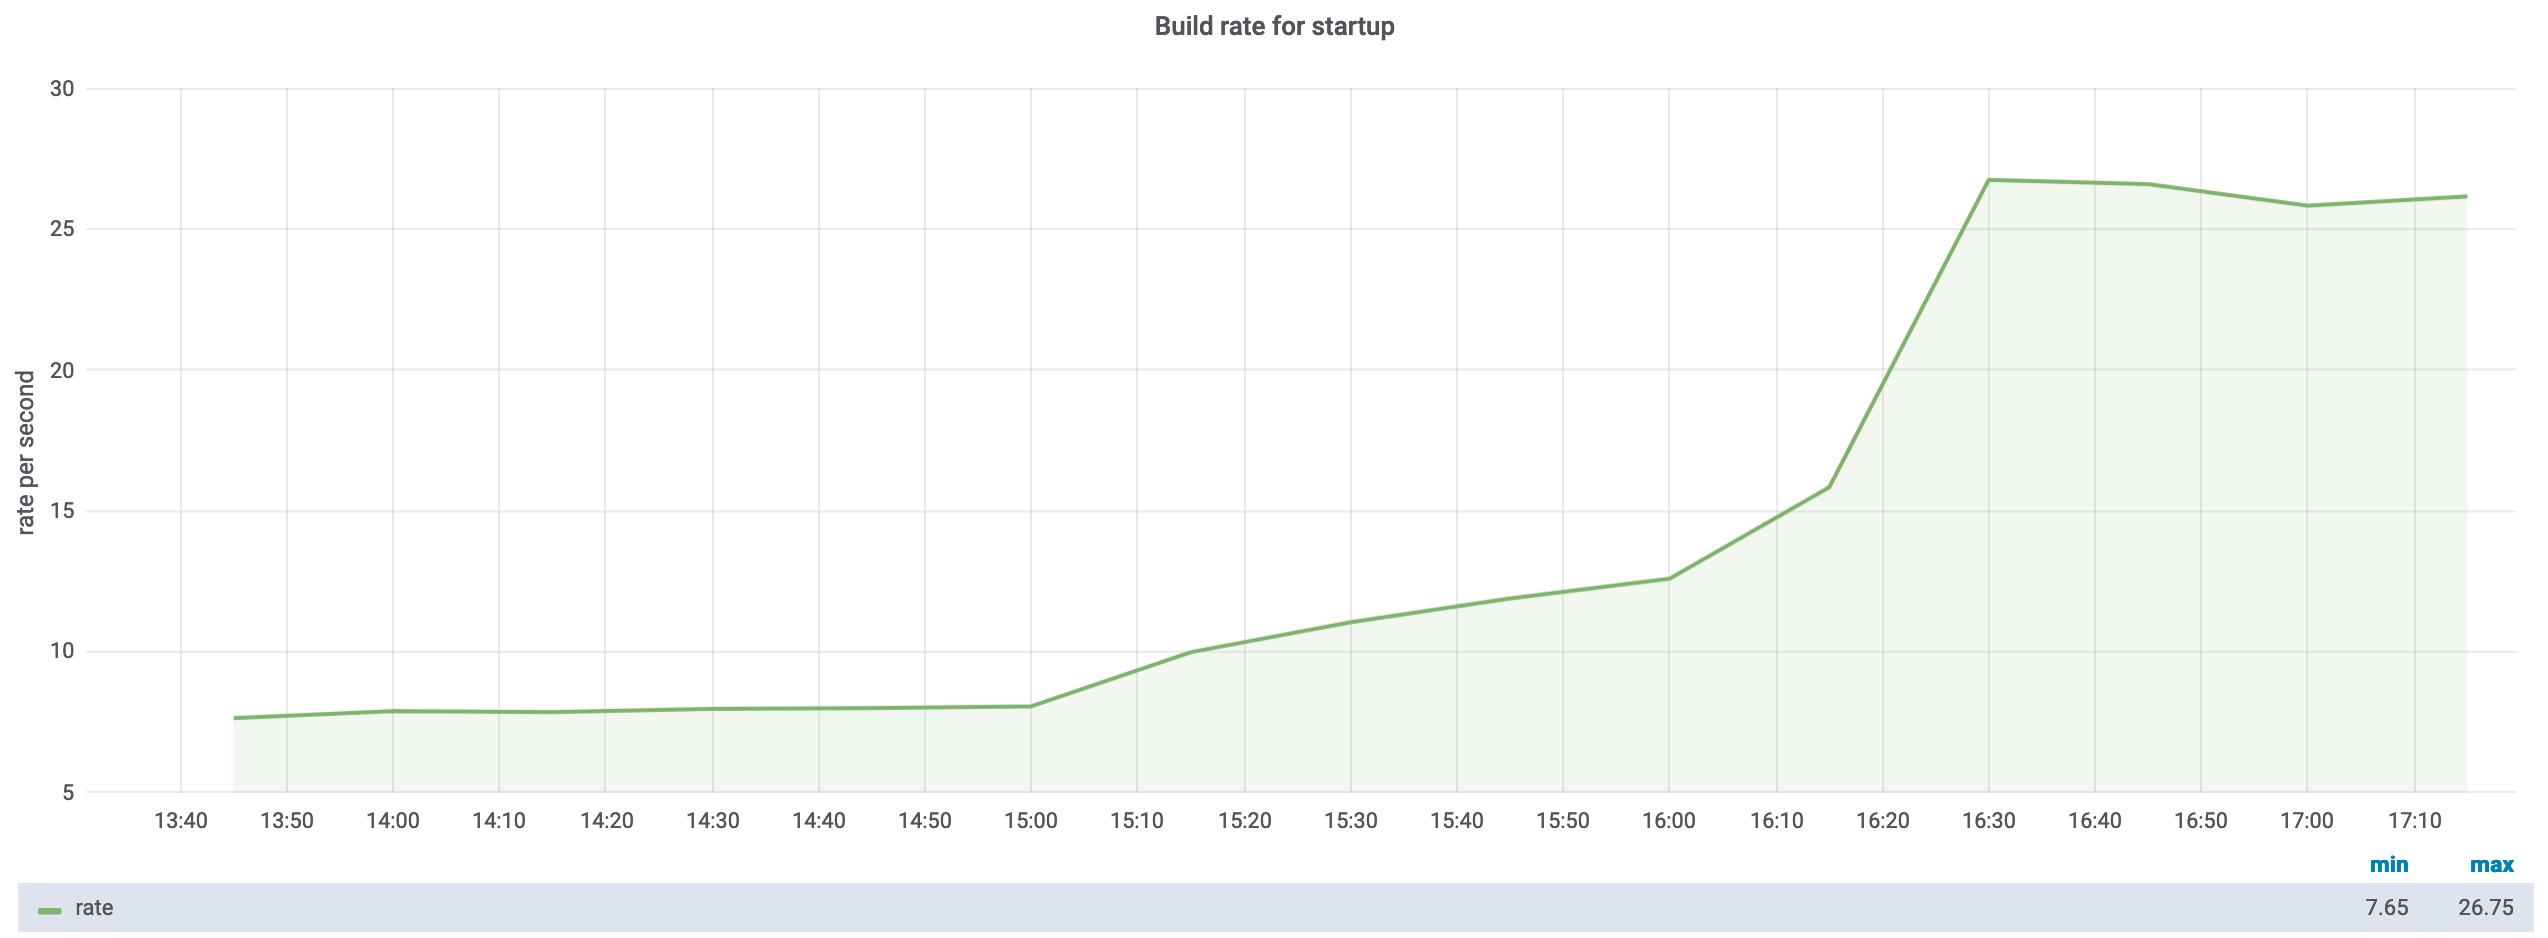
Close up (link):
(There is no moving average applied. Data points have a 15min resolution window from Graphite)
This suggests it started 2020-02-05 between 15:00-15:30, and graduallly tripped over the hour that followed.