Page MenuHomePhabricator

Try to squeeze better performance out of k8s-etcd nodes
Closed, ResolvedPublic

Assigned To
Authored By
Bstorm
Nov 16 2020, 7:22 PM
Referenced Files
F33984640: Screen Shot 2021-01-04 at 10.48.34 AM.png
Jan 4 2021, 6:42 PM
F33963234: 20201221_10h03m20s_grim.png
Dec 21 2020, 9:03 AM
F33963223: 20201218_20h57m01s_grim.png
Dec 21 2020, 9:01 AM
F33948410: Screen Shot 2020-12-17 at 1.10.14 PM.png
Dec 17 2020, 8:10 PM
F33948403: Screen Shot 2020-12-17 at 12.58.37 PM.png
Dec 17 2020, 8:00 PM
F33948110: image.png
Dec 17 2020, 1:29 PM
F33948115: image.png
Dec 17 2020, 1:29 PM

Description

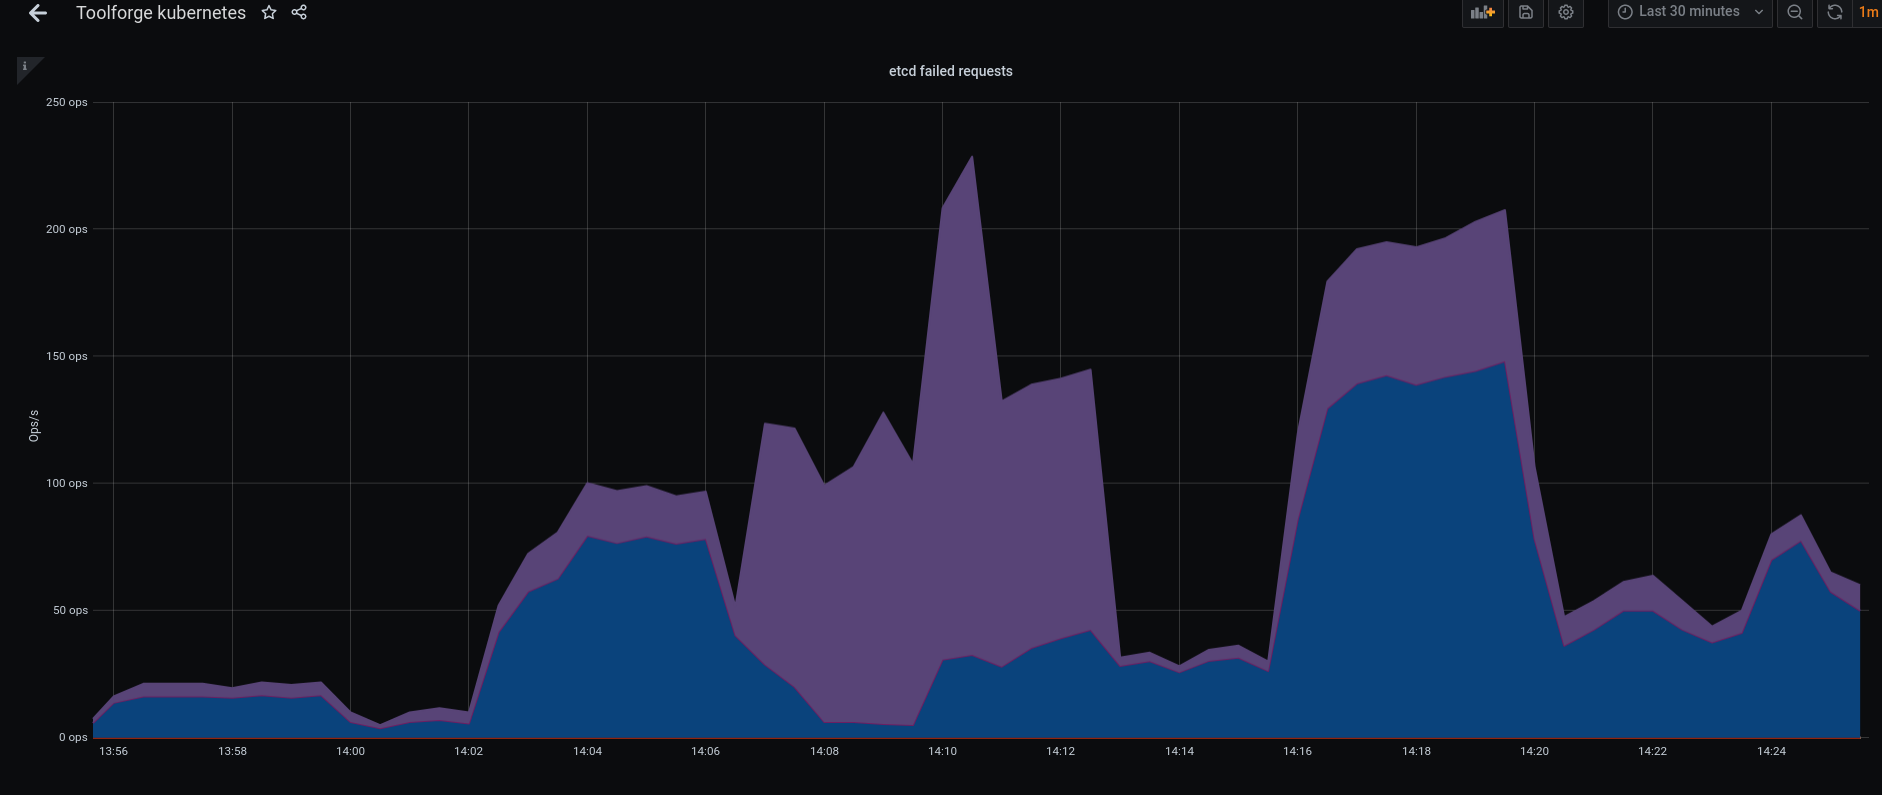
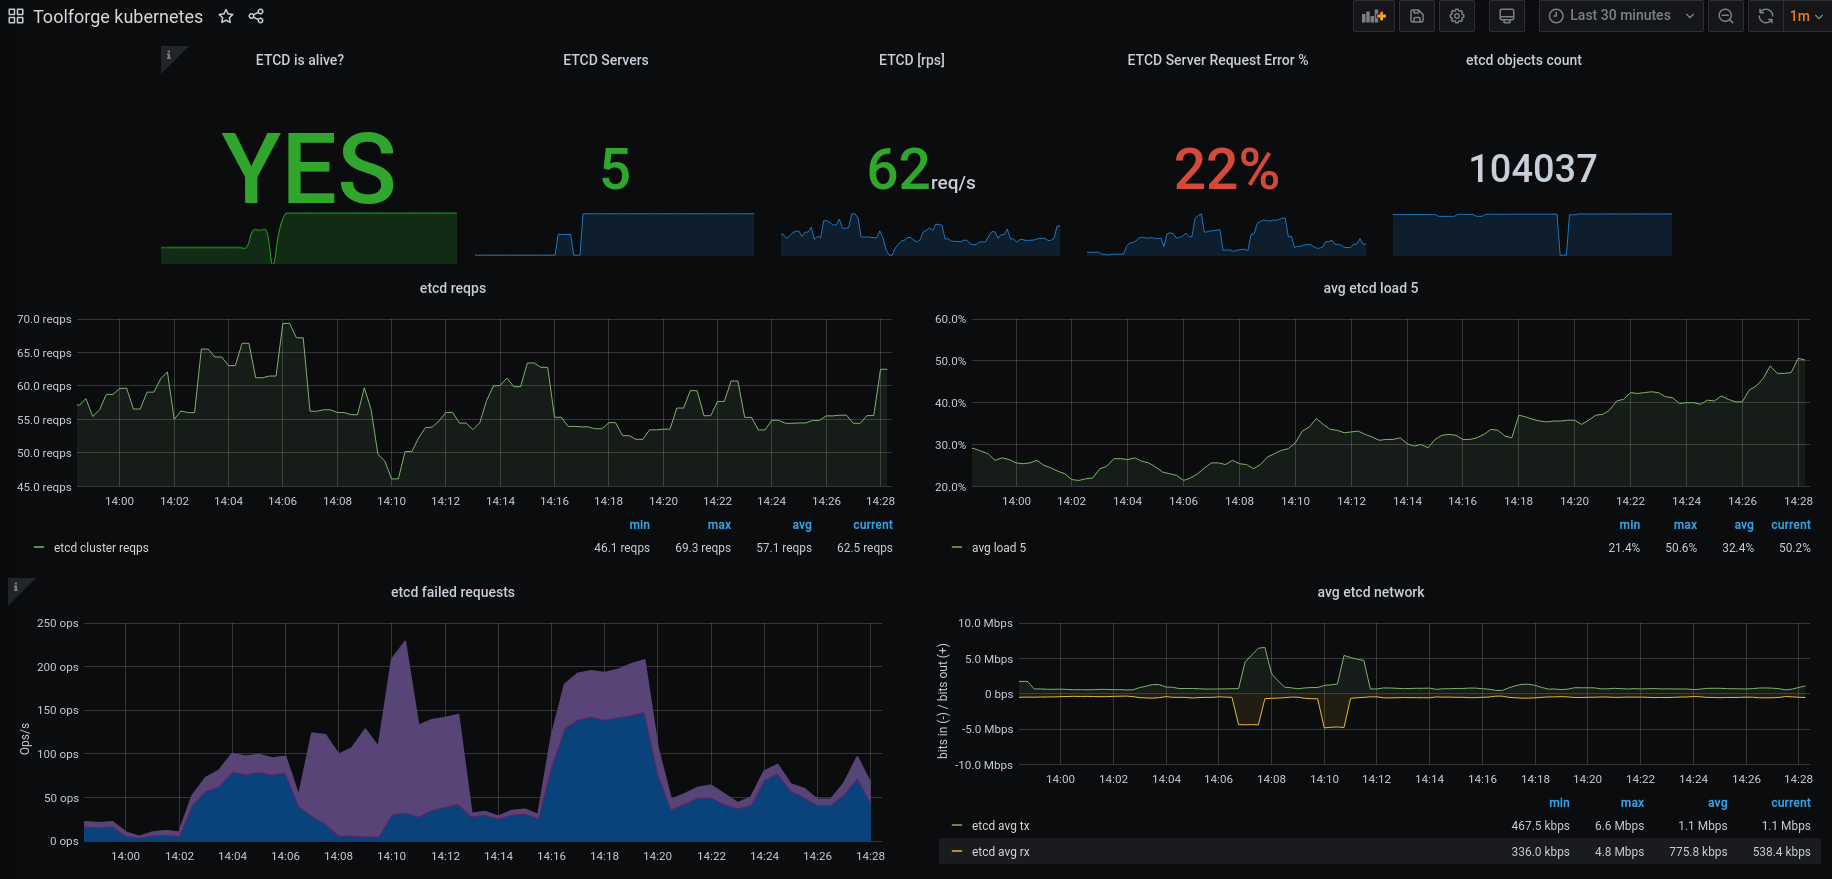
We've seen that improving the IO characteristics helps with the rather high traffic of the etcd cluster. However, it still experiences constant whole-number iowait and the k8s API has nearly full-second response times.

Investigate updating some of the characteristics of the cluster. It uses little storage, appears to have RAM to spare and seems pretty chill as far as CPU is concerned. It just ends up tripping over write requests, ioblocking and may need upgrades and application of server groups.

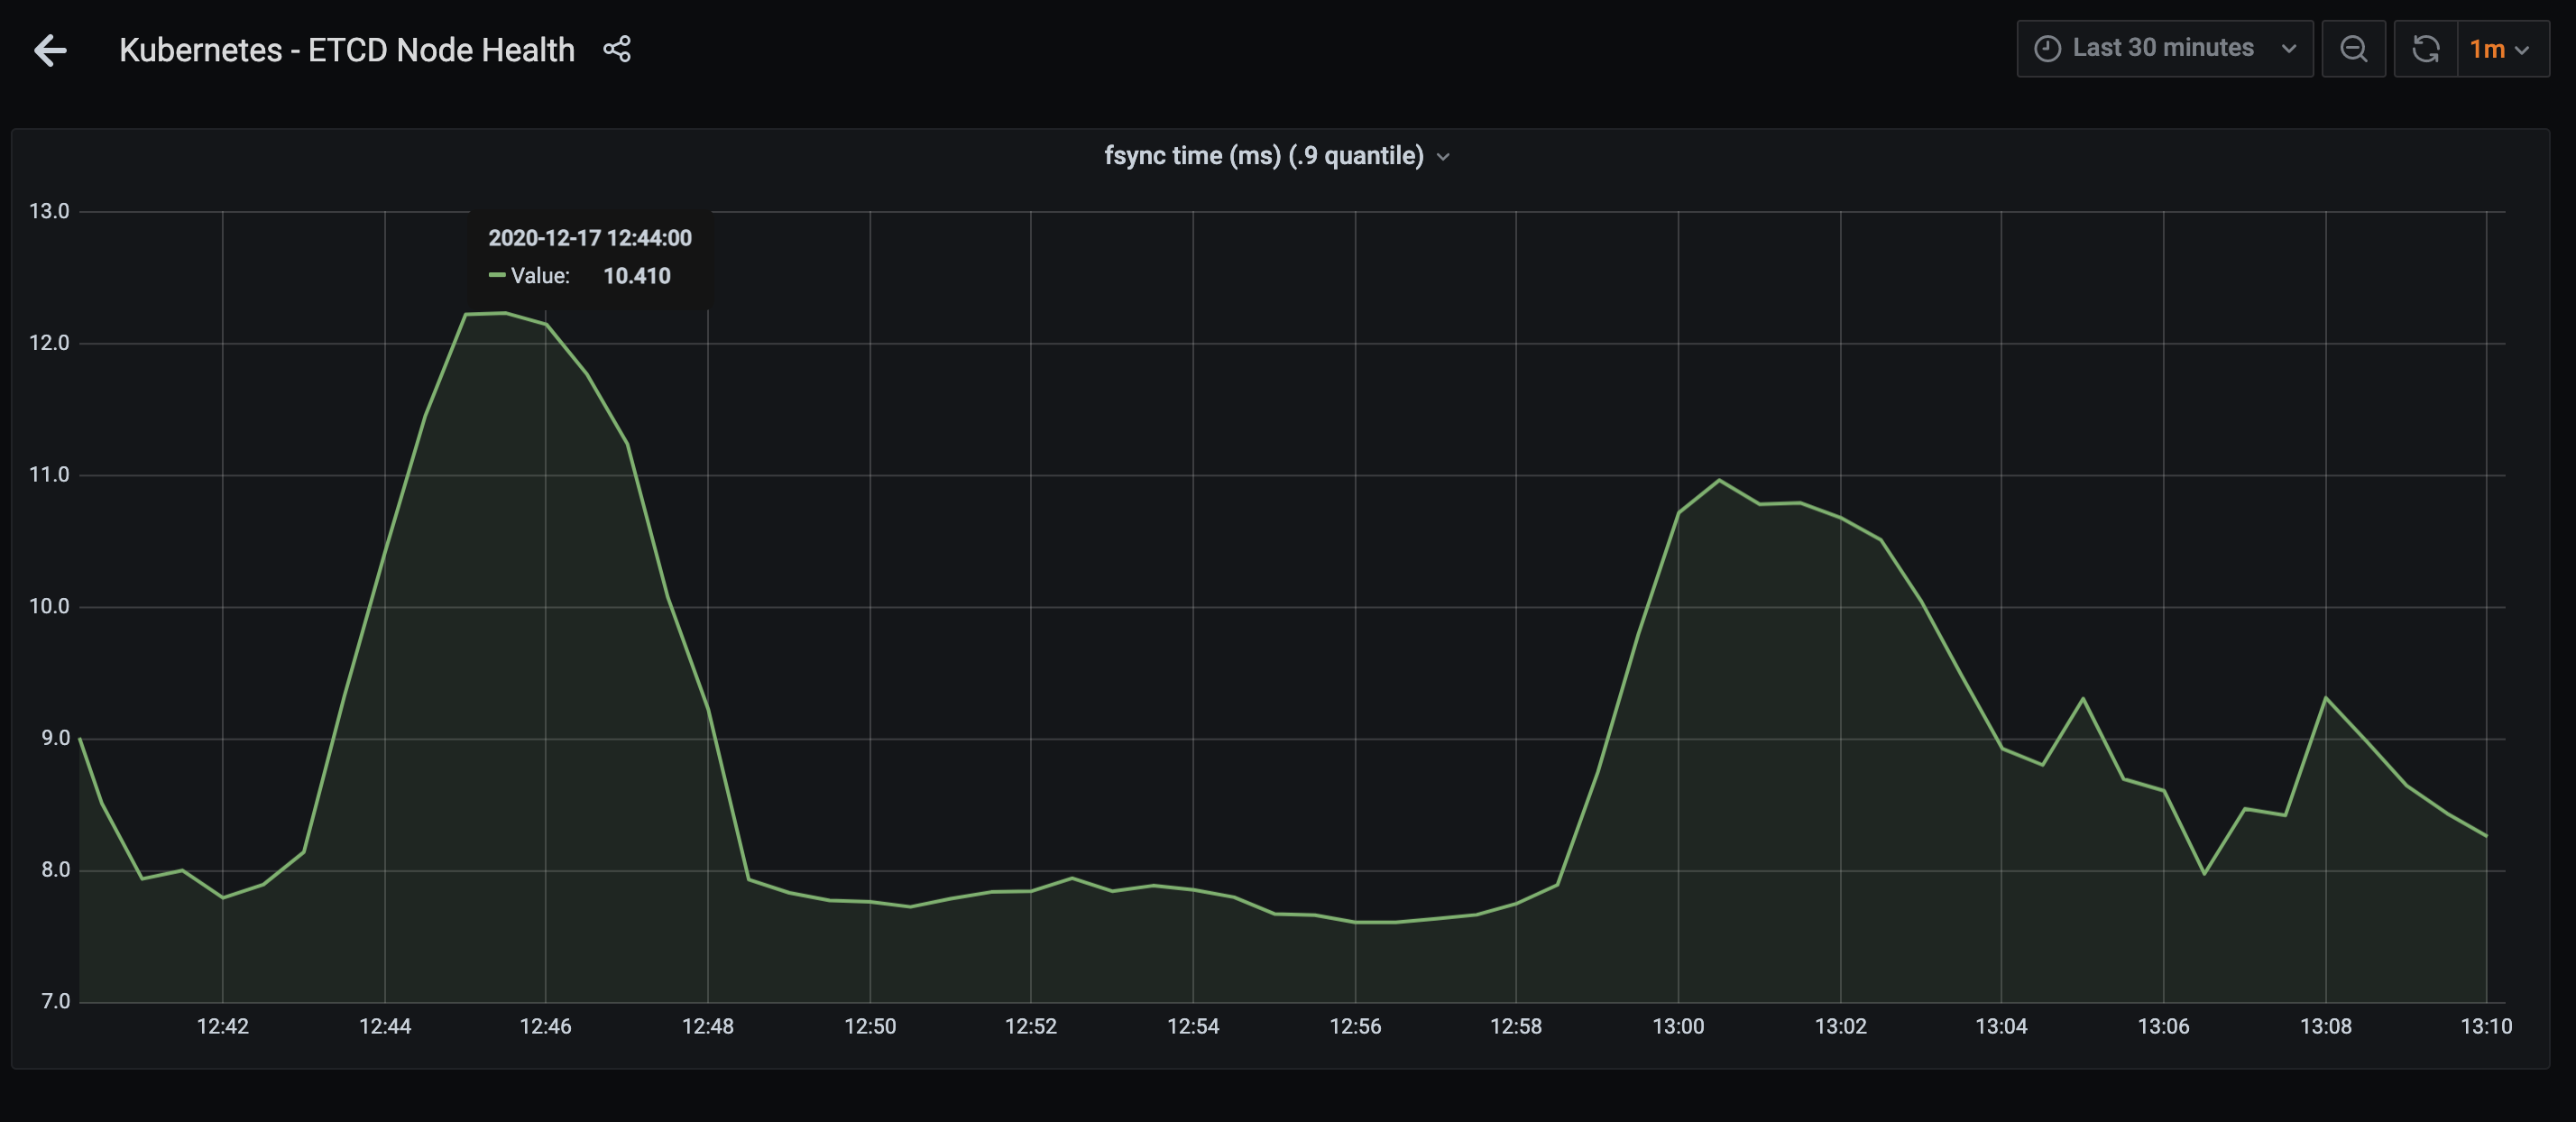
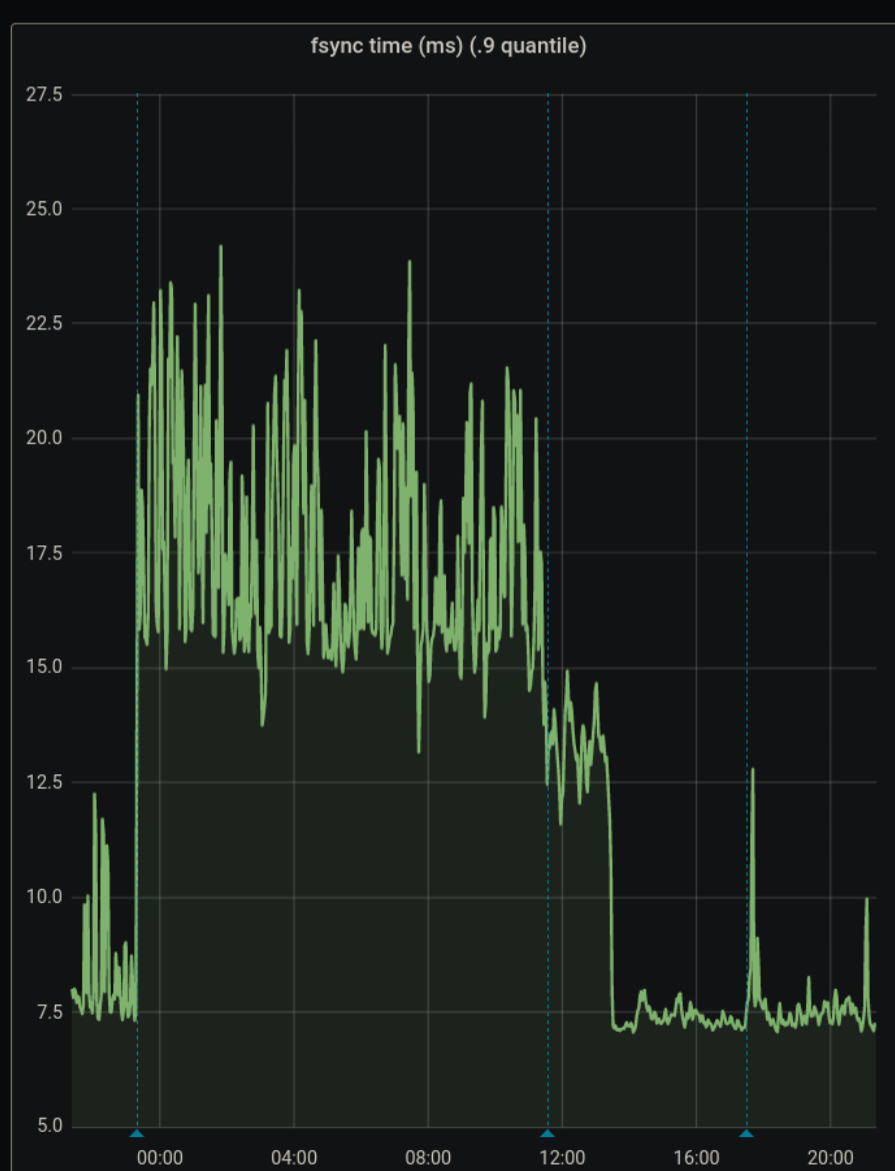
Since it has been determined that io is a big part of the issues here, this is work in parallel with T270305: Ceph performance tuning

Event Timeline

There are a very large number of changes, so older changes are hidden. Show Older Changes

Adding @dcaro as subscriber because this could affect T267082

Andrew triaged this task as High priority.Dec 8 2020, 5:33 PM
Andrew moved this task from Inbox to Soon! on the cloud-services-team (Kanban) board.

I'm suspicious that more nodes will help. I realized during out upgrades that the same things are happening to toolsbeta. Toolsbeta is a nearly silent cluster with no excuse for these symptoms of timeouts and poor performance. I think the deployment and tuning has more to do with the problems than anything else. For one, grepping on "leader" from the logs on toolsbeta:

Dec 11 19:12:58 toolsbeta-test-k8s-etcd-4 etcd[13247]: read-only range request "key:\"/registry/configmaps/ingress-nginx/ingress-controller-leader-nginx\" " with result "range_response_count:1 size:455" took too long (274.918111ms) to execute
Dec 11 19:15:25 toolsbeta-test-k8s-etcd-4 etcd[13247]: raft.node: 5ffb924838da87fe changed leader from 5ffb924838da87fe to c180a79686e4a7de at term 156485
Dec 11 19:15:53 toolsbeta-test-k8s-etcd-4 etcd[13247]: raft.node: 5ffb924838da87fe lost leader c180a79686e4a7de at term 156486
Dec 11 19:15:53 toolsbeta-test-k8s-etcd-4 etcd[13247]: 5ffb924838da87fe became leader at term 156486
Dec 11 19:15:53 toolsbeta-test-k8s-etcd-4 etcd[13247]: raft.node: 5ffb924838da87fe elected leader 5ffb924838da87fe at term 156486
Dec 11 19:16:52 toolsbeta-test-k8s-etcd-4 etcd[13247]: raft.node: 5ffb924838da87fe changed leader from 5ffb924838da87fe to 8a72276c69aa404b at term 156487
Dec 11 19:16:59 toolsbeta-test-k8s-etcd-4 etcd[13247]: raft.node: 5ffb924838da87fe changed leader from 8a72276c69aa404b to cf058388c7baaeeb at term 156488
Dec 11 19:17:29 toolsbeta-test-k8s-etcd-4 etcd[13247]: raft.node: 5ffb924838da87fe lost leader cf058388c7baaeeb at term 156489
Dec 11 19:17:29 toolsbeta-test-k8s-etcd-4 etcd[13247]: 5ffb924838da87fe became leader at term 156489
Dec 11 19:17:29 toolsbeta-test-k8s-etcd-4 etcd[13247]: raft.node: 5ffb924838da87fe elected leader 5ffb924838da87fe at term 156489
Dec 11 19:17:50 toolsbeta-test-k8s-etcd-4 etcd[13247]: raft.node: 5ffb924838da87fe changed leader from 5ffb924838da87fe to c180a79686e4a7de at term 156491
Dec 11 19:17:55 toolsbeta-test-k8s-etcd-4 etcd[13247]: read-only range request "key:\"/registry/configmaps/ingress-nginx/ingress-controller-leader-nginx\" " with result "range_response_count:1 size:455" took too long (5.223362851s) to execute
Dec 11 19:19:37 toolsbeta-test-k8s-etcd-4 etcd[13247]: raft.node: 5ffb924838da87fe changed leader from c180a79686e4a7de to 8a72276c69aa404b at term 156492
Dec 11 19:19:42 toolsbeta-test-k8s-etcd-4 etcd[13247]: raft.node: 5ffb924838da87fe changed leader from 8a72276c69aa404b to 5208bbf5c00e7cdf at term 156493
Dec 11 19:20:08 toolsbeta-test-k8s-etcd-4 etcd[13247]: raft.node: 5ffb924838da87fe lost leader 5208bbf5c00e7cdf at term 156494
Dec 11 19:20:09 toolsbeta-test-k8s-etcd-4 etcd[13247]: 5ffb924838da87fe no leader at term 156495; dropping index reading msg
Dec 11 19:20:10 toolsbeta-test-k8s-etcd-4 etcd[13247]: 5ffb924838da87fe no leader at term 156495; dropping index reading msg
Dec 11 19:20:10 toolsbeta-test-k8s-etcd-4 etcd[13247]: raft.node: 5ffb924838da87fe elected leader 8a72276c69aa404b at term 156495
Dec 11 19:21:24 toolsbeta-test-k8s-etcd-4 etcd[13247]: read-only range request "key:\"/registry/configmaps/ingress-nginx/ingress-controller-leader-nginx\" " with result "range_response_count:1 size:455" took too long (8.745729875s) to execute
Dec 11 19:21:25 toolsbeta-test-k8s-etcd-4 etcd[13247]: raft.node: 5ffb924838da87fe lost leader 8a72276c69aa404b at term 156496
Dec 11 19:21:25 toolsbeta-test-k8s-etcd-4 etcd[13247]: 5ffb924838da87fe became leader at term 156496
Dec 11 19:21:25 toolsbeta-test-k8s-etcd-4 etcd[13247]: raft.node: 5ffb924838da87fe elected leader 5ffb924838da87fe at term 156496
Dec 11 19:23:12 toolsbeta-test-k8s-etcd-4 etcd[13247]: raft.node: 5ffb924838da87fe changed leader from 5ffb924838da87fe to cf058388c7baaeeb at term 156497
Dec 11 19:25:27 toolsbeta-test-k8s-etcd-4 etcd[13247]: raft.node: 5ffb924838da87fe lost leader cf058388c7baaeeb at term 156498
Dec 11 19:25:28 toolsbeta-test-k8s-etcd-4 etcd[13247]: raft.node: 5ffb924838da87fe elected leader c180a79686e4a7de at term 156499

That's really not good. I'm going to compare to the stacked, containerized etcd systems in paws.

Similar issues there!
I'm wondering if we are seeing more issues recently because the 1.17 control plane is more sensitive to them.

E1211 19:54:39.498087       1 leaderelection.go:331] error retrieving resource lock kube-system/kube-controller-manager: etcdserver: request timed out
E1211 19:54:44.220309       1 leaderelection.go:331] error retrieving resource lock kube-system/kube-controller-manager: etcdserver: leader changed
E1211 19:55:39.683834       1 leaderelection.go:331] error retrieving resource lock kube-system/kube-controller-manager: etcdserver: request timed out
E1211 19:56:01.974762       1 leaderelection.go:331] error retrieving resource lock kube-system/kube-controller-manager: Get https://k8s.svc.paws.eqiad1.wikimedia.cloud:6443/api/v1/namespaces/kube-system/endpoints/kube-controller-manager?timeout=10s: net/http: request canceled (Client.Timeout exceeded while awaiting headers)

So we have this problem across 2 versions of etcd (the version is a 3.3 version and kubeadm managed on paws).

A huge problem is that we have Integer $max_latency_ms = 10, in the class we consume in VMs, and that's used directly.

We still should have a 5 node cluster. It's recommended for any prod use by upstream k8s anyway.

Change 648340 had a related patch set uploaded (by Bstorm; owner: Bstorm):
[operations/puppet@production] toolforge: make timeouts for our slow etcd clusters configurable

https://gerrit.wikimedia.org/r/648340

Another thing to add is ionice-type prioritization via systemd override (https://etcd.io/docs/v3.3.12/tuning/#disk)

Change 648340 merged by Bstorm:
[operations/puppet@production] toolforge: make timeouts for our slow etcd clusters configurable

https://gerrit.wikimedia.org/r/648340

I've set the value in toolsbeta to be 45 (which translates to heartbeat of 450ms and election timeout of 4500ms). Prior to setting this on that cluster (which is already 5 nodes thanks to @dcaro) it was doing this:

Dec 11 18:09:33 toolsbeta-test-k8s-etcd-4 etcd[13247]: 5ffb924838da87fe is starting a new election at term 156453
Dec 11 18:49:05 toolsbeta-test-k8s-etcd-4 etcd[13247]: 5ffb924838da87fe is starting a new election at term 156467
Dec 11 19:01:51 toolsbeta-test-k8s-etcd-4 etcd[13247]: 5ffb924838da87fe is starting a new election at term 156473
Dec 11 19:08:40 toolsbeta-test-k8s-etcd-4 etcd[13247]: 5ffb924838da87fe is starting a new election at term 156479
Dec 11 19:10:22 toolsbeta-test-k8s-etcd-4 etcd[13247]: 5ffb924838da87fe is starting a new election at term 156480
Dec 11 19:12:39 toolsbeta-test-k8s-etcd-4 etcd[13247]: 5ffb924838da87fe is starting a new election at term 156482
Dec 11 19:12:40 toolsbeta-test-k8s-etcd-4 etcd[13247]: 5ffb924838da87fe is starting a new election at term 156483
Dec 11 19:15:53 toolsbeta-test-k8s-etcd-4 etcd[13247]: 5ffb924838da87fe is starting a new election at term 156485
Dec 11 19:17:29 toolsbeta-test-k8s-etcd-4 etcd[13247]: 5ffb924838da87fe is starting a new election at term 156488
Dec 11 19:20:08 toolsbeta-test-k8s-etcd-4 etcd[13247]: 5ffb924838da87fe is starting a new election at term 156493
Dec 11 19:21:25 toolsbeta-test-k8s-etcd-4 etcd[13247]: 5ffb924838da87fe is starting a new election at term 156495
Dec 11 19:28:53 toolsbeta-test-k8s-etcd-4 etcd[13247]: 5ffb924838da87fe is starting a new election at term 156499
Dec 11 19:38:53 toolsbeta-test-k8s-etcd-4 etcd[13247]: 5ffb924838da87fe is starting a new election at term 156502
Dec 11 19:42:29 toolsbeta-test-k8s-etcd-4 etcd[13247]: 5ffb924838da87fe is starting a new election at term 156510
Dec 11 19:44:40 toolsbeta-test-k8s-etcd-4 etcd[13247]: 5ffb924838da87fe is starting a new election at term 156514
Dec 11 19:45:31 toolsbeta-test-k8s-etcd-4 etcd[13247]: 5ffb924838da87fe is starting a new election at term 156515
Dec 11 19:52:49 toolsbeta-test-k8s-etcd-4 etcd[13247]: 5ffb924838da87fe is starting a new election at term 156520
Dec 11 19:52:50 toolsbeta-test-k8s-etcd-4 etcd[13247]: 5ffb924838da87fe is starting a new election at term 156521
Dec 11 19:53:11 toolsbeta-test-k8s-etcd-4 etcd[13247]: 5ffb924838da87fe is starting a new election at term 156525
Dec 11 19:55:16 toolsbeta-test-k8s-etcd-4 etcd[13247]: 5ffb924838da87fe is starting a new election at term 156527
Dec 11 19:55:17 toolsbeta-test-k8s-etcd-4 etcd[13247]: 5ffb924838da87fe is starting a new election at term 156528
Dec 11 19:59:46 toolsbeta-test-k8s-etcd-4 etcd[13247]: 5ffb924838da87fe is starting a new election at term 156540
Dec 11 20:02:04 toolsbeta-test-k8s-etcd-4 etcd[13247]: 5ffb924838da87fe is starting a new election at term 156543
Dec 11 20:13:00 toolsbeta-test-k8s-etcd-4 etcd[13247]: 5ffb924838da87fe is starting a new election at term 156546
Dec 11 20:13:12 toolsbeta-test-k8s-etcd-4 etcd[13247]: 5ffb924838da87fe is starting a new election at term 156548
Dec 11 20:13:14 toolsbeta-test-k8s-etcd-4 etcd[13247]: 5ffb924838da87fe is starting a new election at term 156550
Dec 11 20:45:49 toolsbeta-test-k8s-etcd-4 etcd[13247]: 5ffb924838da87fe is starting a new election at term 156559
Dec 11 20:46:02 toolsbeta-test-k8s-etcd-4 etcd[13247]: 5ffb924838da87fe is starting a new election at term 156561
Dec 11 20:54:26 toolsbeta-test-k8s-etcd-4 etcd[13247]: 5ffb924838da87fe is starting a new election at term 156563
Dec 11 21:02:33 toolsbeta-test-k8s-etcd-4 etcd[13247]: 5ffb924838da87fe is starting a new election at term 156567

We'll know soon if that fixes things. This will increase overall latency for the cluster in some ways, but I think the constant elections was doing the worst possible thing and making it downright unresponsive. The take-home here is that etcd is a very good candidate for turning into a "provider service" on bare metal (*nudges @aborrero *). Again, this was what we found when investigating our ancient 1.4 cluster as well, but this seems to be causing more obvious problems now.

10 min and the logs seem ok, but that did happen occasionally previously.

I want this, but I cannot have it in old etcd https://github.com/etcd-io/etcd/pull/12448
Quieter logs, quieter disks.

Change 648354 had a related patch set uploaded (by Bstorm; owner: Bstorm):
[operations/puppet@production] etcd: make snapshot interval configurable

https://gerrit.wikimedia.org/r/648354

Went ahead and tested disk speeds according to what some people in the community are doing to validate "disk fast enough for etcd" on toolsbeta (which is a more heavily throttled ceph). I got this:

bstorm@toolsbeta-test-k8s-etcd-4:/tmp$ fio --rw=write --ioengine=sync --fdatasync=1 --directory=test-data --size=22m --bs=2300 --name=mytest
mytest: (g=0): rw=write, bs=(R) 2300B-2300B, (W) 2300B-2300B, (T) 2300B-2300B, ioengine=sync, iodepth=1
fio-3.12
Starting 1 process
mytest: Laying out IO file (1 file / 22MiB)
Jobs: 1 (f=1): [W(1)][100.0%][w=319KiB/s][w=142 IOPS][eta 00m:00s]
mytest: (groupid=0, jobs=1): err= 0: pid=17745: Fri Dec 11 23:53:10 2020
  write: IOPS=192, BW=431KiB/s (442kB/s)(21.0MiB/52210msec); 0 zone resets
    clat (usec): min=8, max=2907, avg=38.16, stdev=46.93
     lat (usec): min=10, max=2910, avg=41.90, stdev=57.56
    clat percentiles (usec):
     |  1.00th=[   13],  5.00th=[   17], 10.00th=[   19], 20.00th=[   24],
     | 30.00th=[   26], 40.00th=[   28], 50.00th=[   32], 60.00th=[   38],
     | 70.00th=[   43], 80.00th=[   49], 90.00th=[   56], 95.00th=[   65],
     | 99.00th=[  115], 99.50th=[  196], 99.90th=[  668], 99.95th=[  807],
     | 99.99th=[ 1057]
   bw (  KiB/s): min=   13, max=  579, per=100.00%, avg=439.68, stdev=86.12, samples=102
   iops        : min=    6, max=  258, avg=195.90, stdev=38.31, samples=102
  lat (usec)   : 10=0.05%, 20=13.15%, 50=69.42%, 100=15.99%, 250=1.00%
  lat (usec)   : 500=0.22%, 750=0.10%, 1000=0.04%
  lat (msec)   : 2=0.02%, 4=0.01%
  fsync/fdatasync/sync_file_range:
    sync (usec): min=1350, max=1513.2k, avg=5140.74, stdev=15969.15
    sync percentiles (usec):
     |  1.00th=[  1811],  5.00th=[  2089], 10.00th=[  2278], 20.00th=[  2540],
     | 30.00th=[  2802], 40.00th=[  3425], 50.00th=[  4817], 60.00th=[  5276],
     | 70.00th=[  5604], 80.00th=[  6128], 90.00th=[  7767], 95.00th=[ 10159],
     | 99.00th=[ 15926], 99.50th=[ 20579], 99.90th=[ 35390], 99.95th=[160433],
     | 99.99th=[221250]
  cpu          : usr=0.74%, sys=2.03%, ctx=29177, majf=0, minf=13
  IO depths    : 1=200.0%, 2=0.0%, 4=0.0%, 8=0.0%, 16=0.0%, 32=0.0%, >=64=0.0%
     submit    : 0=0.0%, 4=100.0%, 8=0.0%, 16=0.0%, 32=0.0%, 64=0.0%, >=64=0.0%
     complete  : 0=0.0%, 4=100.0%, 8=0.0%, 16=0.0%, 32=0.0%, 64=0.0%, >=64=0.0%
     issued rwts: total=0,10029,0,0 short=10029,0,0,0 dropped=0,0,0,0
     latency   : target=0, window=0, percentile=100.00%, depth=1

Run status group 0 (all jobs):
  WRITE: bw=431KiB/s (442kB/s), 431KiB/s-431KiB/s (442kB/s-442kB/s), io=21.0MiB (23.1MB), run=52210-52210msec

Disk stats (read/write):
  vda: ios=116/26841, merge=0/11611, ticks=194/54857, in_queue=6888, util=12.18%

I heard you want fdatasync to be less than 10ms at 99th percentile.

fsync/fdatasync/sync_file_range:
    sync (usec): min=1350, max=1513.2k, avg=5140.74, stdev=15969.15
    sync percentiles (usec):
     |  1.00th=[  1811],  5.00th=[  2089], 10.00th=[  2278], 20.00th=[  2540],
     | 30.00th=[  2802], 40.00th=[  3425], 50.00th=[  4817], 60.00th=[  5276],
     | 70.00th=[  5604], 80.00th=[  6128], 90.00th=[  7767], 95.00th=[ 10159],
     | 99.00th=[ 15926], 99.50th=[ 20579], 99.90th=[ 35390], 99.95th=[160433],
     | 99.99th=[221250]

Clearly this is not true on our normal throttles.
(one source: https://www.ibm.com/cloud/blog/using-fio-to-tell-whether-your-storage-is-fast-enough-for-etcd)

Another thing that was made GA in 1.17: node leases. We can disable them if we want to, but they are supposed to improve performance :) We'll see.

On tools project I got this result from the above tool:

fsync/fdatasync/sync_file_range:
    sync (usec): min=1420, max=2257.2k, avg=6120.11, stdev=45263.39
    sync percentiles (usec):
     |  1.00th=[   1860],  5.00th=[   2147], 10.00th=[   2311],
     | 20.00th=[   2573], 30.00th=[   2802], 40.00th=[   3523],
     | 50.00th=[   4817], 60.00th=[   5211], 70.00th=[   5538],
     | 80.00th=[   5932], 90.00th=[   6915], 95.00th=[   9372],
     | 99.00th=[  16909], 99.50th=[  21890], 99.90th=[ 244319],
     | 99.95th=[1233126], 99.99th=[2004878]

That's...worse! However, that's with etcd fully cranking on our main k8s cluster. I suspect that we need to run the test on a quiet and new node with that flavor.

Oh wow, that's a full order of magnitude worse :/
Nice read btw :)

I created an instance using the same flavor in tools today to take the test on a quiet version of the same thing as other tools-k8s-etcd systems:

fsync/fdatasync/sync_file_range:
  sync (usec): min=1882, max=206807, avg=5182.17, stdev=4459.43
  sync percentiles (msec):
   |  1.00th=[    3],  5.00th=[    3], 10.00th=[    3], 20.00th=[    3],
   | 30.00th=[    4], 40.00th=[    4], 50.00th=[    6], 60.00th=[    6],
   | 70.00th=[    7], 80.00th=[    7], 90.00th=[    7], 95.00th=[    8],
   | 99.00th=[   14], 99.50th=[   16], 99.90th=[   41], 99.95th=[   75],
   | 99.99th=[  199]

I see that fio is a tool for people who like a challenge and it changes the units on you depending on the resulting data. This run mysteriously is numbered in ms instead of μs. The short of it is that with a quiet host, the numbers are slightly better than the standard flavor in toolsbeta, but they still are bad for etcd.

For comparison, this is the same test run on cloudvirt1020:

fsync/fdatasync/sync_file_range:
    sync (usec): min=109, max=1457, avg=288.97, stdev=138.49
    sync percentiles (usec):
     |  1.00th=[  117],  5.00th=[  123], 10.00th=[  127], 20.00th=[  133],
     | 30.00th=[  147], 40.00th=[  167], 50.00th=[  363], 60.00th=[  371],
     | 70.00th=[  383], 80.00th=[  400], 90.00th=[  453], 95.00th=[  490],
     | 99.00th=[  529], 99.50th=[  553], 99.90th=[  848], 99.95th=[  914],
     | 99.99th=[ 1090]

Half a ms is the 99th percentile. I don't seem to have a buster VM that uses local disk to check, but I suspect fsync/fdatasync would be more like this. This whole issue here is why etcd sucks right now (and our control plane pods do restart loops and fail a lot), I believe.

Mentioned in SAL (#wikimedia-cloud) [2020-12-14T19:25:17Z] <bstorm> created temporary instance toolsbeta-io-test-local T267966

Mentioned in SAL (#wikimedia-cloud) [2020-12-14T19:27:06Z] <bstorm> create temporary instance toolsbeta-test-io-unthrottled T267966

The localstore VM was not successfully launched because running local storage VMs is going to take more than a new flavor at this point.
That said, I was able to compile fio from the source so that we got the fsync info from it on Stretch so that I could run it on clouddb1002, which still uses local disk. here is what I got:

fsync/fdatasync/sync_file_range:
  sync (usec): min=458, max=9274, avg=1136.92, stdev=920.22
  sync percentiles (usec):
   |  1.00th=[  562],  5.00th=[  627], 10.00th=[  660], 20.00th=[  709],
   | 30.00th=[  734], 40.00th=[  758], 50.00th=[  783], 60.00th=[  807],
   | 70.00th=[  840], 80.00th=[  898], 90.00th=[ 2966], 95.00th=[ 3490],
   | 99.00th=[ 4178], 99.50th=[ 4359], 99.90th=[ 4686], 99.95th=[ 5604],
   | 99.99th=[ 9241]

That is significantly slower than running on the hypervisor, but it is much less than 10ms. Ultimately, plenty good enough for etcd.

Unthrottled on an entirely unused VM:

fsync/fdatasync/sync_file_range:
  sync (usec): min=1581, max=423374, avg=5276.16, stdev=7451.78
  sync percentiles (msec):
   |  1.00th=[    3],  5.00th=[    3], 10.00th=[    3], 20.00th=[    3],
   | 30.00th=[    4], 40.00th=[    4], 50.00th=[    6], 60.00th=[    6],
   | 70.00th=[    7], 80.00th=[    7], 90.00th=[    7], 95.00th=[    8],
   | 99.00th=[   15], 99.50th=[   18], 99.90th=[  101], 99.95th=[  190],
   | 99.99th=[  213]

It is still 5ms too slow for etcd recommendations.

Mentioned in SAL (#wikimedia-cloud) [2020-12-17T12:15:23Z] <arturo> created VM tools-k8s-etcd-7 (T267966)

Mentioned in SAL (#wikimedia-cloud) [2020-12-17T12:16:05Z] <arturo> created VM tools-k8s-etcd-8 (T267966)

Mentioned in SAL (#wikimedia-cloud) [2020-12-17T12:54:53Z] <arturo> joining new etcd nodes in the k8s etcd cluster (T267966)

After adding more nodes, the failure rate is still high in the etcd side:

image.png (795×1 px, 101 KB)

The server fails to serve about 20% of the requests:

image.png (879×1 px, 179 KB)

I wonder how is k8s even working.

Mentioned in SAL (#wikimedia-cloud) [2020-12-17T14:12:16Z] <arturo> updated kube-apiserver manifest with new etcd nodes (T267966)

Mentioned in SAL (#wikimedia-cloud) [2020-12-17T14:15:03Z] <arturo> regenerating puppet cert with proper alt names in tools-k8s-etcd-8 (T267966)

Mentioned in SAL (#wikimedia-cloud) [2020-12-17T14:17:09Z] <arturo> regenerating puppet cert with proper alt names in tools-k8s-etcd-7 (T267966)

Mentioned in SAL (#wikimedia-cloud) [2020-12-17T14:18:58Z] <arturo> regenerating puppet cert with proper alt names in tools-k8s-etcd-6 (T267966)

Mentioned in SAL (#wikimedia-cloud) [2020-12-17T14:21:53Z] <arturo> regenerating puppet cert with proper alt names in tools-k8s-etcd-5 (T267966)

Mentioned in SAL (#wikimedia-cloud) [2020-12-17T14:23:22Z] <arturo> regenerating puppet cert with proper alt names in tools-k8s-etcd-4 (T267966)

@aborrero k8s is not working well. It was doing some of this ealier, but it has become worse right around when the latency increased.

People are noticing etcd errors (as is the PAWS hub which uses a different etcd version)

Mentioned in SAL (#wikimedia-cloud) [2020-12-17T18:58:28Z] <bstorm> disabling puppet on k8s-etcd servers to alter the timeouts T267966

Mentioned in SAL (#wikimedia-cloud) [2020-12-17T19:44:06Z] <bstorm> set etcd timeouts seed value to 20 instead of the default 10 (profile::wmcs::kubeadm::etcd_latency_ms) T267966

Mentioned in SAL (#wikimedia-cloud) [2020-12-17T19:56:18Z] <bstorm> puppet enabled one at a time, letting things catch up. Timeouts are now adjusted to something closer to fsync values T267966

For reference, types of errors we are still getting:

Dec 17 19:50:44 tools-k8s-etcd-6 etcd[31172]: sync duration of 2.072381634s, expected less than 1s
Dec 17 19:53:14 tools-k8s-etcd-7 etcd[13461]: sync duration of 1.463091527s, expected less than 1s

and

Dec 17 20:02:19 tools-k8s-etcd-8 etcd[13411]: failed to send out heartbeat on time (exceeded the 200ms timeout for 1.589821672s)
Dec 17 20:02:19 tools-k8s-etcd-8 etcd[13411]: server is likely overloaded

I think I need to increase that value from 20 (which becomes that 200ms timeout). To be 1.5s, that value would need to be 150 :(
A timeout requires catchup later, which would tend to increase IO when it does. The fun thing is that tuning this parameter will tend to make the overall etcd cluster slower, but that can slow down errors and election thrashing.

There is another value that may have a large impact, especially with regard to the humps in the fsync graph: https://gerrit.wikimedia.org/r/c/operations/puppet/+/648354 It fails CI because of a test that my change has nothing to do with.

Over time fsync humps are coming back, but with less regularity, funnier shapes and lower peaks. So that's progress.

Screen Shot 2020-12-17 at 1.10.14 PM.png (1×2 px, 269 KB)

Everything seems to just be balancing out to just as bad over time in most cases, which is fun.

Mentioned in SAL (#wikimedia-cloud) [2020-12-17T21:42:16Z] <bstorm> doing the same procedure to increase the timeouts more T267966

Bstorm renamed this task from Add more k8s-etcd nodes to the cluster on tools project to Add more k8s-etcd nodes to the cluster on tools project (and investigate performance issues).Dec 17 2020, 10:58 PM
Bstorm updated the task description. (Show Details)

Change 650280 had a related patch set uploaded (by Bstorm; owner: Bstorm):
[operations/puppet@production] kubeadm and paws: tuning options for stacked control plane

https://gerrit.wikimedia.org/r/650280

For the record, in case it wasn't picked up by others, the way this looks on k8s is:

kube-scheduler-tools-k8s-control-1            1/1     Running   237        7d6h
kube-scheduler-tools-k8s-control-2            1/1     Running   253        7d6h
kube-scheduler-tools-k8s-control-3            1/1     Running   243        7d5h

where 237, 235 and 243 are restarts of the pods because they crashed, almost always apparently in response to etcd issues
The same is true of the kube-controller-manager.

I still get:

bstorm@tools-sgebastion-08:~$ kubectl get pods -n kube-system
Error from server: etcdserver: request timed out

periodically. It is debatable whether or not tuning the timeouts is helping much. At very least, etcd seems to believe it is healthier...even if it isn't entirely.

iowait on the tools etcd servers hovers between 6 and 24 😞

Change 650470 had a related patch set uploaded (by Arturo Borrero Gonzalez; owner: Arturo Borrero Gonzalez):
[operations/puppet@production] kubeadm: etcd: introduce systemd-based higher priority scheduling policy

https://gerrit.wikimedia.org/r/650470

So! Increasing the pgs in ceph seems to have basicallly solved the problem, though tuning etcd was a good stopgap I think. I don't regret having the tuning knobs available for us to work with (and it makes sense to continue to merge some of the ones in flight). I'm going to decrease some of the timeout expectations on the tools-k8s-etcd cluster a little. I won't revert all that to the defaults until we've seen this all keep behaving for a little while.

Mentioned in SAL (#wikimedia-cloud) [2020-12-18T18:37:09Z] <bstorm> set profile::wmcs::kubeadm::etcd_latency_ms: 15 T267966

After setting to 15, I did start to see too many elections getting triggered. I set it to 20, and everything seem perfectly happy with it in tools.

So! Increasing the pgs in ceph seems to have basicallly solved the problem, though tuning etcd was a good stopgap I think. I don't regret having the tuning knobs available for us to work with (and it makes sense to continue to merge some of the ones in flight). I'm going to decrease some of the timeout expectations on the tools-k8s-etcd cluster a little. I won't revert all that to the defaults until we've seen this all keep behaving for a little while.

I'm not sure that the PGs was the main cause of the improvements, looking back at the graphs the times coincide strongly with the deletion of >1k snapshots of a same image (eqiad1-glance-images/fc6fb78b-4515-4dcc-8254-591b9fe01762) that had been accumulated:

20201218_20h57m01s_grim.png (974×1 px, 232 KB)

https://grafana-labs.wikimedia.org/dashboard/snapshot/5sAaNv25dC13Wm48erP2mtd2sBceVMHX?orgId=1&from=1608236471682&to=1608322871682

I've added a couple mark for the event on the above graph (not sure how to export with the notes xd). The crest is when the PG shuffling started and finished, but in-between you can see a drop on the spikes, that's right when the snapshots where purged, and after the shuffling the spikes don't come back.

It's going to be hard to know for sure, but it's worth keeping an eye on the amount of snapshots per-image.

Change 648354 merged by Bstorm:
[operations/puppet@production] etcd: make snapshot interval configurable

https://gerrit.wikimedia.org/r/648354

Change 650280 merged by Bstorm:
[operations/puppet@production] kubeadm and paws: tuning options for stacked control plane

https://gerrit.wikimedia.org/r/650280

Change 651247 had a related patch set uploaded (by Bstorm; owner: Bstorm):
[operations/puppet@production] kubeadm: correct spacing on the stacked control plane options

https://gerrit.wikimedia.org/r/651247

Change 651247 merged by Bstorm:
[operations/puppet@production] kubeadm: correct spacing on the stacked control plane options

https://gerrit.wikimedia.org/r/651247

Mentioned in SAL (#wikimedia-cloud) [2020-12-21T20:27:27Z] <bstorm> applied tuning for timeouts and elections on the k8s etcd pods of 300 for heartbeat and 3000 for elections T267966

Change 650470 abandoned by Arturo Borrero Gonzalez:
[operations/puppet@production] kubeadm: etcd: introduce systemd-based higher priority scheduling policy

Reason:
no longer required, see comments.

https://gerrit.wikimedia.org/r/650470

With T270305 done, it is clear that performance and consistency is much improved. Also the tuning params for etcd seems to have helped all clusters.

Screen Shot 2021-01-04 at 10.48.34 AM.png (1×2 px, 307 KB)

The spikes that are really high are when additional ceph tuning was applied (changing pgs).
The aggregate error rates are good (less than 2%), but when you take smaller time periods like 1 hour, the error rate panel shows up around 10-20% occasionally, which means there are still clusters of errors.

Despite the improvements, I still see:

Jan  4 00:00:49 tools-k8s-etcd-4 etcd[19302]: failed to send out heartbeat on time (exceeded the 200ms timeout for 47.26634ms)
Jan  4 00:00:49 tools-k8s-etcd-4 etcd[19302]: server is likely overloaded
Jan  4 00:00:49 tools-k8s-etcd-4 etcd[19302]: failed to send out heartbeat on time (exceeded the 200ms timeout for 51.242132ms)
Jan  4 00:00:49 tools-k8s-etcd-4 etcd[19302]: server is likely overloaded
Jan  4 00:00:49 tools-k8s-etcd-4 etcd[19302]: failed to send out heartbeat on time (exceeded the 200ms timeout for 52.191519ms)
Jan  4 00:00:49 tools-k8s-etcd-4 etcd[19302]: server is likely overloaded
Jan  4 00:00:49 tools-k8s-etcd-4 etcd[19302]: failed to send out heartbeat on time (exceeded the 200ms timeout for 53.21628ms)
Jan  4 00:00:49 tools-k8s-etcd-4 etcd[19302]: server is likely overloaded

That suggests my timeouts need to increase again for these servers. I also would like to fiddle with the snapshot frequency.
I also just noticed that the firewall rules are blocking ssh probes from the prometheus server, which is not great but totally unrelated.

Mentioned in SAL (#wikimedia-cloud) [2021-01-05T18:49:20Z] <bstorm> changing the limits on k8s etcd nodes again, so disabling puppet on them T267966

setting

profile::wmcs::kubeadm::etcd_latency_ms: 30
profile::wmcs::kubeadm::etcd_snapshot_count: 100000

Since the logs often complain wondering if the network is slow, I just confirmed with iperf that the etcd nodes experience between 5 and 7 Gbps on their network interfaces. The network is fine. It's just disk that impacts these things. At this point, I think many metrics are pretty ok, but there are still errors and when a compaction cycle runs, iowait can climb as high as 90. Nearly all IO is writes. The write IOPS performance is well under the throttle applied. My test earlier on a fairly quiet server using local disk wasn't a heck of a lot better, which also makes our VM settings somehow suspect, but I have not found anything serious.

In case I or anyone else wants to take the avenue of poking at the way the VMs interact with storage of any kind, the clouddb1001-4 VMs are all still on local storage. 1002 and 1004 are both replicas, so less harm is done if you mistakenly flood the network or something on them.

Bstorm renamed this task from Add more k8s-etcd nodes to the cluster on tools project (and investigate performance issues) to Try to squeeze better performance out of k8s-etcd nodes.Apr 8 2021, 10:16 PM
Bstorm updated the task description. (Show Details)

We can upgrade etcd by getting new packages deployed (or deploying via container), but that is highly unlikely to resolve a storage issue. We need to test these running on local storage.

@Andrew is the best bet for doing so a custom flavor attached to a host aggregate? We'd need at least two hypervisors capable of running VMs like this. Is that an all-or-nothing matter or can a hypervisor manage ceph and local disks at the same time? During the rollout, I recall the answer was "no", but I don't know if that still is true.

Actually, that's weird enough that it should be a subtask.

Bstorm claimed this task.

I think that did it.