I’ve received several user reports of occasional HTTP 502 Bad Gateway errors in my tools (at least Wikidata Lexeme Forms and SpeedPatrolling). I can’t find any corresponding errors in the ~/uwsgi.log of those tools. It seems like T266506: Getting "502 Bad Gateway" on Toolforge tools in clusters, including tools ordia and scholia might be occurring again.
Description
Description
| Status | Subtype | Assigned | Task | ||
|---|---|---|---|---|---|
| Resolved | taavi | T282732 Occasional HTTP 502 Bad Gateway errors for several Toolforge tools | |||
| Restricted Task |
Event Timeline
Comment Actions
The user reports were on Monday 2021-05-10 (around 15:00 UTC), Tuesday 2021-05-10 (also around 15:00 UTC, but unclear how precise), and Wednesday 2021-05-12 (reported 9:17 UTC but also unclear how precise).
Comment Actions
Likely a duplicate of T267966: Try to squeeze better performance out of k8s-etcd nodes if this is the same thing that was seen in T266506: Getting "502 Bad Gateway" on Toolforge tools in clusters, including tools ordia and scholia.
Comment Actions
This is happening to me frequently, I get batches of 502s when using Lucas's Lexeme Forms tool multiple times a day. It happened just now (around 06:00 UTC) and according to chat history, I also mentioned it happening around 06:00 UTC, 12:00 UTC and 20:20 UTC yesterday and around 15:40 UTC on the 1st.
Comment Actions
I need to review the overall performance of etcd again, but we may be able to rule that piece out soon since we've largely removed most of the errors due to that. If that gets ruled out, we'll have some new places to look.
Comment Actions
So to determine if several changes we've made have at least stabilized parts of the cluster with the etcd and ingress upgrades, I'm recording the current restarts of the most affected control plane pods here:
kube-controller-manager-tools-k8s-control-1: 4841
kube-controller-manager-tools-k8s-control-2: 4755
kube-controller-manager-tools-k8s-control-3: 4882
kube-scheduler-tools-k8s-control-1: 4783
kube-scheduler-tools-k8s-control-2: 4765
kube-scheduler-tools-k8s-control-3: 4703
There's currently no way to reset those counters except via deleting the pods (which would potentially be disruptive). I can come back and check tomorrow to see if they have stabilized. If they have, then we could have a totally unrelated issue somewhere!
Comment Actions
Looks like the pods are not constantly restarting anymore. Are we sure this is happening on the Kubernetes ingress layer and not on the front proxy?
Comment Actions
Not at this point! I was sure of it previously because I observed it happening, but 502 can come from different places. We may have solved one issue and found a new problem.
Comment Actions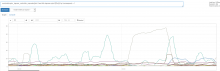
The tool going up and down repeatedly is csp-report, ifttt is the one with one large request volume chunk. So maybe that is related?
I think this is happening within Kubernetes ingress, as looking at Prometheus it doesn't think there have been any 502s for those tools (which pretty much rules out issues with tool-specific uwsgi workers running out etc).
I took a look at the front proxy's nginx logs (it has prometheus metrics, but they are so generic they're not helpful at all in this case), and they indeed have errors such like "[error] 1046#1046: *698128916 upstream prematurely closed connection while reading response header from upstream" for a bunch of different tools. The logs also have a bunch of timeouts for the ifttt tool, which had a fair bunch of incoming requests about the same time as the 502s were logged:

The tool going up and down repeatedly is csp-report, ifttt is the one with one large request volume chunk. So maybe that is related?
Comment Actions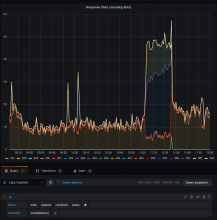
Yep, there was almost a 3x increase in requests, though is probably due to retries when failing that the cause of the failures:

Comment Actions
I'd consider this the panel of tools that "should" throw 502. https://grafana-labs.wikimedia.org/d/000000012/tools-basic-alerts?viewPanel=16&orgId=1&refresh=5m
Unfortunately, that needs cleanup because clearly the 1000+ tools haven't worked for a long time and should be shut down. The panel will be more useful when they are removed.
I wonder if a custom 502 error page on the k8s proxy would help here. If the front proxy will allow it to display, anyway (and I know several proxies would allow that), then if the 502 is not the custom page we know it never actually hit the front. Before I try that, though, I wonder if the Lua processor doesn't occasionally break down on the front proxy...going to just check that
Comment Actions
This is different from T257405 but broadly related: unexplained 502 errors that seem to be beyond the control of the tool authors.
Comment Actions
Sorry for the delay here. I've yesterday deployed a few changes which should significantly help with this situation. Is anyone still seeing these 'random' 502 errors?
Comment Actions
I'm closing this, with the hopes that all of my changes in the last year or two have improved the situation. Please open nwe tasks for new issues you're seeing.