Page MenuHomePhabricator

Getting "502 Bad Gateway" on Toolforge tools in clusters, including tools ordia and scholia
Closed, DuplicatePublicBUG REPORT

Description

Steps to Reproduce:

Go to https://ordia.toolforge.org/ or https://scholia.toolforge.org and possibly others.

Actual Results:

Sometimes get "502 Bad Gateway nginx/1.14.2".

Nothing relevant in uwsgi.log

The error seems to come in clusters. Perhaps it is related to load.

Expected Results:

The page should always get a proper response.

You can see that this is an systemic problem (though not a complete blackout when it happens) based on this graph:

Screen Shot 2020-10-29 at 2.20.08 PM.png (1×1 px, 292 KB)

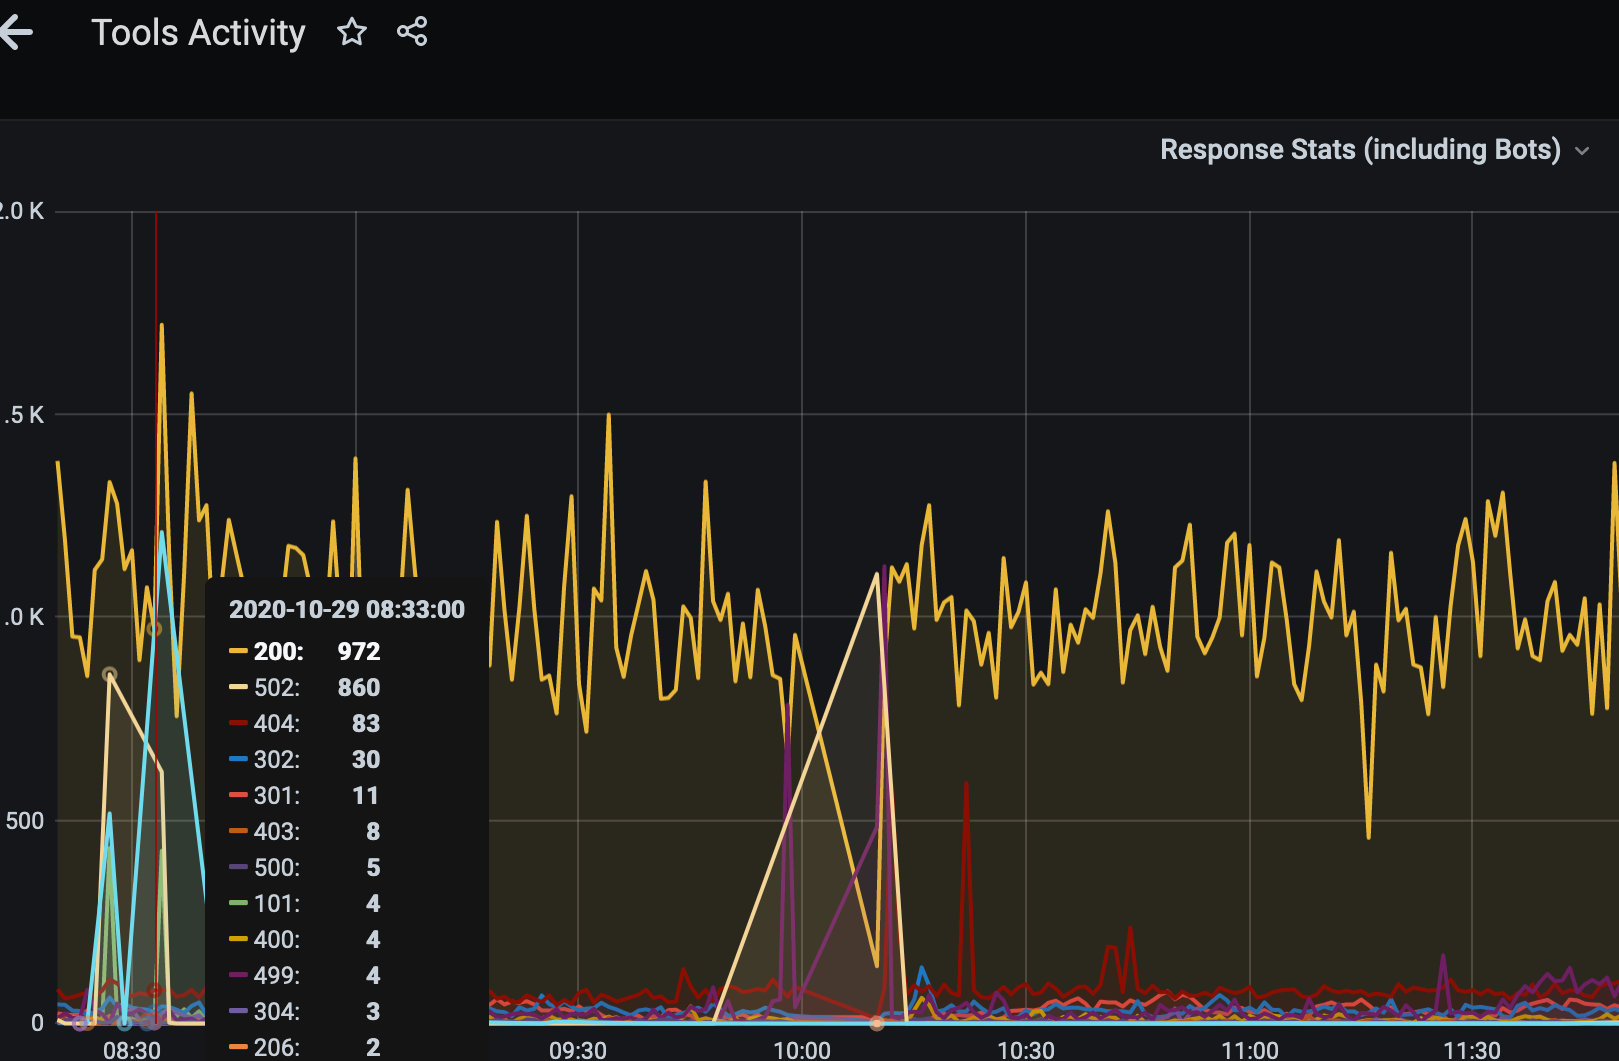
The second peak in that graph was an unrelated problem. The one with the tooltip describes the condition nicely. Lots of requests briefly get a 502 return status in a clump.

Event Timeline

Scholia and Ordia seem to not give me 502s but it's also happening with IABot

The 502 error from the Nginx front proxy indicates a failure of the front proxy to successfully connect to the upstream application running as the tool inside Toolforge. There are a variety of reasons this could happen intermittently, but possibly the most likely during October 2020 would be the webservice process being evicted from the host it was running on due to instances migrating to Ceph storage.

As reported this is not easily debugged as there are no timestamps given that might be used to check the nginx front proxy's logs or to correlate with other system level events.

Mentioned in SAL (#wikimedia-cloud) [2020-10-26T20:37:08Z] <wm-bot> <root> Hard stop/start of webservice to recreate ingress and service objects in Kubernetes (T266506)

Mentioned in SAL (#wikimedia-cloud) [2020-10-26T20:37:08Z] <wm-bot> <root> Hard stop/start of webservice to recreate ingress and service objects in Kubernetes (T266506)

I noticed when looking at the Kubernetes namespace for the ordia tool that the ingress objects (rules which tell Kubernetes how to get traffic into the tool's running uwsgi python process) were 236 days old. On the off chance that we have fixed something in the ingress object configuration in newer releases of webservice, I did a webservice stop && webservice start to recreate all of the Kubernetes configuration for the tool. Before I did this I also created a $HOME/service.template file so that starting the tool is easier.

I did get 502/504 errors for codesearch a bit earlier (UTC 19:10-ish). It stopped after a while. No idea if it was related.

I did get 502/504 errors for codesearch a bit earlier (UTC 19:10-ish). It stopped after a while. No idea if it was related.

Codesearch is using a different proxy because it is a Cloud VPS project and not a Toolforge tool.

It may have been related to [2020-10-26T20:37:08Z]. I will take a note on the exact time if it happens next time. I wonder if we should close this issue now?

At around 2020-10-27 13:38 UTC I got 502 Bad Gateway from the lexeme-forms tool

At around 2020-10-27 14:29 UTC I got 502 Bad Gateway on https://scholia.toolforge.org/

At around 2020-10-27 13:38 UTC I got 502 Bad Gateway from the lexeme-forms tool

Toolforge front proxy errors for lexeme-forms
$ grep lexeme error.log
2020/10/27 13:33:48 [error] 15416#15416: *193932524 upstream prematurely closed connection while reading response header from upstream, client: 81.173.143.27, server: , request: "GET /api/v1/match_template_to_lexeme/www/L12373 HTTP/2.0", upstream: "http://172.16.0.108:30000/api/v1/match_template_to_lexeme/www/L12373", host: "lexeme-forms.toolforge.org", referrer: "https://www.wikidata.org/"
2020/10/27 13:33:48 [error] 15416#15416: *193932524 upstream prematurely closed connection while reading response header from upstream, client: 81.173.143.27, server: , request: "GET /api/v1/match_template_to_lexeme/www/L8333 HTTP/2.0", upstream: "http://172.16.0.108:30000/api/v1/match_template_to_lexeme/www/L8333", host: "lexeme-forms.toolforge.org", referrer: "https://www.wikidata.org/"
2020/10/27 13:37:16 [error] 15417#15417: *193959510 upstream prematurely closed connection while reading response header from upstream, client: 94.145.0.202, server: , request: "GET /api/v1/template/ HTTP/2.0", upstream: "http://172.16.0.108:30000/api/v1/template/", host: "lexeme-forms.toolforge.org", referrer: "https://ordia.toolforge.org/search?language=da&q=topmejse"
2020/10/27 13:38:03 [error] 15417#15417: *193959026 upstream prematurely closed connection while reading response header from upstream, client: 94.145.0.202, server: , request: "GET /api/v1/duplicates/www/da/topmejse?template_name=danish-noun-common HTTP/2.0", upstream: "http://172.16.0.108:30000/api/v1/duplicates/www/da/topmejse?template_name=danish-noun-common", host: "lexeme-forms.toolforge.org", referrer: "https://lexeme-forms.toolforge.org/template/danish-noun-common/"
2020/10/27 13:51:53 [error] 15416#15416: *194047558 upstream prematurely closed connection while reading response header from upstream, client: 199.254.238.218, server: , request: "GET /api/v1/match_template_to_lexeme/www/L226734 HTTP/2.0", upstream: "http://172.16.0.108:30000/api/v1/match_template_to_lexeme/www/L226734", host: "lexeme-forms.toolforge.org", referrer: "https://www.wikidata.org/"
2020/10/27 13:53:28 [error] 15416#15416: *194049442 upstream prematurely closed connection while reading response header from upstream, client: 94.145.0.202, server: , request: "GET /template/danish-noun-common/?form_representation=halemejse HTTP/2.0", upstream: "http://172.16.0.108:30000/template/danish-noun-common/?form_representation=halemejse", host: "lexeme-forms.toolforge.org", referrer: "https://ordia.toolforge.org/search?language=da&q=halemejse"
2020/10/27 14:07:16 [error] 15416#15416: *194163838 upstream prematurely closed connection while reading response header from upstream, client: 81.173.143.27, server: , request: "GET /api/v1/match_template_to_lexeme/www/L221548 HTTP/2.0", upstream: "http://172.16.0.108:30000/api/v1/match_template_to_lexeme/www/L221548", host: "lexeme-forms.toolforge.org", referrer: "https://www.wikidata.org/"
2020/10/27 14:13:55 [error] 15416#15416: *194216803 upstream prematurely closed connection while reading response header from upstream, client: 81.173.143.27, server: , request: "GET /api/v1/match_template_to_lexeme/www/L8789 HTTP/2.0", upstream: "http://172.16.0.108:30000/api/v1/match_template_to_lexeme/www/L8789", host: "lexeme-forms.toolforge.org", referrer: "https://www.wikidata.org/"
2020/10/27 14:13:55 [error] 15416#15416: *194216803 upstream prematurely closed connection while reading response header from upstream, client: 81.173.143.27, server: , request: "GET /api/v1/match_template_to_lexeme/www/L8791 HTTP/2.0", upstream: "http://172.16.0.108:30000/api/v1/match_template_to_lexeme/www/L8791", host: "lexeme-forms.toolforge.org", referrer: "https://www.wikidata.org/"
2020/10/27 14:15:27 [error] 15416#15416: *194216803 upstream prematurely closed connection while reading response header from upstream, client: 81.173.143.27, server: , request: "GET /api/v1/match_template_to_lexeme/www/L8789 HTTP/2.0", upstream: "http://172.16.0.108:30000/api/v1/match_template_to_lexeme/www/L8789", host: "lexeme-forms.toolforge.org", referrer: "https://www.wikidata.org/"
2020/10/27 14:20:34 [error] 15416#15416: *194216803 upstream prematurely closed connection while reading response header from upstream, client: 81.173.143.27, server: , request: "GET /api/v1/match_template_to_lexeme/www/L8789 HTTP/2.0", upstream: "http://172.16.0.108:30000/api/v1/match_template_to_lexeme/www/L8789", host: "lexeme-forms.toolforge.org", referrer: "https://www.wikidata.org/"
2020/10/27 14:34:31 [error] 15416#15416: *194330334 upstream prematurely closed connection while reading response header from upstream, client: 81.173.143.27, server: , request: "GET /api/v1/match_template_to_lexeme/www/L8801 HTTP/2.0", upstream: "http://172.16.0.108:30000/api/v1/match_template_to_lexeme/www/L8801", host: "lexeme-forms.toolforge.org", referrer: "https://www.wikidata.org/"
2020/10/27 14:34:33 [error] 15416#15416: *194330334 upstream prematurely closed connection while reading response header from upstream, client: 81.173.143.27, server: , request: "GET /api/v1/match_template_to_lexeme/www/L8885 HTTP/2.0", upstream: "http://172.16.0.108:30000/api/v1/match_template_to_lexeme/www/L8885", host: "lexeme-forms.toolforge.org", referrer: "https://www.wikidata.org/"
2020/10/27 14:57:58 [error] 15416#15416: *194483092 upstream prematurely closed connection while reading response header from upstream, client: 94.145.0.202, server: , request: "GET /api/v1/template/ HTTP/2.0", upstream: "http://172.16.0.108:30000/api/v1/template/", host: "lexeme-forms.toolforge.org", referrer: "https://ordia.toolforge.org/search?language=da&q=pungmejse"
2020/10/27 14:58:04 [error] 15416#15416: *194483092 upstream prematurely closed connection while reading response header from upstream, client: 94.145.0.202, server: , request: "GET /api/v1/template/ HTTP/2.0", upstream: "http://172.16.0.108:30000/api/v1/template/", host: "lexeme-forms.toolforge.org", referrer: "https://ordia.toolforge.org/search?language=da&q=sk%C3%A6gmejse"

The $HOME/uwsgi.log for lexeme-forms shows no successful http requests between 2020-10-27 12:38:37 and 2020-10-27 13:27:19.

I can't find any errors or unexpected events in the Kubernetes objects for the lexeme-forms since its last restart ~19 hours ago (before the time period in question).

At around 2020-10-27 14:29 UTC I got 502 Bad Gateway on https://scholia.toolforge.org/

There are 295 occurrences of "upstream prematurely closed connection while reading response header from upstream" in the front proxy error logs for the scholia tool between 2020-10-27 10:44:07 and 2020-10-27 15:43:44. I do see successful requests logged in the tool's $HOME/uwsgi.log around 2020-10-27 14:29. I also see some exceptions from scholia/rss.py attempting and failing to parse dates: "dateutil.parser._parser.ParserError: String does not contain a date:"

Aklapper renamed this task from Getting "502 Bad Gateway" on Toolforge tools to Getting "502 Bad Gateway" on Toolforge tools ordia and scholia.Oct 27 2020, 4:58 PM

I can't find anything interesting the Kubernetes shared ingress logs or the haproxy logs for 2020-10-27.

Looks like the ingress logs have rotated already. The only thing I can find is something about endpoints missing (which would normally mean a pod was down). I wonder if there are scheduled moves of k8s nodes that affected users.

I do not see any scheduled moves of k8s nodes today.

I was going on the working idea that this was related to the report I got on IRC from 1400 UTC today. However, I see the linked github issue is from yesterday. Yesterday, we migrated tools-k8s-ingress-1.tools.eqiad1.wikimedia.cloud to ceph, which may have confused some of the proxy layer for a bit. That suggests it could be avoided with more aggressive proxy-level failover settings if it is not indeed happening right now. It also suggests we really should make sure and enable logging on the haproxy layer (in subtask).

In an effort to determine if we need to scale up the ingress layer, I'm also looking at https://grafana-labs.wikimedia.org/d/R7BPaEbWk/toolforge-ingress?orgId=1&refresh=1m&from=now-24h&to=now

It doesn't seem definitively like we do need to yet from that at least.

Also useful https://grafana-labs.wikimedia.org/d/7fTGpvsWz/toolforge-vm-details?orgId=1&var-VM=tools-k8s-ingress-1
and
https://grafana-labs.wikimedia.org/d/7fTGpvsWz/toolforge-vm-details?orgId=1&var-VM=tools-k8s-ingress-2

It can be noted from these graphs that system load definitely jumps above where it should be for these two VMs at their current size. I'll check the haproxy settings around them (in case that was the root cause of 502 errors) and look into setting up more nodes since these are clearly not enough power for current load. I cannot find any reports of gridengine services going down (but I'll check that next).

I see a clump of 502 errors in the front proxy logs for scholia around 27/Oct/2020:15:30, which nicely discredits my theory about moving the ingress. There was also no significant load on the ingress servers at that time.

The only server that has a spike in load during that batch of 502s, in particular, is tools-k8s-haproxy-01. (this is presuming the issue was on a shared server rather than pod load).

One request is clearly an app issue:

[2020-10-27 15:14:04,551] ERROR in app: Exception on /topic/Q9715/latest-works/rss [GET]
Traceback (most recent call last):
  File "/data/project/scholia/www/python/venv/lib/python3.7/site-packages/flask/app.py", line 2446, in wsgi_app
    response = self.full_dispatch_request()
  File "/data/project/scholia/www/python/venv/lib/python3.7/site-packages/flask/app.py", line 1951, in full_dispatch_request
    rv = self.handle_user_exception(e)
  File "/data/project/scholia/www/python/venv/lib/python3.7/site-packages/flask/app.py", line 1820, in handle_user_exception
    reraise(exc_type, exc_value, tb)
  File "/data/project/scholia/www/python/venv/lib/python3.7/site-packages/flask/_compat.py", line 39, in reraise
    raise value
  File "/data/project/scholia/www/python/venv/lib/python3.7/site-packages/flask/app.py", line 1949, in full_dispatch_request
    rv = self.dispatch_request()
  File "/data/project/scholia/www/python/venv/lib/python3.7/site-packages/flask/app.py", line 1935, in dispatch_request
    return self.view_functions[rule.endpoint](**req.view_args)
  File "./scholia/app/views.py", line 1403, in show_topic_rss
    response_body = wb_get_topic_latest_works(q)
  File "./scholia/rss.py", line 401, in wb_get_topic_latest_works
    rss_body += entities_to_works_rss(data['results']['bindings'])
  File "./scholia/rss.py", line 227, in entities_to_works_rss
    item_date = parse_datetime(_value(entity, 'date'))
  File "/data/project/scholia/www/python/venv/lib/python3.7/site-packages/dateutil/parser/_parser.py", line 1374, in parse
    return DEFAULTPARSER.parse(timestr, **kwargs)
  File "/data/project/scholia/www/python/venv/lib/python3.7/site-packages/dateutil/parser/_parser.py", line 652, in parse
    raise ParserError("String does not contain a date: %s", timestr)
dateutil.parser._parser.ParserError: String does not contain a date:

That lines up with a single 502 error, which is interesting, but not incredibly helpful. More interesting is that I was able to isolate a 502 (at 15:29 today) triggered by an RSS feed crawler that does not show up in the uwsgi.log of scholia, meaning it probably never got there. That same request usually works fine.

It's frustrating that I cannot find anything that is recent enough that the ingress logs have them.

Thanks for the rss error. We will look into that https://github.com/fnielsen/scholia/issues/1224

Ordia and Scholia and @LucasWerkmeister's tool lexeme-forms are Python tools.

I am not sure that the rss error is the main cause of the 502. I believe I was getting it from the main page at https://scholia.toolforge.org

I have updated the code for Scholia, so the RSS error should no longer occur. I do still see the 502 occasionally.

Ok, I've finally found a way to isolate "events" that include a large cluster of 502 responses: https://grafana-labs.wikimedia.org/d/000000004/tools-activity?viewPanel=1&orgId=1&from=now-6h&to=now

With that, I should be able to pick out log times and try to find what exactly was happening.

I regret to say that I'm jumping on this too late for the last spike on that graph. I can see the front proxy logs of it, but I cannot get deeper than that. I'll have to wait for the next one. At very least, this shows the trend and that it is clearly happening at certain times. Outside of logs, I might be able to correlate with other metrics.

One thing that happened was that one of the two ingress controllers had a spike in load. That might be interesting because I also see that it has tc qdisc rules applied to egress because this is connected to NFS (which it does not need). I'm going to tinker a little at that end.

Mentioned in SAL (#wikimedia-cloud) [2020-10-28T21:58:15Z] <bstorm> set 'mount_nfs: false' on the tools-k8s-ingress prefix T266506

Mentioned in SAL (#wikimedia-cloud) [2020-10-28T22:10:27Z] <bstorm> launching tools-k8s-ingress-3 to try and get an NFS-free node T266506

Change 637072 had a related patch set uploaded (by Bstorm; owner: Bstorm):
[operations/puppet@production] toolforge-k8s: Let hiera set the replicas value for ingress controllers

https://gerrit.wikimedia.org/r/637072

Mentioned in SAL (#wikimedia-cloud) [2020-10-28T23:42:03Z] <bstorm> dramatically elevated the egress cap on tools-k8s-ingress nodes that were affected by the NFS settings T266506

Change 637072 merged by Bstorm:
[operations/puppet@production] toolforge-k8s: Let hiera set the replicas value for ingress controllers

https://gerrit.wikimedia.org/r/637072

The network event today prevented any logging from remaining on the ingress controllers. They are full of things from the network issue.

Mentioned in SAL (#wikimedia-cloud) [2020-10-29T21:10:13Z] <bstorm> Added another ingress node to k8s cluster in case the load spikes are the problem T266506

Changing this task around a bit. It is obvious that there are clusters of 502 errors that seem to primarily (or only) affect the Kubernetes cluster. That new ingress node might fix it, but this is likely affecting much more than these two tools based on the graphs.

Bstorm renamed this task from Getting "502 Bad Gateway" on Toolforge tools ordia and scholia to Getting "502 Bad Gateway" on Toolforge tools in clusters, including tools ordia and scholia.Oct 29 2020, 9:23 PM
Bstorm triaged this task as High priority.
Bstorm updated the task description. (Show Details)
Bstorm moved this task from Inbox to Doing on the cloud-services-team (Kanban) board.

Hopefully, we will not get another spike tomorrow of these and we can close this.

I see there was another spike of 502 responses at 1500 UTC today. 😦

I think I have something. Kubernetes API requests are needed to get endpoints for service objects behind the k8s ingress. I see them occasionally failing (though I cannot seem to catch one of the big spikes in the act so far).

I had thought load was an issue, but there's a rather persistent problem that does generate errors on the system:
k8s API requests are slow (like quite often 904.888158ms), and etcd requests occasionally time out. I see etcd servers in tools have very high iowait.

We should look into giving them more iops and possibly working on removing the NFS limits they acquired during a puppet enc outage.

I saw a bunch today at 2020-11-05 08:43:00 PST. It was a cluster of over 700. I wonder if there is something that runs in my early mornings that overwhelms our proxies. I need to try and catch it in the act tomorrow. It seems to happen just after 8am PST (while I'm usually in meetings).

Today's event was at 16:50 UTC. I was distracted with other things and the logs rotated again. Two things: 1. I'm setting an alarm for this tomorrow so I cannot miss it. and 2. I need to make the rotation configurable by cluster so I can keep ingress logs for longer if we need them.

I was online at the "right" times this weekend. The event never happened. I'll keep this open for a bit to try and catch it.

I also have now managed to be online when this would have happened and could find no actual record of it happening except in the dashboard. That makes me really wonder what the dashboard was recording. The front proxy had not logged a bunch of 502s.

There are 410 reported in the grafana dash today (during a spike at 17:29 UTC), but when I check, I can only find a handful that are all related to specific tools having issues. I'm aiming to improve k8s performance anyway with another task (T267966), but @Fnielsen is this still happening after the changes I've applied so far?

I might have found something. Just before the issue happened, prometheus reported the number of namespaces with >=1 pod dropped from 919 to 5 briefly. That suggests that prometheus suddenly didn't see any pods in *any* of the tool namespaces for a moment. That could be a metrics hiccup, but it might be significicant because the timing is not long before the bunch of 502s (that don't seem to appear in the proxy logs):

Screen Shot 2020-11-16 at 12.50.52 PM.png (1×1 px, 82 KB)

Looks like that might be related to some issues at least, if not this one.

E1116 17:18:43.995473       1 status.go:71] apiserver received an error that is not an metav1.Status: &errors.errorString{s:"context canceled"}
E1116 17:18:45.139471       1 status.go:71] apiserver received an error that is not an metav1.Status: rpctypes.EtcdError{code:0xe, desc:"etcdserver: request timed out"}

Definitely going to keep trying to improve the etcd server performance.

At this point, we have tasks for what I think is the root cause around the etcd performance. I'm going to close this.