Page MenuHomePhabricator

WS-Export: Analyze General Behavior After Reliability Improvements
Closed, ResolvedPublic3 Estimated Story Points

Description

Background: Once we have deployed all of our main reliability improvements, we will want to compare general performance of WS-Export to compare it against baseline data collected in T256018.

Acceptance Criteria:

  • Review data collected in T256018 to understand some of the baseline data
  • Then, collect information on the following:
    • Total number of ebook exports in the last 30 days, 60 days, and 90 days (logs are at https://wsexport.wmflabs.org/logs/ --> how can I easily access/analyze them?)
      • Provide breakdown by all file formats & main formats (you can can check out comments in T256018 for specific query)
    • Total number of WSExport connection timeouts in the past month, date of timeout, and duration of timeout (you can use T226136 as a model).
    • Current uptime stats for the last 24 hours, 30 days, 60 days, and 90 days
    • Stats of desktop vs mobile
      • we can look at OS info from user agents
      • Look at referers from wikis; the ones with ".m." in the URL are mobile:
    • Determine the number of the errors for the last 24 hours, 30 days, 60 days, and 90 days, if possible
      • You can use the baseline for epub errors script that Sam wrote (look at T256018)
        • Error counts from the last 14 days are in the T256018
  • Average generation time (and it would be useful to look into how the cache work may have changed things)
  • Note: If you think other data may be helpful to collect, please share with the team & we can also add it to the ticket.

Event Timeline

Restricted Application added a subscriber: Aklapper. ยท View Herald TranscriptFeb 5 2021, 9:55 PM
ifried updated the task description. (Show Details)
ifried set the point value for this task to 3.Mar 12 2021, 12:32 AM
ifried moved this task from Needs Discussion to Up Next on the Community-Tech board.

Logged exceptions

The error log goes back to 2021-02-18. Summary of errors from then to 2021-03-18 (1 month) is as follows:

samwilson@wsexport-prod01:/var/www/tool/var/log$ grep -P '^\[[0-9]{4}-' prod.log | grep -o '[A-Za-z]*Exception:' | sort | uniq -c| sort -nr
  29532 DriverException:
  12406 Exception:
   7999 ProcessFailedException:
   7624 ProcessTimedOutException:
   2588 RejectionException:
   1751 ServerException:
   1460 ConnectionException:
    240 ProcessSignaledException:
    169 FileNotFoundException:
    137 RuntimeException:
     10 NotFoundHttpException:
      4 ConnectException:
      1 RequestException:

Recent export counts by format

MariaDB [s52561__wsexport_p]> select `format`,
    ->   sum( if(`time` between date_sub(now(), interval 30 day) and now(), 1, 0) ) as 30day,
    ->   sum( if(`time` between date_sub(now(), interval 60 day) and now(), 1, 0) ) as 60day,
    ->   sum( if(`time` between date_sub(now(), interval 90 day) and now(), 1, 0) ) as 90day
    -> from books_generated
    -> group by `format`
    -> order by 30day desc, 60day desc, 90day desc;
+------------+--------+--------+--------+
| format     | 30day  | 60day  | 90day  |
+------------+--------+--------+--------+
| pdf-a4     | 320346 | 415723 | 431491 |
| epub-3     | 317646 | 379925 | 387173 |
| mobi       | 304984 | 369547 | 382092 |
| pdf        |  99506 | 114191 | 114194 |
| epub       |  81612 | 123232 | 149698 |
| pdf-a5     |  35557 |  95124 | 144382 |
| txt        |   6169 |  10257 |  12294 |
| rtf        |   2571 |   5035 |   6640 |
| htmlz      |    142 |    223 |    252 |
| pdf-letter |     57 |     92 |    107 |
| epub-2     |     39 |     66 |     97 |
| pdf-a6     |     26 |     49 |     61 |
| odt        |     12 |     22 |     39 |
| atom       |      0 |      0 |      3 |
| xhtml      |      0 |      0 |      0 |
+------------+--------+--------+--------+
15 rows in set (12.155 sec)

Generation times

select date, cast(median as int) from (select date(time) as `date`, median(duration) over (partition by `date`) AS `median` from books_generated where duration is not null) AS x group by date order by date ASC

(This can't be done on the prod DB because MEDIAN() is only available in MariaDB 10.3.3 and above.)

2021-01-14 	5
2021-01-15 	4
2021-01-16 	4
2021-01-17 	4
2021-01-18 	4
2021-01-19 	4
2021-01-20 	5
2021-01-21 	5
2021-01-22 	4
2021-01-23 	4
2021-01-24 	4
2021-01-25 	4
2021-01-26 	5
2021-01-27 	4
2021-01-28 	4
2021-01-29 	4
2021-01-30 	4
2021-01-31 	4
2021-02-01 	4
2021-02-02 	4
2021-02-03 	4
2021-02-04 	4
2021-02-05 	3
2021-02-06 	3
2021-02-07 	3
2021-02-08 	3
2021-02-09 	4
2021-02-10 	5
2021-02-11 	4
2021-02-12 	4
2021-02-13 	4
2021-02-14 	4
2021-02-15 	5
2021-02-16 	5
2021-02-17 	4
2021-02-18 	4
2021-02-19 	4
2021-02-20 	4
2021-02-21 	4
2021-02-22 	2
2021-02-23 	2
2021-02-24 	3
2021-02-25 	2
2021-02-26 	3
2021-02-27 	3
2021-02-28 	2
2021-03-01 	2
2021-03-02 	2
2021-03-03 	3
2021-03-04 	4
2021-03-05 	3
2021-03-06 	2
2021-03-07 	2
2021-03-08 	2
2021-03-09 	2
2021-03-10 	4
2021-03-11 	3
2021-03-12 	2
2021-03-13 	2
2021-03-14 	2
2021-03-15 	3
2021-03-16 	4
2021-03-17 	4

epubcheck errors

CSS-008 -- 10 -- CSS-008   ERROR    An error occurred while parsing the CSS: %1$s.
RSC-005 -- 47 -- RSC-005   ERROR    Error while parsing file: %1$s
OPF-053 --  7 -- OPF-053   WARNING  Date value "%1$s" does not follow recommended syntax
RSC-012 --  2 -- RSC-012   ERROR    Fragment identifier is not defined.

Generation times (distribution)

There are 1,528,304 data points.

SELECT count(duration), floor(duration/5)*5 as duration_bucket FROM `books_generated` where duration is not null group by duration_bucket

durations.png (355ร—1 px, 22 KB)

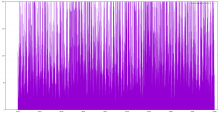
I thought there might be a pattern of reduced times after caching was enabled, but it's hard to see:

durations.png (988ร—1 px, 78 KB)

Plotted by exporting this year's logs to SVG (without fractional seconds) and the following gnuplot config:

# SELECT date_format(time, '%Y-%m-%d %H:%i:%s'), duration FROM `books_generated` WHERE duration is not null 

set xdata time
set timefmt "%Y-%m-%d %H:%M:%S"
set datafile separator ","
set xrange [ "2021-01-10" : "2021-03-19" ]
set yrange [ 0 : 200 ]
plot "books_generated.csv" using 1:2 with impulses

Up time stats

The UptimeRobot dashboard shows 99.876% timetime for the last 30 days, and 99.908% for the last 90 days.

The downtimes in the last 90 days were:

2021-03-12   Connection Timeout	     3 mins	
2021-03-11   Connection Timeout	     3 mins	
2021-03-09   Connection Timeout	     3 mins	
2021-03-07   Connection Timeout	     8 mins	
2021-03-03   Connection Timeout	     3 mins	
2021-03-02   Connection Timeout	     3 mins	
2021-03-01   Connection Timeout	    18 mins	
2021-02-23   Connection Timeout	     3 mins	
2021-02-18   Connection Timeout	     3 mins	
2021-01-27   Connection Timeout	     3 mins	
2021-01-22   Connection Timeout	     3 mins	
2021-01-18   Connection Timeout	     3 mins	
2021-01-16   Connection Timeout	     3 mins	
2021-01-15   Connection Timeout	     3 mins	
2021-01-14   Connection Timeout	     8 mins	
2021-01-14   Internal Server Error  10 mins	
2020-12-30   Connection Timeout	     3 mins	
2020-12-28   Connection Timeout	     8 mins	
2020-12-27   Connection Timeout	     8 mins	
2020-12-22   Connection Timeout	     3 mins	
2020-12-21   Connection Timeout	     3 mins	
2020-12-18   Connection Timeout	     3 mins

We have used the data in this ticket to work on communication with Wikisource communities, which will be published on Meta-wiki soon. For this reason, I'm marking this ticket as Done. We are also analyzing the meaning behind this data in greater depth in T278439. Further inquiries around the data can be directed to that ticket or to other tickets.