| Status | Subtype | Assigned | Task | ||
|---|---|---|---|---|---|
| Resolved | Joe | T252745 Sandbox/limit child processes within a container runtime | |||
| Resolved | tstarling | T260330 RFC: PHP microservice for containerized shell execution | |||
| Resolved | Legoktm | T281423 New Service Request Shellbox | |||
| Resolved | Legoktm | T286384 Benchmark Shellbox |
Event Timeline
The lilypond file I picked/generated is pretty simple:
\header {
	tagline = ##f
}
\version "2.18.2"
\language "nederlands"
\score {

\relative c' { f d f a }
\layout { }
	\midi {
		\context { \Score tempoWholesPerMinute = #(ly:make-moment 100 4) }
	}

}
\paper {
	indent = 0\mm
}
I started using ab to fire off requests with increasing concurrency, at c = 25 is when pyball depooled once othe k8s nodes so I paused it as I tweak.
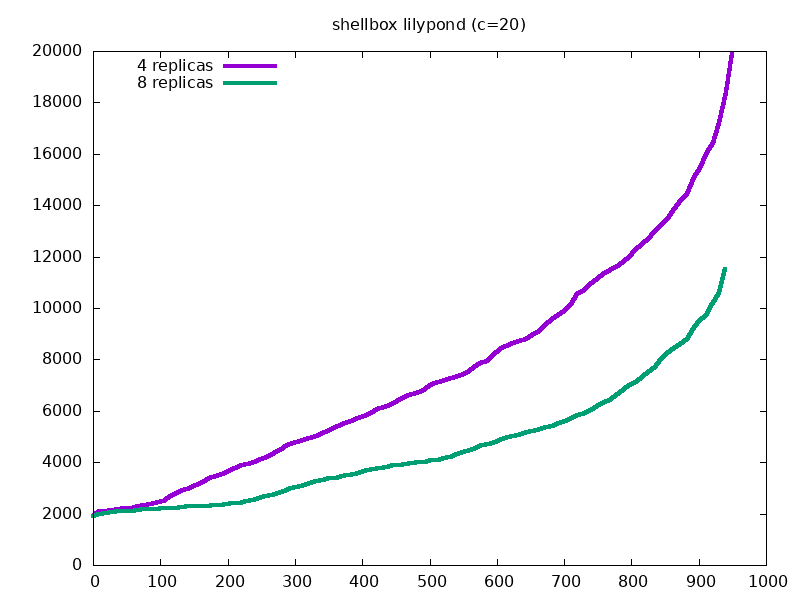
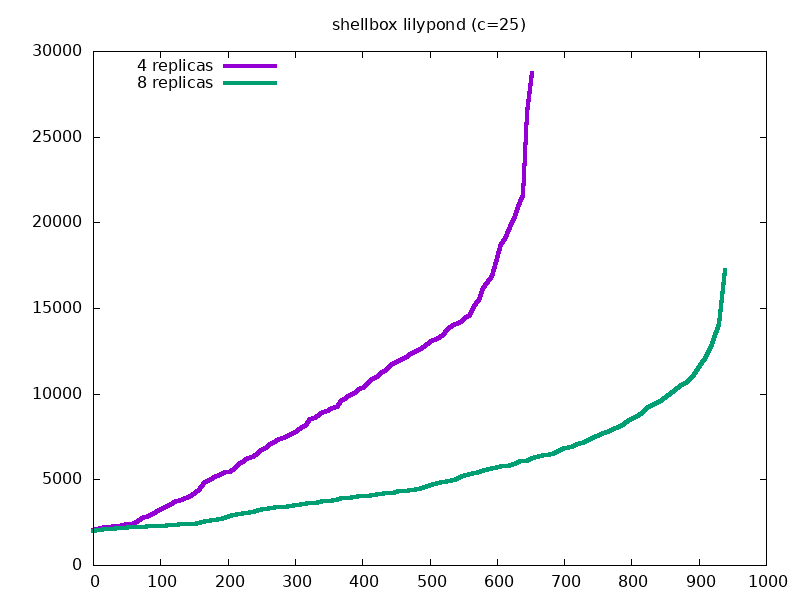
Shocking, more replicas increases concurrency.
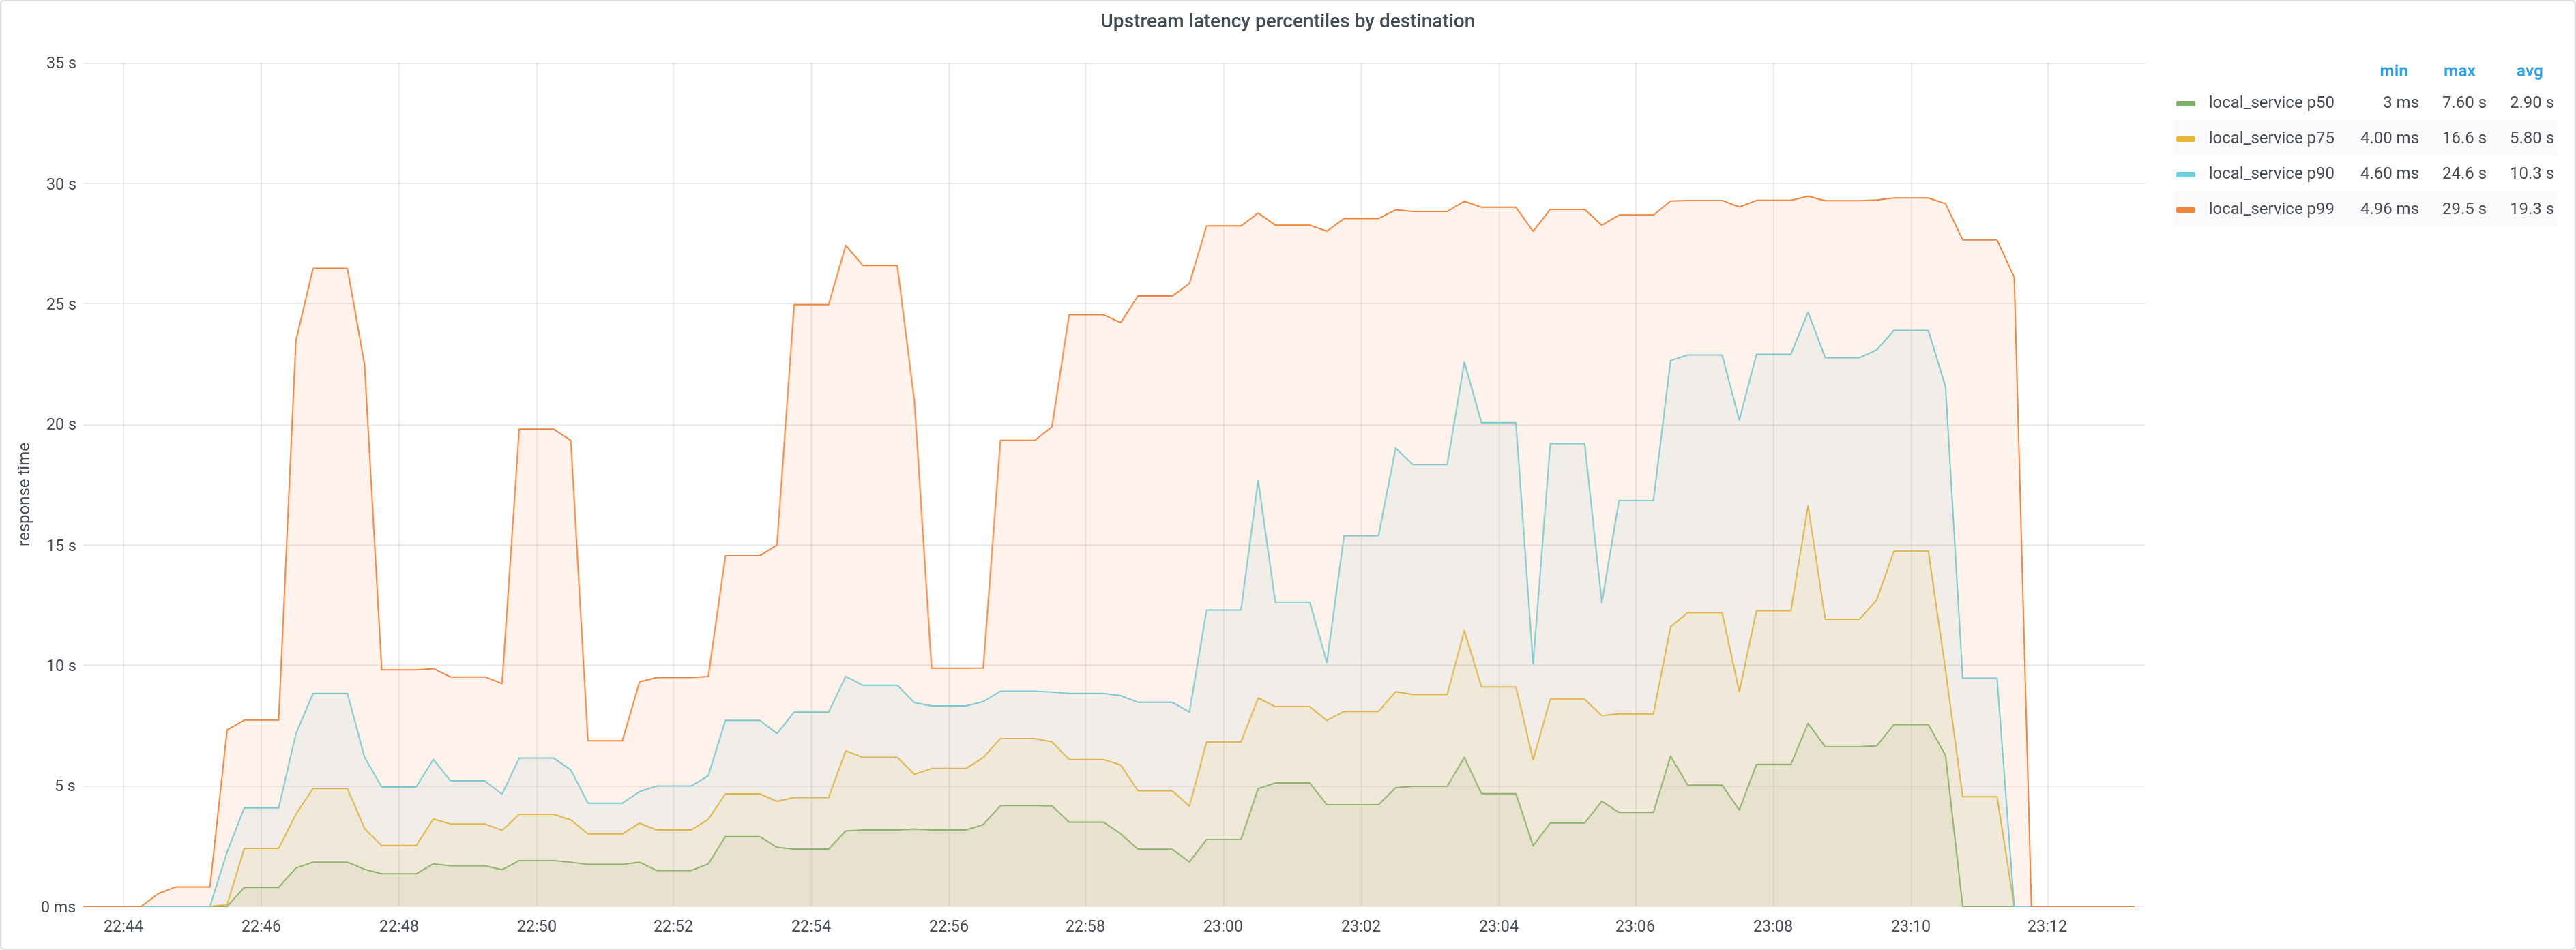
I need to set up a dashboard so I can monitor pod memory/CPU usage while benchmarking to see how beneficial it will be to increase that.
you can probably use https://grafana.wikimedia.org/d/U7JT--knk/joe-k8s-mwdebug?orgId=1&refresh=1m as a starting point.
thanks! Forked to https://grafana.wikimedia.org/d/RKogW1m7z/shellbox?orgId=1&refresh=1m&from=now-6h&to=now
Note that deployment="$namespace" didn't work for me, I had to switch it to kubernetes_namespace="$namespace"
I think we're mostly set with the current configuration. Benchmarking and real usage shows that for the most part Shellbox is sitting idle, but the current capacity is adequate to handle spikes when multiple pages with scores are edited/re-parsed in quick succession.