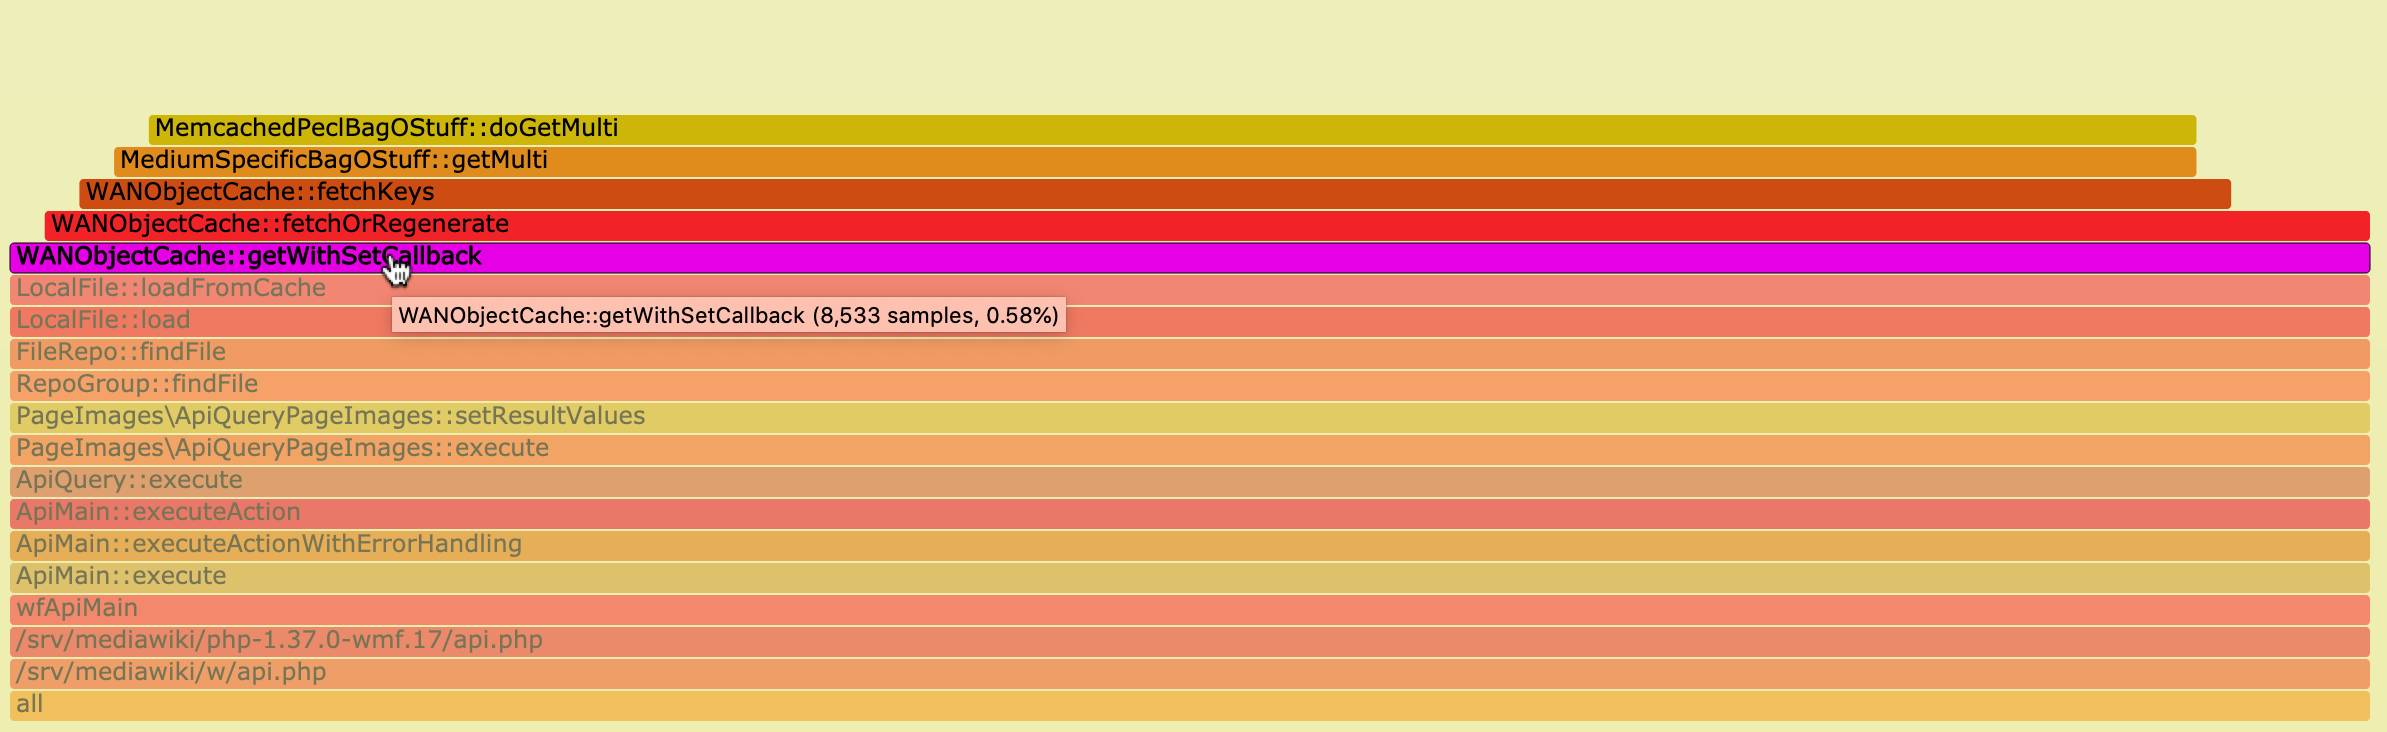
Excimer wall-time from a 24-hour period, for the most sampled code involving WANCache with a high cache-hit rate that
I could find in the flame graphs, namely api.php use of PageImages/LocalFile (link):
- PageImages/LocalFile/WANObjectCache::getWithSetCallback (8,533 samples)
- PageImages/LocalFile/WANObjectCache/…/MemcachedPeclBagOStuff::doGetMulti (7,485 samples)
That suggests about 12% of our "get" time is actually spent in PHP, figuring out what command to send to Memcached (1 - 7485/8533).
An anecdotal Tideways profile seems to hold up this estimate (link):
- WANObjectCache::fetchOrRegenerate (20 calls): 48.5ms
- WANObjectCache::fetchKeys (21 calls): 41.3ms
- MemcachedPeclBagOStuff::doGetMulti (22 calls): 42.5ms
The number of calls differ in Tideways because it only measures time in pairs of parent and child, so there was one fetchKeys call not from getWithSet, and one Memcached call not via WANObjectCache. But (1 - 41.3/48.5) arrives at 14% which we'd expect to be an under estimate since it includes one more call, so the actual overhead was higher in this particular profile.
Control flow outline: https://etherpad.wikimedia.org/p/3qfx5Dvvqg2Yafmxd5-q