As per task title, we should be upgrading to Grafana 9
Description
Description
Details
Details
Customize query in gerrit
| Status | Subtype | Assigned | Task | ||
|---|---|---|---|---|---|
| Resolved | colewhite | T317887 Upgrade to Grafana 9 | |||
| Open | Peter | T344961 "browsertime-alerts" and "webpagereplay" alerts: DatasourceNoData and DatasourceError silenced | |||
| Resolved | colewhite | T345362 DatasourceError grafana alerting error message database is locked | |||
| Resolved | colewhite | T345358 DatasourceError alerts emitted by jinxer are unhelpful | |||
| Open | None | T355241 Readers Web: DatasourceNoData unsilencing forthcoming | |||
| Open | Peter | T355238 Performance Team Alerts: DatasourceNoData unsilencing forthcoming |
Event Timeline
Comment Actions
Change 886860 had a related patch set uploaded (by Cwhite; author: Cwhite):
[operations/puppet@production] profile: disable grafana db sync ahead of 9.x upgrade
Comment Actions
For grafana-labs/cloud this is at least partially blocked on T307465: grafana-cloud: Browser access to Prometheus is deprecated.
Comment Actions
Change 886861 had a related patch set uploaded (by Cwhite; author: Cwhite):
[operations/debs/grafana-plugins@master] Upgrade plugins
Comment Actions
Change 886860 merged by Cwhite:
[operations/puppet@production] profile: disable grafana db sync ahead of 9.x upgrade
Comment Actions
Change 890849 had a related patch set uploaded (by Cwhite; author: Cwhite):
[operations/puppet@production] profile: Re-enable grafana db sync post 9.x upgrade
Comment Actions
Change 886861 merged by Cwhite:
[operations/debs/grafana-plugins@master] Upgrade plugins
Comment Actions
Mentioned in SAL (#wikimedia-operations) [2023-02-21T17:25:59Z] <cwhite> Grafana 9x upgrade in production complete T317887
Comment Actions
Change 890849 merged by Cwhite:
[operations/puppet@production] profile: Re-enable grafana db sync post 9.x upgrade
Comment Actions
Hi! I wonder if we need to do something on our side with the alerts in 9? We have a lot of fired alerts with "No data" but I can see that the data is there (or at least in the same interval as before), so I think there could a difference in how "No data" is handled between the last and the current version, do you know?
Comment Actions
Yeah, one example for verbosity:
[14:20:01] <jinxer-wm> (DatasourceNoData) resolved: (2) <no value> - https://alerts.wikimedia.org/?q=alertname%3DDatasourceNoData

Comment Actions

Yes, the difference is Grafana's new alerting engine has become the default. It can be rolled back, but the legacy alerting engine is expected to be removed in Grafana 10.
Looks like alerts must now be told what to do when encountering a "No Data" state. They've removed the "keep last state" option and default now to the no data state and fires an alert.
Spot checking a few panels, it looks to me like the alerts that have fired this way also have gaps in the data based on their evaluation rules or are not checking anything like an alert that has not been updated to reflect infrastructure changes.
To mitigate the noise in the short term, I've put in a silence (expires 2024-02) on alertname=(DatasourceNoData|DatasourceError).

Comment Actions
Adding for completeness, the update to 9.3.6 also addressed this 9.x-specific security issue (CVE-2023-22462)
https://github.com/grafana/grafana/security/advisories/GHSA-7rqg-hjwc-6mjf
8.x doesn't include the vulnerable code, so this never affected production.
Comment Actions
I think something else broke with the 9 upgrade with the alerts. I checked one alert and I think somehow the query got corrupted when we converted it:
That alert query seems to have been converted wrongly, and when the query is broken we get "no data". The query looks like this:
alias(diffSeries(movingAverage(frontend.navtiming2.firstPaint.mobile.anonymous.p75, '24h'), timeShift(movingAverage(frontend.navtiming2.firstPaint.mobile.anonymous.p75, '24h'), '7d'))
There's a miss-match with parentheses so the alias is broken. If fix that (remove the broken alias part) it works for me.
I'll fix that manually now and will go through the rest of our alerts during the day.
Comment Actions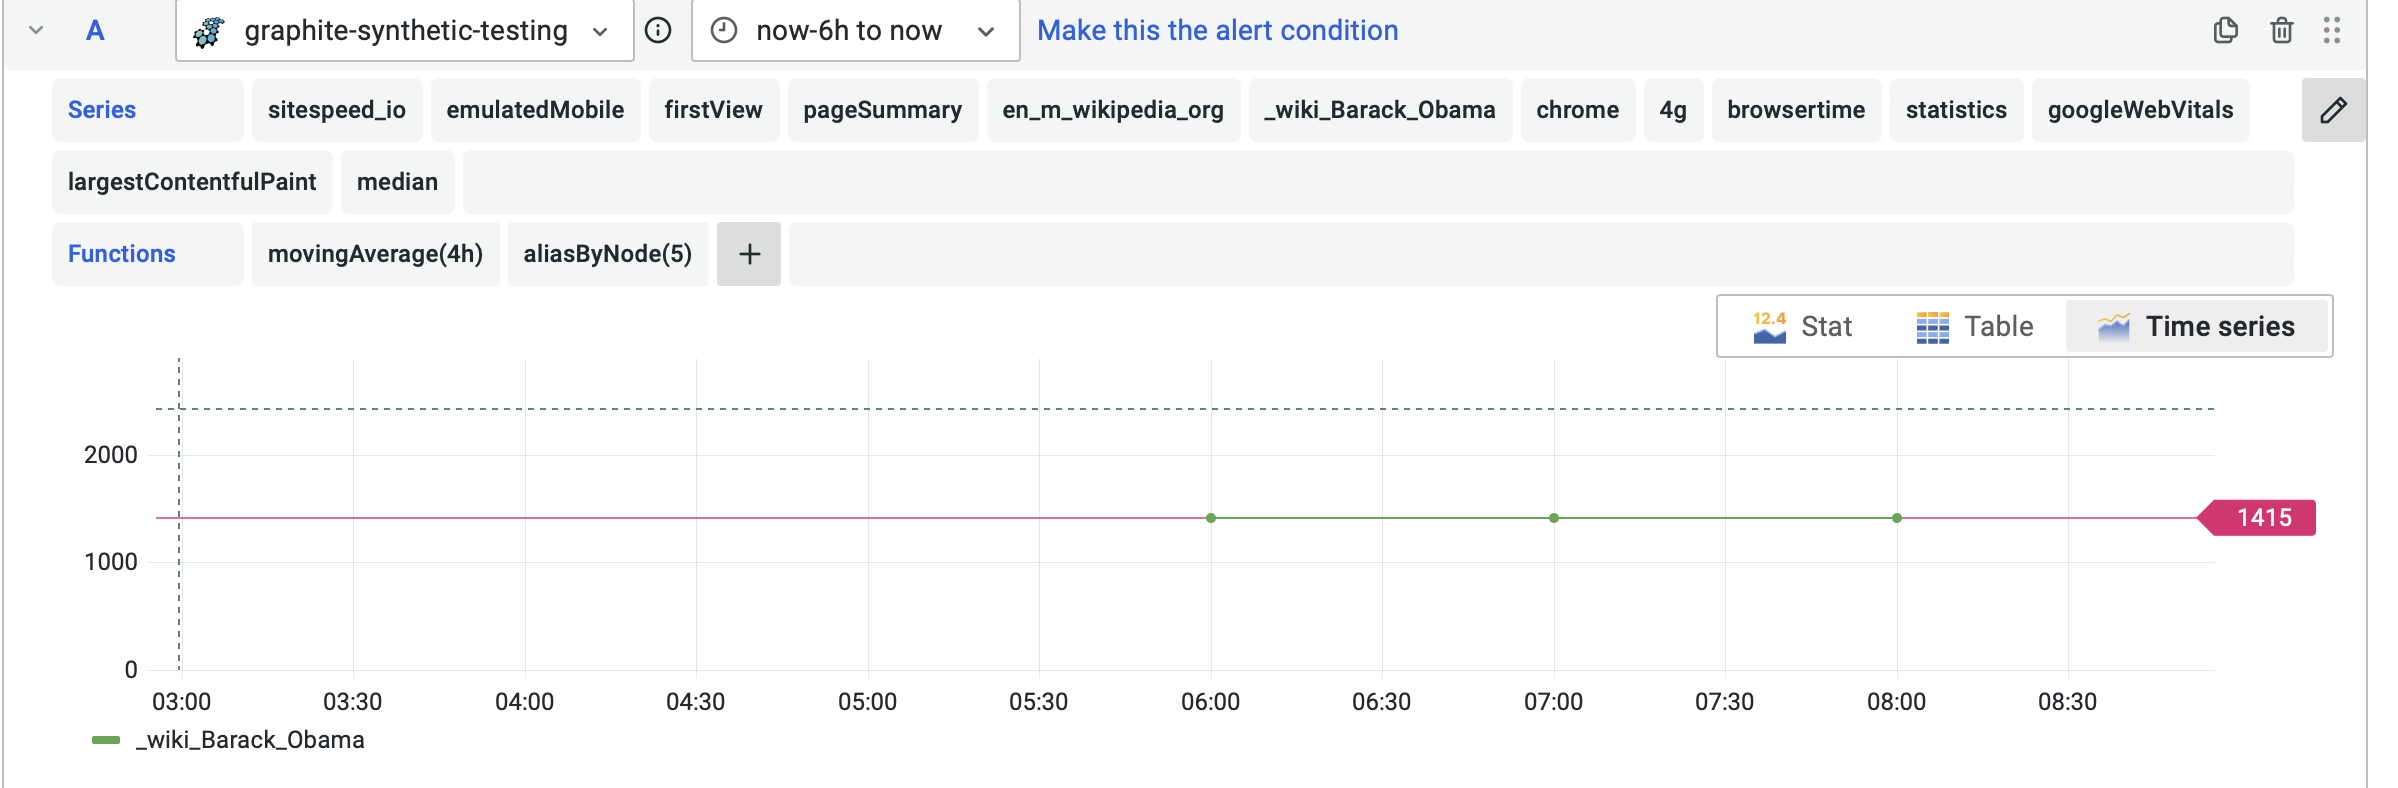

I also have problems with other alerts. There were to alerts in https://grafana-rw.wikimedia.org/d/000000318/browsertime-alerts that correctly fired because the limits where hit. I increased the limits and run the alert queries in the GUI clicking on the preview button:
There it looks correct, I can see that the query is correct and generate data and the status is "normal".
But I go back to the dashboard where the alert originally was created it shows "no data":
I want more time than how often it runs but it seems to be stuck in that "no data" mode.
Comment Actions
I've gone through all alerts on our side and made sure they do not fire (or at least I think I fixed them all), However all of them that fired are still stuck in the old state or "no data" state. However running the alerts preview I can see that they get data and are not firing.
Comment Actions
Hi @Peter!
We were serving grafana from codfw March 6-8th. I saw that silences had not copied from eqiad->codfw for some unknown reason. We are back to serving grafana from eqiad as of March 8th 1800 UTC.
You may want to double-check these changes and make sure they made it back to the eqiad grafana instance.
Comment Actions
Change 906537 had a related patch set uploaded (by Filippo Giunchedi; author: Filippo Giunchedi):
[operations/puppet@production] aptrepo: go with Grafana 9 only
Comment Actions
Change 906537 merged by Filippo Giunchedi:
[operations/puppet@production] aptrepo: go with Grafana 9 only
Comment Actions
Mentioned in SAL (#wikimedia-operations) [2023-04-06T12:50:43Z] <godog> import grafana 9.4 T317887
Comment Actions
Updating quarter milestone as there is one lingering task to complete: resolve the root cause of DatasourceNoData and DatasourceError alerts prior to silence expiring on 2024-02-01.
Comment Actions
Thanks for the reminder!
With the dust settled from the DatasourceError round, I think it's time to unsilence this as well. There are three valid alerts AFAICS.
Perf:
- Increased first visual change when searching on Obama at Google coming to Wikipedia on emulated mobile
- Increased first visual change when searching on Obama from the portal start page
Readers Web:
- Vector a11y Errors
These are missing data for a long time and probably either need to be removed or fixed.