Page MenuHomePhabricator

Investigation: Move GeoJSON blob to the bottom of the HTML
Closed, ResolvedPublic

Description

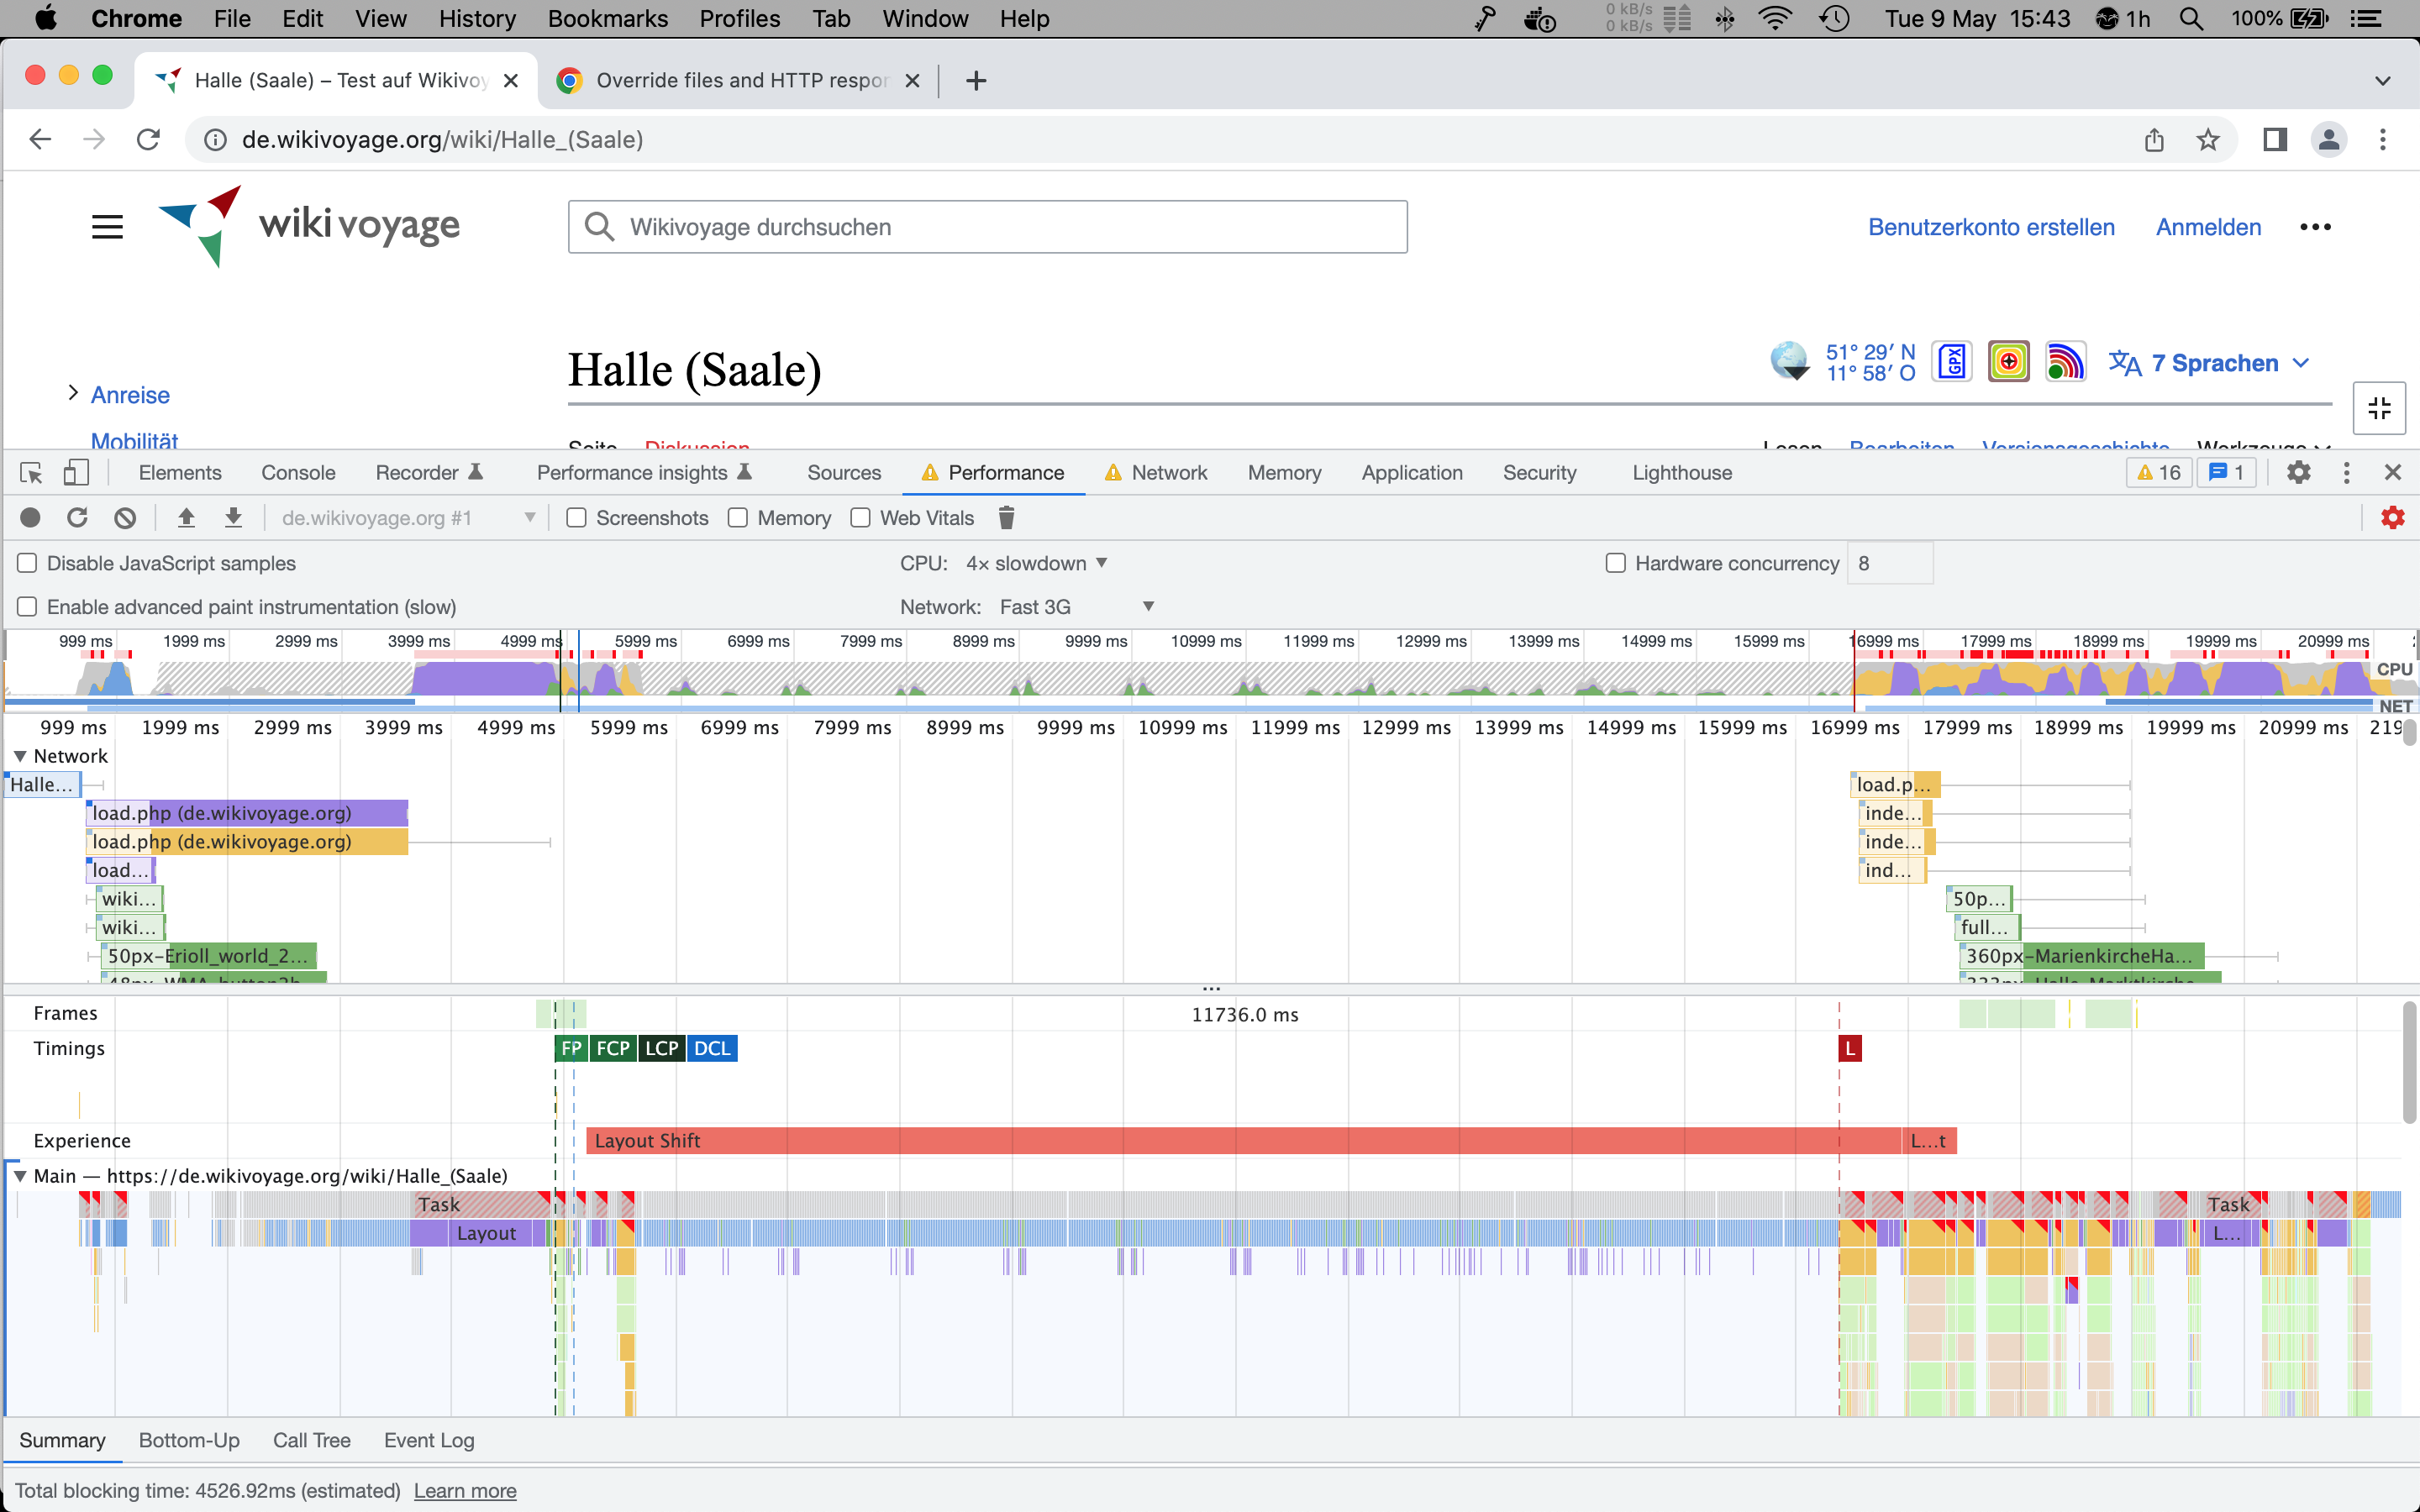
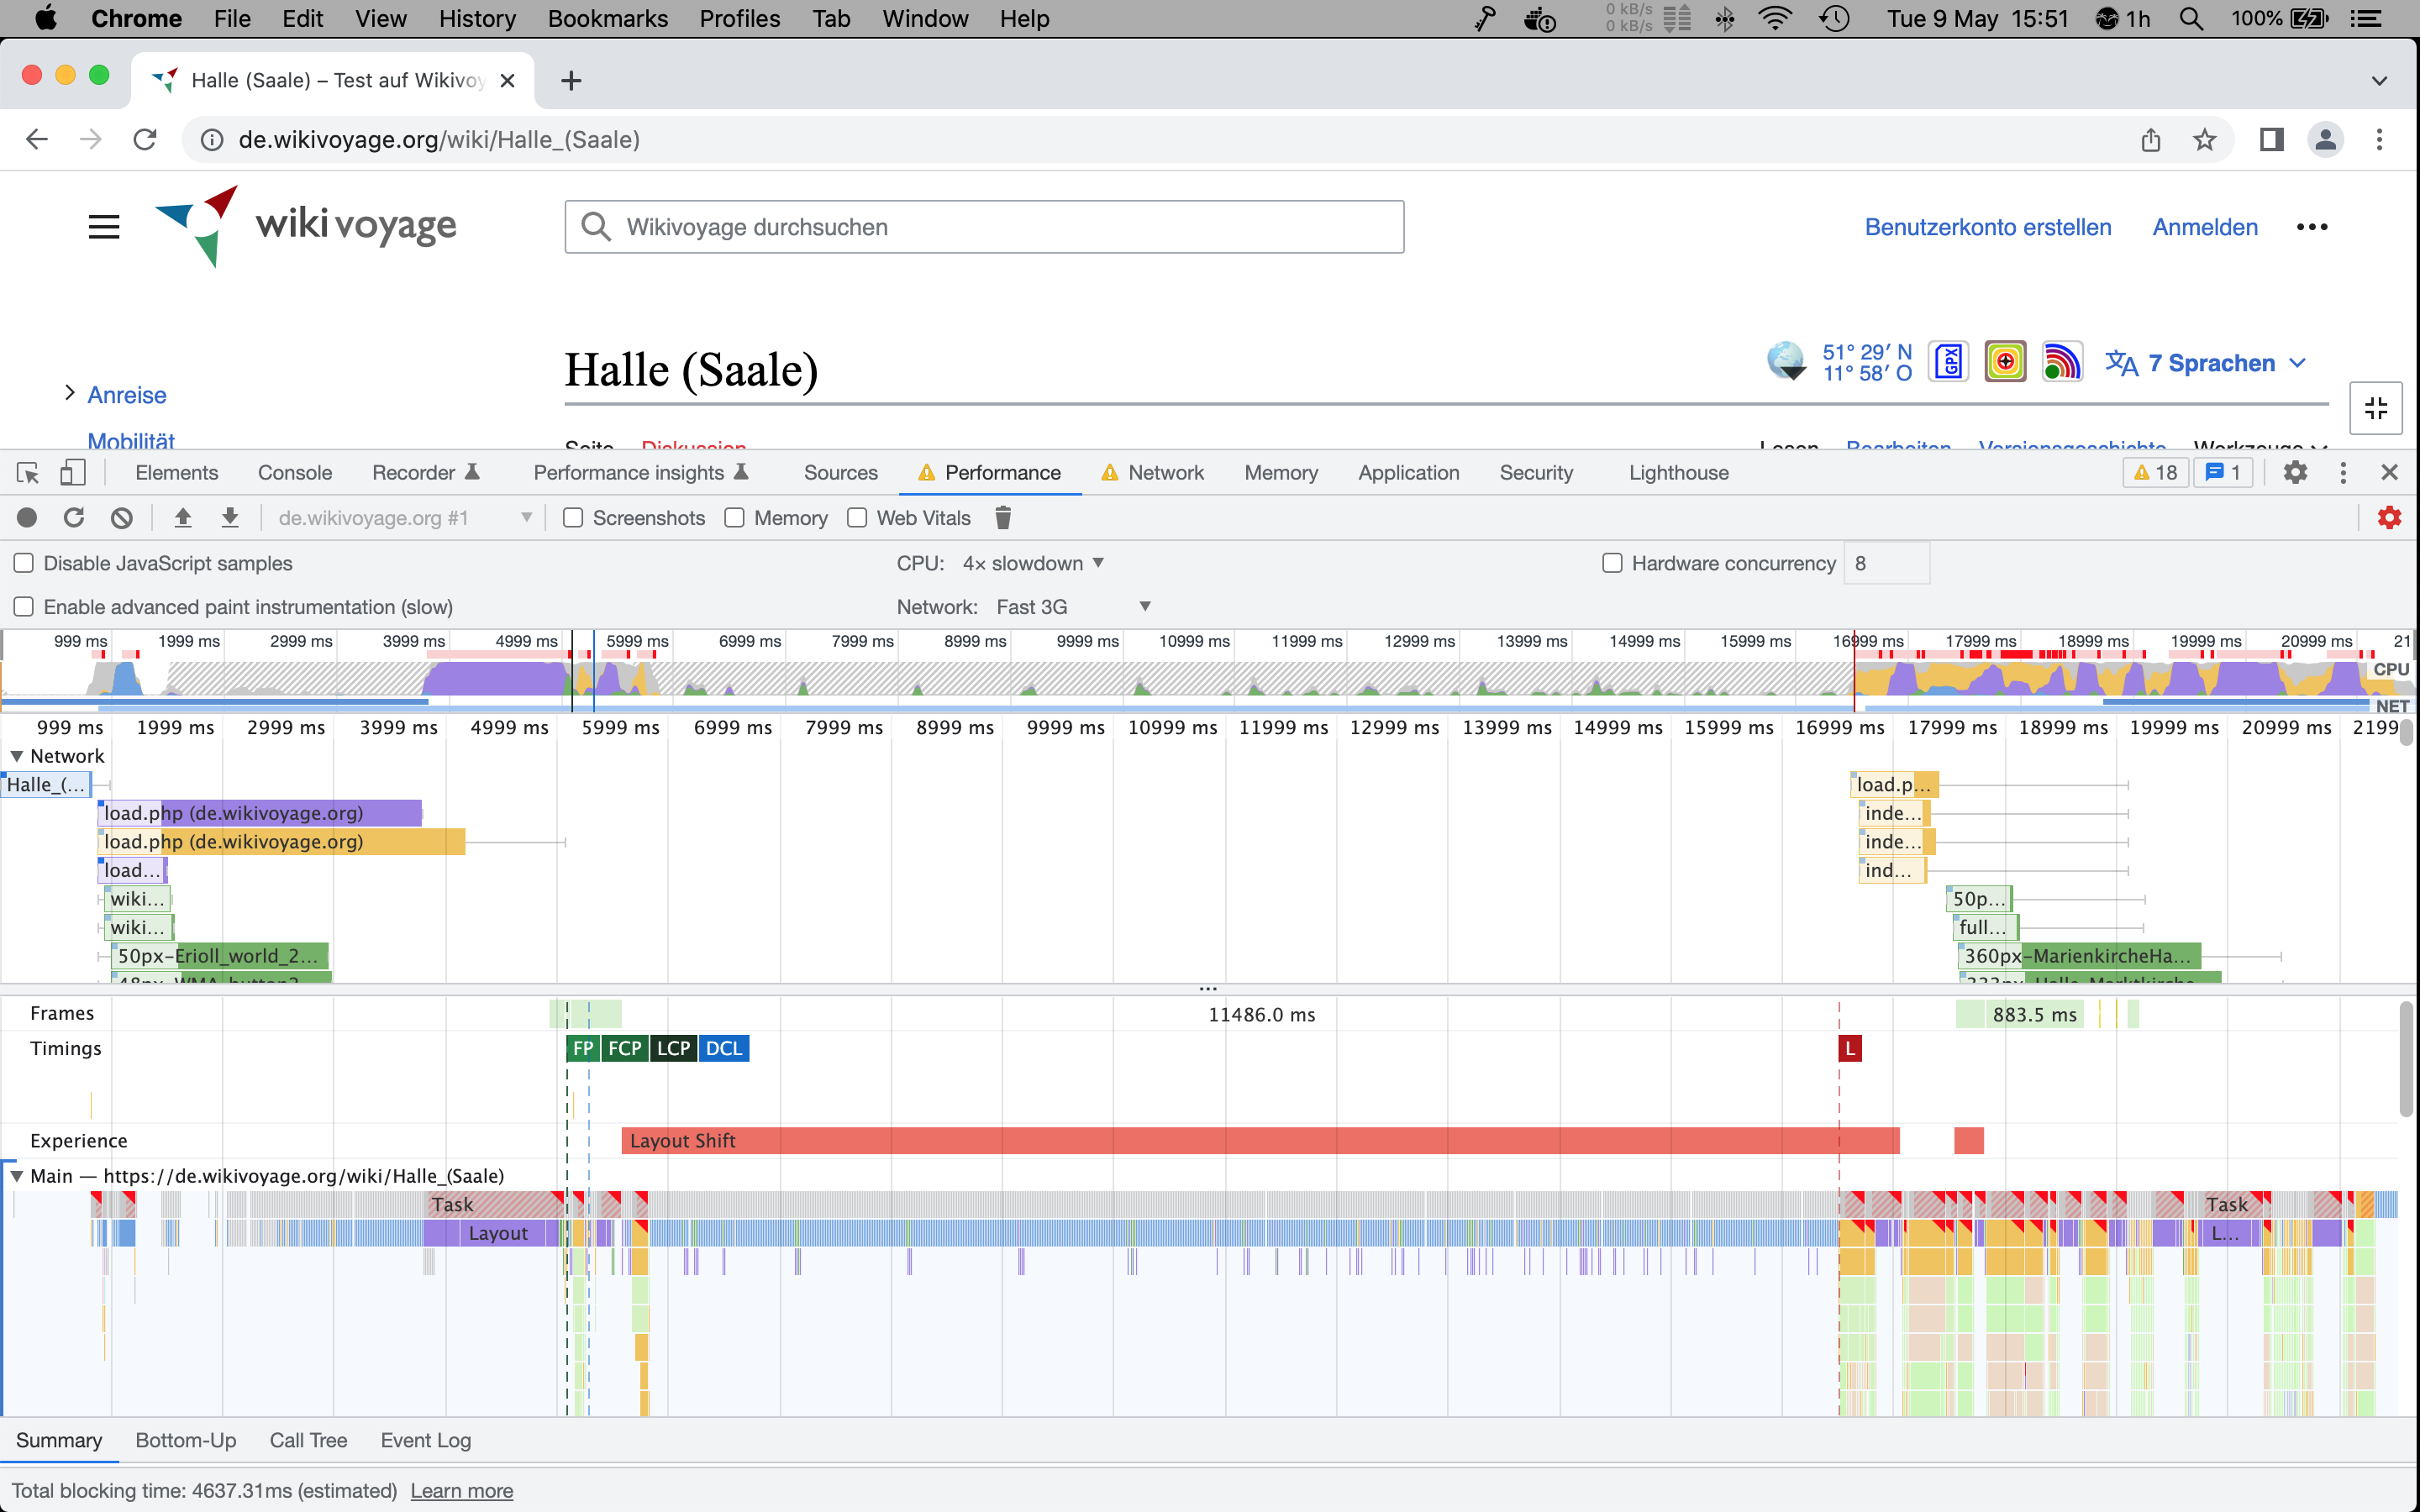
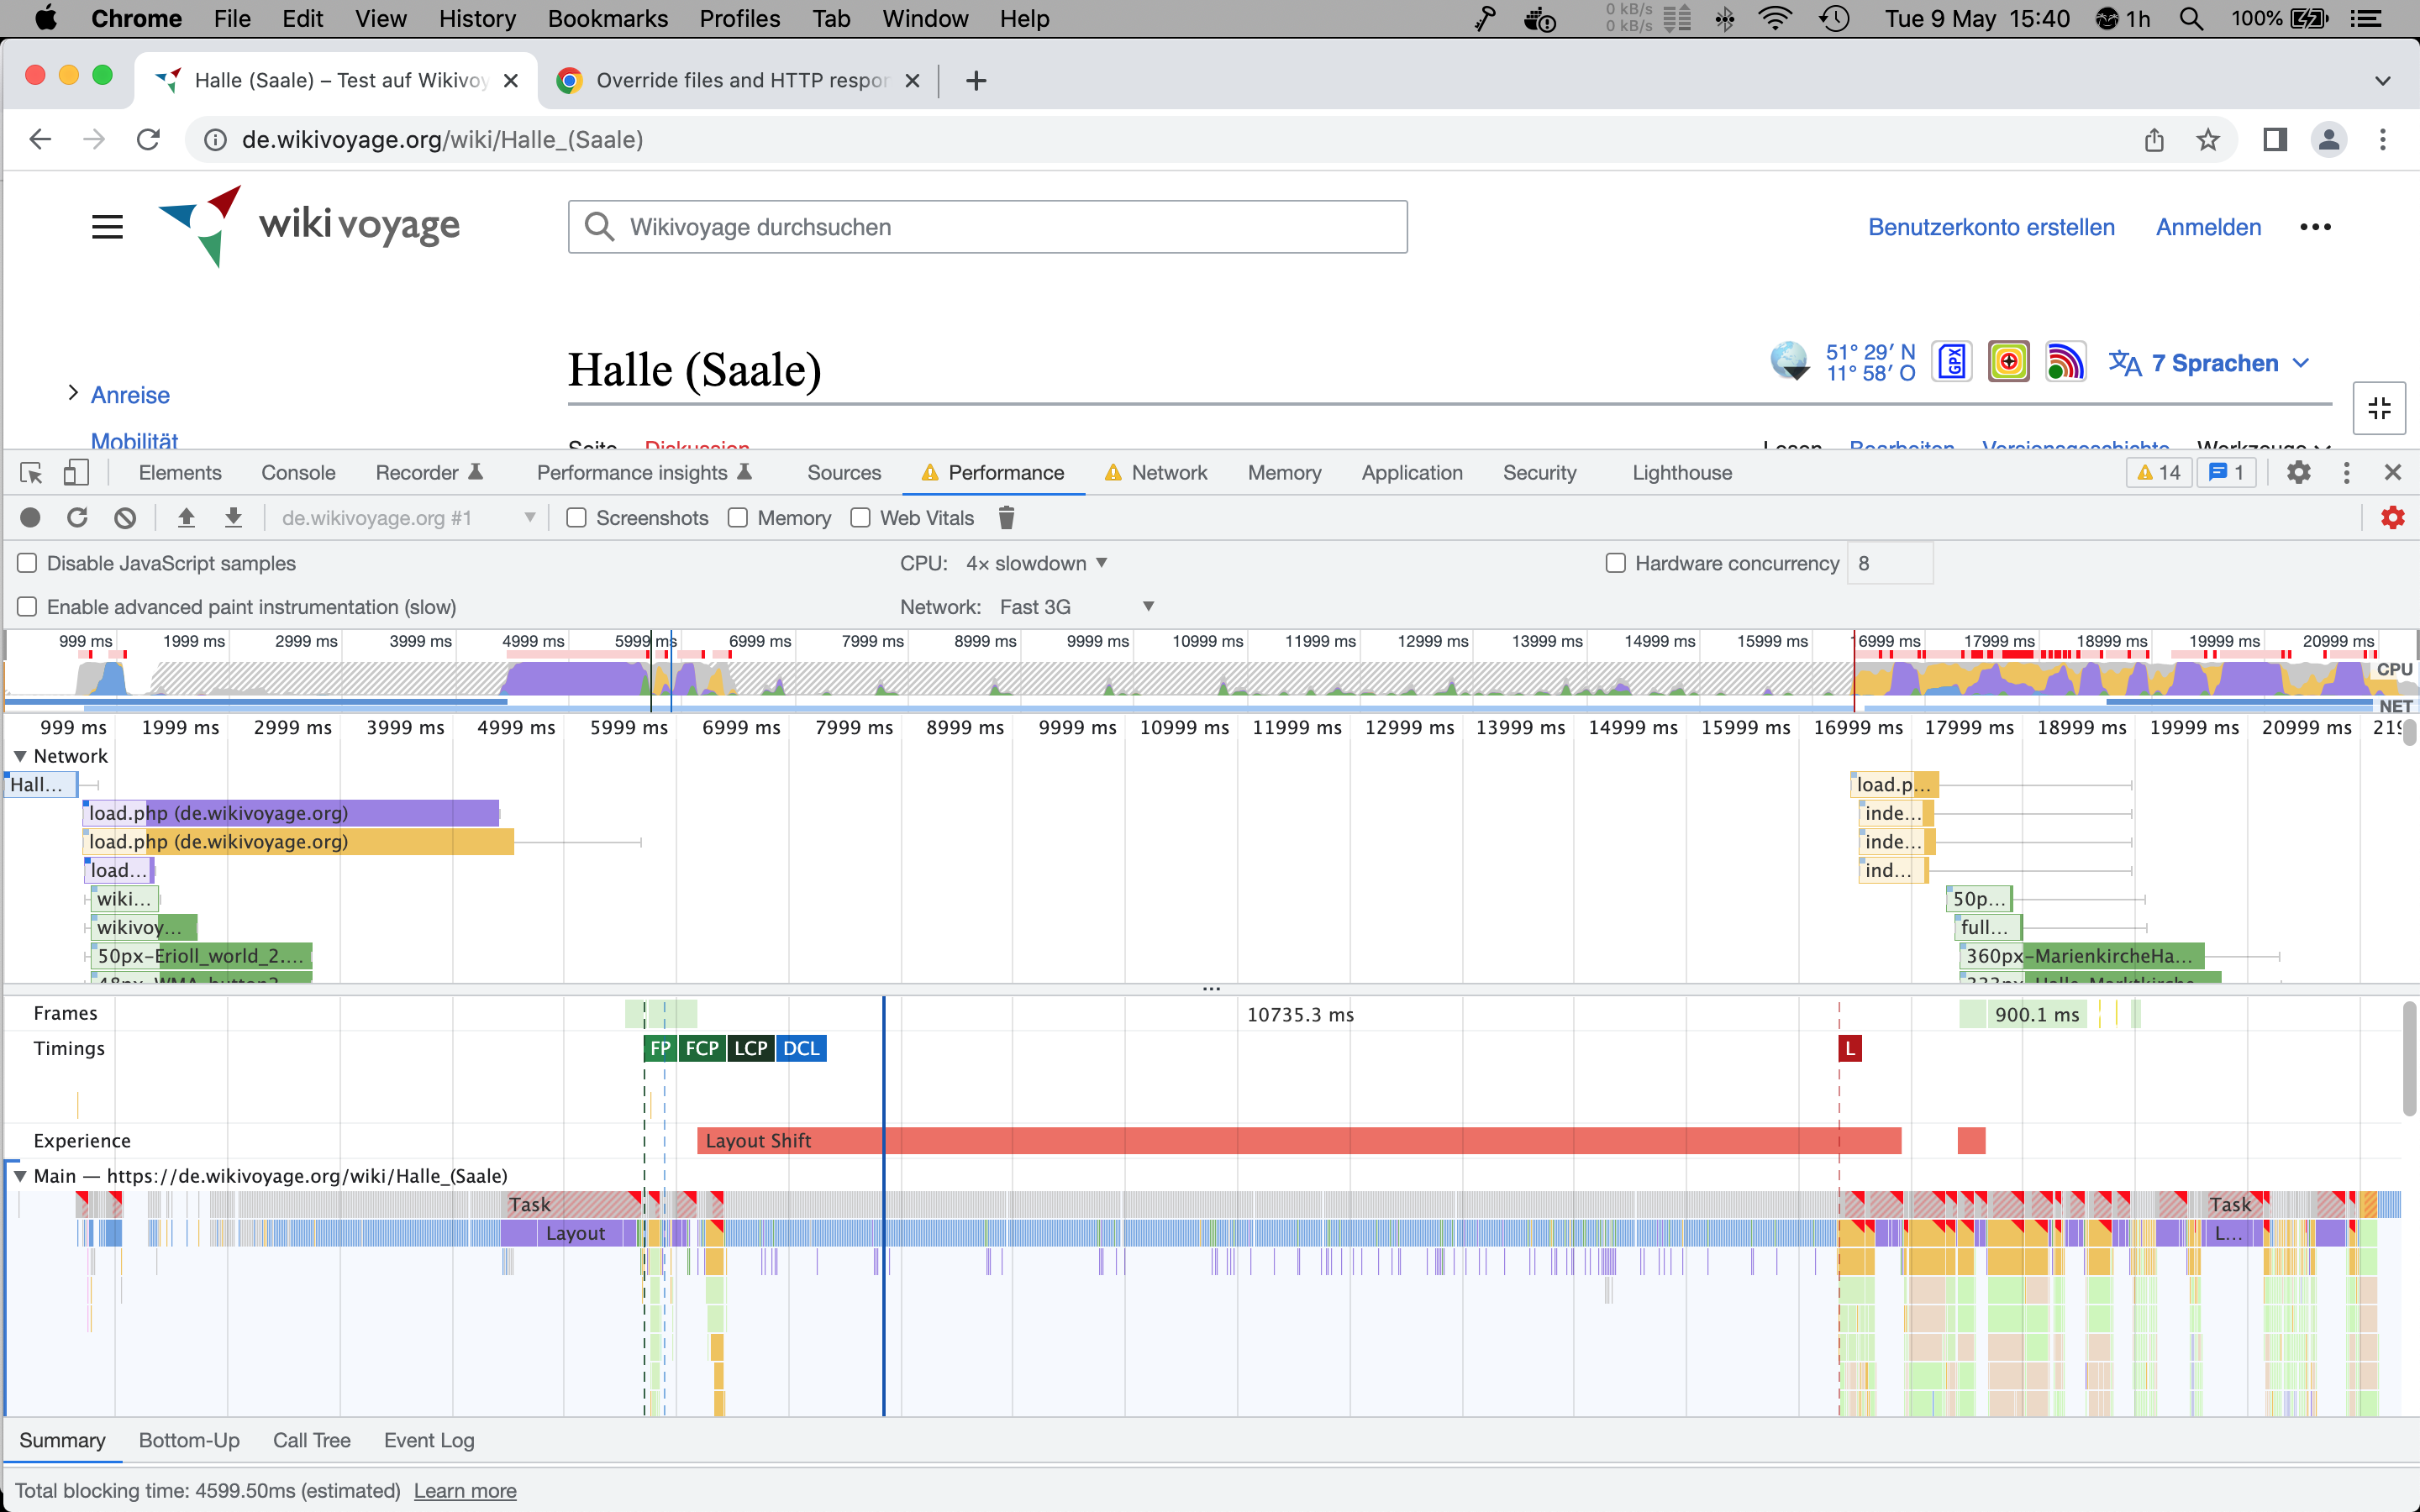
Motivation: allow displaying page content before map data loading is done (geojson blob is in the header now) to show page contents faster

Best practice to place secondary JS and data at the bottom instead of the header

To consider:

  • Make sure the dynamic mapframe code doesn’t accidentally miss the data and queries the API, i.e. initialization must also happen at the bottom.
  • How does it work during preview?
  • May break user scripts like the ones on Wikivoyage

Additional optimizations:

  • T149855 Don’t include GeoJSON in JS config when the wiki is set to show static map thumbnails. Request on-demand.
  • Request via a single mapdata API request with no group ids, which pulls all mapframes on the page. Current code will probably load each mapframe mapdata via a separate API call.

Event Timeline

Change 884999 had a related patch set uploaded (by Thiemo Kreuz (WMDE); author: Thiemo Kreuz (WMDE)):

[mediawiki/extensions/Kartographer@master] Move $wgKartographerLiveData blob to the bottom of the HTML

https://gerrit.wikimedia.org/r/884999

Krinkle moved this task from Limbo to Perf recommendation on the Performance-Team (Radar) board.
Krinkle subscribed.
@thiemowmde wrote on Gerrit:

For comparison, this is used super-rarely: https://codesearch.wmcloud.org/search/?q=LateJSConfigVarNames. To me the other usages look like our thought process here was correct.

This is exactly the sort of thing we added it for, it came out of the discussion at T41813. Nicely done!

Change 884999 merged by jenkins-bot:

[mediawiki/extensions/Kartographer@master] Move $wgKartographerLiveData blob to the bottom of the HTML

https://gerrit.wikimedia.org/r/884999

@RolandUnger, I hope you see this. This can potentially affect gadgets that don't wait with their initialization but assume the mw.config.get( 'wgKartographerLiveData' ) variable would be loaded before everything else. This is not necessarily true any more. Such scripts need to use e.g. $( function () {} ) or mw.hook( 'wikipage.content' ).add( function () {} ). Are you able to check the relevant Wikivoyage gadgets when this is rolled out as part of wmf.4 the next two days?

@RolandUnger, I hope you see this. This can potentially affect gadgets that don't wait with their initialization but assume the mw.config.get( 'wgKartographerLiveData' ) variable would be loaded before everything else. This is not necessarily true any more. Such scripts need to use e.g. $( function () {} ) or mw.hook( 'wikipage.content' ).add( function () {} ). Are you able to check the relevant Wikivoyage gadgets when this is rolled out as part of wmf.4 the next two days?

I checked https://global-search.toolforge.org/?q=wgKartographerLiveData&namespaces=&title=.*%5C.js and I couldn't find anything that wasn't guarded and actually in use.

Sorry, should have mentioned that.

Great, thanks a lot! This was backing in the oven for a while. Super happy to see it being merged.

@thiemowmde, I read your note. Only MediaWiki:Gadget-MapTools.js uses wgKartographerLiveData, and the gadget is called after complete load of the article by using $( mapTools.init ); at line 811. I hope that this is sufficient.

At voy-de, MediaWiki:Gadget-Poi2gpx.js is using wgKartographerLiveData, too. But it is similar to MediaWiki:Gadget-MapTools.js.

@thiemowmde Did you capture any local or production tests to compare before-after performance? I'd love to have a recent practical example of how reductions in head HTML impact performance. If you haven't yet and if it easy for you to reproduce this locally, perhaps you can capture something in devtools (docs). Another way might be using tests/captureSpeedtest.php (with a variant where you effectively undo the change in the HTML), and then using e.g. WebPageTest to compare before-after (I recommend 11 runs with 3G-Slow speed).

I did have a look through our navtiming and page journey dashboards in Grafana already, but I couldn't find a change one way or the other after last weeks' train. I'm guessing too few pages are affected to observe it there.

@Krinkle Thanks for the reminder. To be honest we made this change mostly because it was just the right thing to do. But when I played around with it today I don't see any difference. This confuses me quite a bit.

  • Yes, the number of pages that is affected by this is rather small.
  • The GeoJSON blob on most pages is very small, typically less than 1 KiB. This loads so fast that it just can't make a difference.
  • I made a test page with 500 KiB of GeoJSON, and throttled it in the browser's dev tools. This is very noticeable.
  • My assumption was that the page would render the moment the first few KiB of the page's HTML are available. Or at least that moving the GeoJSON down would give the browser much more opportunities for optimizations. But I can't see any difference, neither in Chrome nor in Firefox. They block, and the first paint happens only when the full 500 KiB are loaded.

What's going on?

Maybe for some tests: At German Wikivoyage, the Articles "Halle (Saale)" and "Wien" use the biggest amount of Kartographer GeoJSON data, in Halle (Saale) about 180,000 bytes. I hope that the page rendering is a little bit faster with the blob at the end at least for these articles.

Uh, this looks good!

Screenshot from 2023-04-25 17-03-47.png (479×1 px, 60 KB)

Notice how the "FP" (first paint) happens in the middle of the blue bar, i.e. after half of the HTML document loaded. This was not possible before. It really looks like pages like these can load more than 2 full seconds faster. And I didn't even throttled anything for this test.

@thiemowmde Nice work!

By the way, I don't know if you also took a profile from before the change, but in case you didn't, here's one way to do it after the fact. I'll use your example of https://de.wikivoyage.org/wiki/Halle_(Saale).

  1. Open https://de.wikivoyage.org/wiki/Halle_(Saale) in Chrome, logged-out.
  2. In Devtools, add an empty directory for "Overrides" and use "Save for overrides" on the Halle HTML resource, following https://developer.chrome.com/docs/devtools/overrides/. I changed <title> very slightly in order to confirm that it's using the override on the next reload. Record a perf profile on this state.
  3. Edit the override, moving the large wgKartographerLiveData: {…}, from bottom mw.config script to the head script assignment of RLCONF. Record another perf profile.
  4. Edit the override, move it back down. Record another perf profile.
  5. Edit the override, move it back up. Record another perf profile.
Before 1Before 2
Screenshot 2023-05-09 at 15.43.26.png (1×2 px, 669 KB)
head.png (1×2 px, 648 KB)
After 1After 2
Screenshot 2023-05-09 at 15.40.27.png (1×2 px, 676 KB)
body2.png (1×2 px, 644 KB)

With the emulated network, this shows the same 1-2 second speed up to FCP indeed! Very nice. (Emulated network is extra important when using overrides, as localhost will otherwise mask the chunked nature of downloading the main document response, which plays an important role here)

Great, I wasn't aware of this feature. Thanks! Question: What's the difference in the 4 images?

@thiemowmde Two main differences that I see:

  • The FCP mark is around 5s in the first two, and around the 6s in the last two.
  • Looking at the blue "HTML parse" chunks and where in those the pink "Layout" chunk takes place, in the last two this happens notably later, suggesting that it performed more HTML parsing before it had enough to decide to do the Layout.

OK, so I went back and forth on this in my original comment. I initially wrote that I actually see it perform worse after this change, and was going ask whether you can think of why. Most likely something wrong in how we're testing it as the benefit seems obvious. I then scrapped that after reproducing it twice more and thinking to myself I must have switched up the screenshots by accident, this time carefully labelling them as "head" and "body". But, I see that I didn't make a mistake. Despite my claim below the images above that it shows a speed up, it in fact shows the very regression I thought I saw.

Do you see it too?

The blue bar for the "Halle_(Salle)" page doesn't look right. It's 1.5 MB and should take much, much longer. Compare with the blue bar in my screenshot.

As far as I can tell what's going on here is that "Overrides" aren't throttled but available almost instantly. In this case the position of the JSON blob can't make much of a difference.

I'm not sure where the difference in your screenshots comes from. For some reason loading some of the .js resources is 1s slower in some of them. While this might be related it's probably a secondary, much less relevant effect.