Page MenuHomePhabricator

Logs from containers sometimes not visible in logstash
Open, HighPublicBUG REPORT

Description

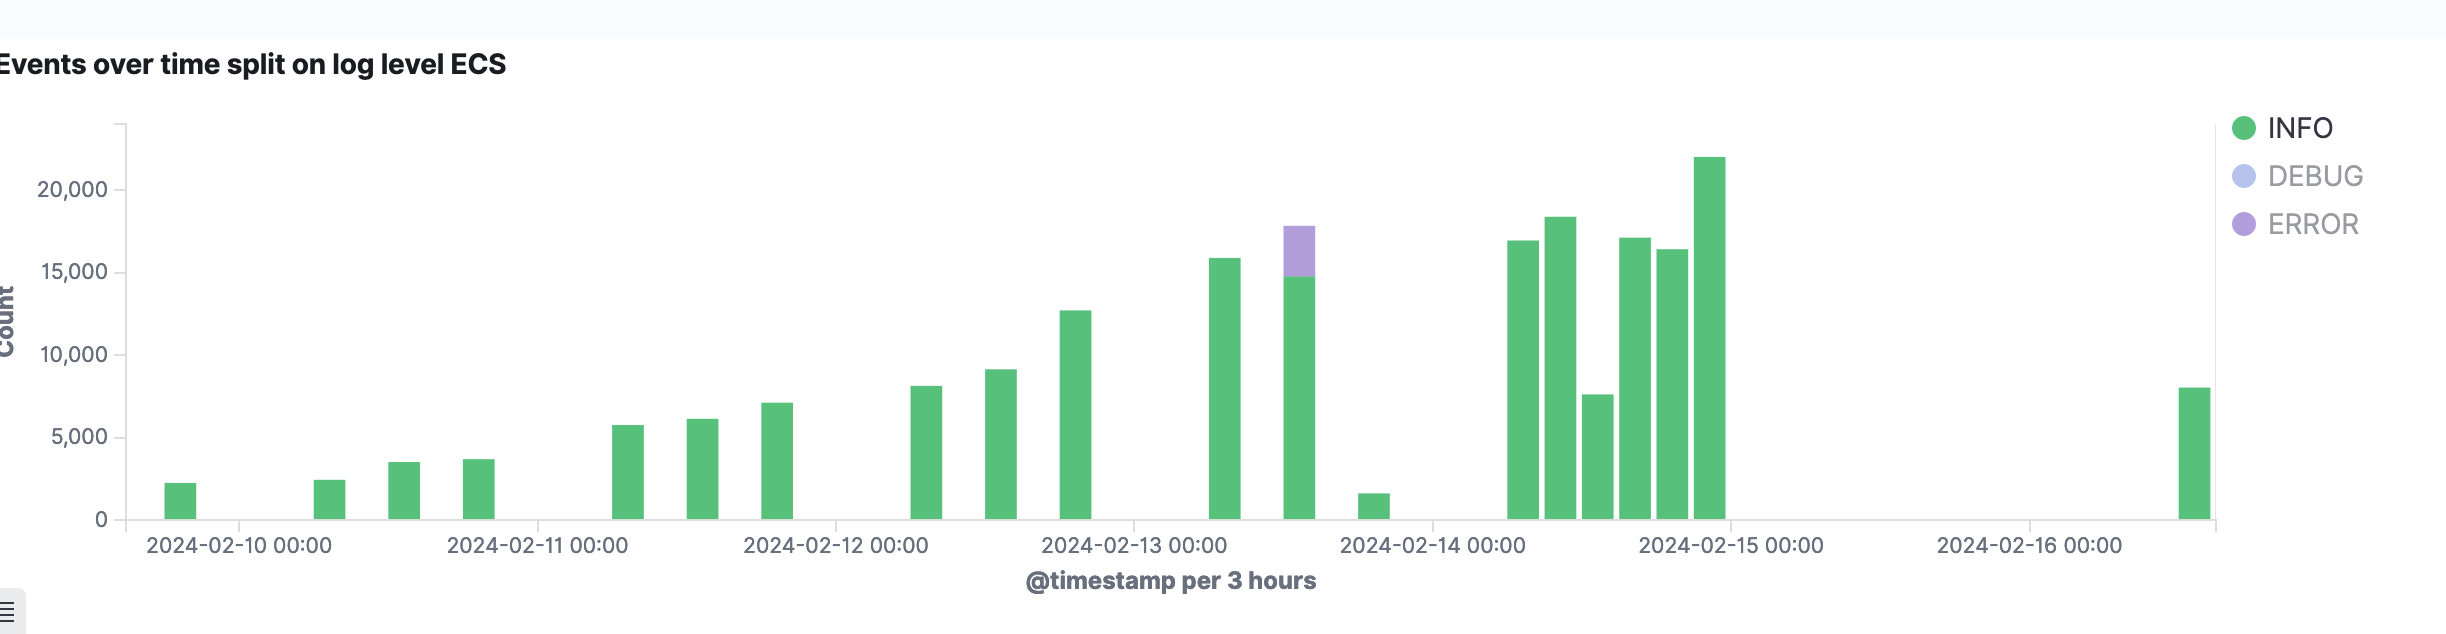
Looking at ipoid logs for a daily update job (https://logstash.wikimedia.org/goto/38612bc80f6fe606465dfa17b283b152), I see that log events stop appearing after Feb 14, 2024 @ 23:40:08.183.

However, if I run this:

kharlan@deploy2002:~$ kubectl logs --since=1m ipoid-production-daily-updates-28465260-qbbz9
{"@timestamp":"2024-02-15T11:08:29.509Z","ecs.version":"8.10.0","log.level":"info","message":"All updates complete","trace.id":"eb27e58c-17d2-48c9-b48a-236cfcf03b36"}
{"log.level":"info","@timestamp":"2024-02-15T11:08:30.574Z","process.pid":1297,"host.hostname":"ipoid-production-daily-updates-28465260-qbbz9","ecs.version":"8.10.0","message":"Importing /tmp/ipoid/sub/query_split_aacuv.sql...","trace.id":"eb27e58c-17d2-48c9-b48a-236cfcf03b36"}

I can see that there are log events still being emitted.

I'm not sure why this is happening. One thing to note is that the job has been running for a long time (22 hours, see T356736) but I am not sure why that should be related.

Event Timeline

kostajh changed the subtype of this task from "Task" to "Bug Report".Feb 15 2024, 11:14 AM
JMeybohm added subscribers: fgiunchedi, JMeybohm.

I tried to find a culprit but could not find anything obvious. The only thing I see are, probably unrelated, rsyslogd errors from omfwd plugin fleet wide:

Feb 15 11:35:15 mw1460 rsyslogd: nsd_ossl: Information, no shared curve between syslog client and server [v8.2208.0]
Feb 15 11:35:15 mw1460 rsyslogd: nsd_ossl: TLS Connection initiated with remote syslog server. [v8.2208.0]
Feb 15 11:35:15 mw1460 rsyslogd: nsd_ossl: TLS session terminated successfully to remote syslog server 'centrallog1002.eqiad.wmnet' with SSL Error '-1': End Session [v8.2208.0]
Feb 15 11:35:15 mw1460 rsyslogd: omfwd: TCPSendBuf error -1, destruct TCP Connection to centrallog1002.eqiad.wmnet:6514 [v8.2208.0]
Feb 15 11:35:15 mw1460 rsyslogd: SSL_ERROR_SYSCALL Error in 'Send': 'error:00000005:lib(0):func(0):DH lib(5)' with ret=-1, errno=32, sslapi='SSL_write'  [v8.2208.0]
Feb 15 12:15:17 mw1460 rsyslogd: action 'fwd_centrallog1002.eqiad.wmnet:6514' resumed (module 'builtin:omfwd') [v8.2208.0 try https://www.rsyslog.com/e/2359 ]
Feb 15 12:15:17 mw1460 rsyslogd: action 'fwd_centrallog1002.eqiad.wmnet:6514' suspended (module 'builtin:omfwd'), retry 0. There should be messages before this one giving the reason for suspension. [v8.2208.0 try https://www.rsyslog.com/e/2007 ]

As k8s logs go a different route (to kafka-logging) they should not be affected by the above.

I don't think ipoid is alone in being affected. eventrouter logstash shows a decent sized hole when there's usually at least some background logging going on.

Yeah, although those are from a different index (logstash-* vs. ecs-*). Not sure if that makes any difference

Feels like index rollover, but these logs were found in a weekly-rotated index ecs-k8s-1-1.11.0-6-2024.07 which is still accepting logs.

There were two logs found in the dead-letter queue with "ipoid" in the name, but they were destined for the legacy indexes with "cert-manager" in the namespace.

OpenSearch logs didn't yield anything interesting.

So far, it seems ipoid logs probably aren't reaching kafka.

There were two logs found in the dead-letter queue with "ipoid" in the name, but they were destined for the legacy indexes with "cert-manager" in the namespace.

Yeah, those two are from cert-manager itself and only related to issuing certificates for ipoid, that's why that name comes up. So not related to the missing ipoid logs.

So far, it seems ipoid logs probably aren't reaching kafka.

Is there a way to check? rsyslog on the nodes itself seem fine, apart from the omfwd stuff from above.

So far, it seems ipoid logs probably aren't reaching kafka.

Is there a way to check? rsyslog on the nodes itself seem fine, apart from the omfwd stuff from above.

I've been tapped into the topic for a while now. I see logs coming from mw1460, but no logs from ipoid-production-daily-updates. It appears the ipoid logs are not being shipped.

The long running cronjob had a timeout when connecting to MySQL. The logs from the new replacement job are appearing in Logstash (https://logstash.wikimedia.org/goto/6577b0a0321d7aa1b60fac7383ef4d06)

image.png (634×2 px, 75 KB)

@colewhite @JMeybohm @Clement_Goubert I think we could mark this resolved, unless you want to investigate it further.

JMeybohm renamed this task from Logs from ipoid-production-daily-updates-28465260-qbbz9 are not visible in Logstash after Feb 14, 2024 @ 23:40:08.183 to Logs from containers sometimes not visible in logstash.Feb 20 2024, 2:07 PM

@colewhite @JMeybohm @Clement_Goubert I think we could mark this resolved, unless you want to investigate it further.

I've the impression that this happens from time to time and is only observed when someone is actively looking for logs. I'd like to know the root cause of this and have it fixed - or at least alerted on so that we can react before we're loosing logs.

Another case of no missing container logs from mw2434, @Clement_Goubert did restart rsyslgd which was probably in a bad state:

Feb 20 10:55:10 mw2434 rsyslogd: action 'fwd_centrallog2002.codfw.wmnet:6514' suspended (module 'builtin:omfwd'), retry 0. There should be messages before this one giving the reason for suspension. [v8.2208.0 try https://www.rsyslog.com/e/2007 ]
Feb 20 10:55:10 mw2434 rsyslogd: nsd_ossl: TLS Connection initiated with remote syslog server. [v8.2208.0]
Feb 20 10:55:10 mw2434 rsyslogd: nsd_ossl: Information, no shared curve between syslog client and server [v8.2208.0]
Feb 20 10:55:10 mw2434 rsyslogd: action 'fwd_centrallog2002.codfw.wmnet:6514' resumed (module 'builtin:omfwd') [v8.2208.0 try https://www.rsyslog.com/e/2359 ]
Feb 20 12:24:57 mw2434 rsyslogd: [origin software="rsyslogd" swVersion="8.2208.0" x-pid="3023245" x-info="https://www.rsyslog.com"] exiting on signal 15.
Feb 20 12:26:27 mw2434 systemd[1]: rsyslog.service: State 'stop-sigterm' timed out. Killing.
Feb 20 12:26:27 mw2434 systemd[1]: rsyslog.service: Killing process 3023245 (rsyslogd) with signal SIGKILL.
Feb 20 12:26:27 mw2434 systemd[1]: rsyslog.service: Killing process 2429765 (rdk:broker2005) with signal SIGKILL.
Feb 20 12:26:27 mw2434 systemd[1]: rsyslog.service: Main process exited, code=killed, status=9/KILL
Feb 20 12:26:27 mw2434 systemd[1]: rsyslog.service: Failed with result 'timeout'.
Feb 20 12:26:27 mw2434 systemd[1]: rsyslog.service: Consumed 53min 41.497s CPU time.
Feb 20 12:26:27 mw2434 rsyslogd: lookup table 'output_lookup' loaded from file '/etc/rsyslog.lookup.d/lookup_table_output.json' [v8.2208.0 try https://www.rsyslog.com/e/0 ]
Feb 20 12:26:27 mw2434 rsyslogd: imuxsock: Acquired UNIX socket '/run/systemd/journal/syslog' (fd 3) from systemd.  [v8.2208.0]
Feb 20 12:26:27 mw2434 rsyslogd: [origin software="rsyslogd" swVersion="8.2208.0" x-pid="1326944" x-info="https://www.rsyslog.com"] start

I've created https://github.com/prometheus-community/rsyslog_exporter/pull/12 so we can collect kafka stats from rsyslogd as everything points into that direction currently

The rdk:broker2005 references one of the threads (I do see two) handling the connection to kafka-logging2005 (according to https://github.com/confluentinc/librdkafka/issues/2489#issuecomment-523824657)

Change 1005449 had a related patch set uploaded (by JMeybohm; author: JMeybohm):

[operations/puppet@production] kafka_shipper: Name omkafka actions to ingest metrics

https://gerrit.wikimedia.org/r/1005449

Change 1005508 had a related patch set uploaded (by JMeybohm; author: JMeybohm):

[operations/debs/prometheus-rsyslog-exporter@master] New upstream version v1.0.0-8522c38

https://gerrit.wikimedia.org/r/1005508

Change 1005449 merged by JMeybohm:

[operations/puppet@production] kafka_shipper: Name omkafka actions to ingest metrics

https://gerrit.wikimedia.org/r/1005449

Change 1005508 merged by JMeybohm:

[operations/debs/prometheus-rsyslog-exporter@master] New package version 1.0.0+git20221110-1

https://gerrit.wikimedia.org/r/1005508

Mentioned in SAL (#wikimedia-operations) [2024-02-21T16:06:06Z] <jayme> imported prometheus-rsyslog-exporter 1.0.0+git20221110-1 to buster,bullseye,bookworm - T357616

Mentioned in SAL (#wikimedia-operations) [2024-02-22T08:52:06Z] <jayme> rolling out prometheus-rsyslog-exporter 1.0.0+git20221110-1 to wikikube nodes - T357616

Change 1005718 had a related patch set uploaded (by JMeybohm; author: JMeybohm):

[operations/debs/prometheus-rsyslog-exporter@master] Don't restart rsyslog on updates, kill exporter instead

https://gerrit.wikimedia.org/r/1005718

Change 1005718 abandoned by JMeybohm:

[operations/debs/prometheus-rsyslog-exporter@master] Don't restart rsyslog on updates, kill exporter instead

Reason:

https://gerrit.wikimedia.org/r/1005718

Mentioned in SAL (#wikimedia-operations) [2024-02-23T08:20:24Z] <godog> rollout prometheus-rsyslog-exporter new version to remaining hosts, caching sites - T357616

Unfortunately we did not gain any insides from the new metrics (dashboard at https://grafana-rw.wikimedia.org/d/KimNkFTIk/jayme-omkafka) as of now. We where also not able to spot another incarnation of this issue or reproduce it somehow

Mentioned in SAL (#wikimedia-operations) [2024-03-25T13:55:47Z] <godog> finish rolling out rsyslog-exporter to remaining hosts in codfw and eqiad - T357616

[26.03.24 14:55] <jinxer-wm> (KubernetesRsyslogDown) firing: rsyslog on mw1483:9105 is missing kubernetes logs

This seems to be a new kind of problem. I do see tons of `Too many open files`  messages from rsyslog:
Mar 26 13:16:44 mw1483 rsyslogd[2876433]: imfile: error accessing file '/var/log/containers/mw-api-int.eqiad.main-5c486f79f7-tszmg_mw-api-int_mediawiki-main-mcrouter-exporter-5f337afa200c55b5fddb37a430b634ac01bb59d4e9af6e1a28bb59720b4c0527.log': Too many open files [v8.2208.0]
Mar 26 13:16:54 mw1483 rsyslogd[2876433]: impstats: error reading /proc/2876433/fd : Too many open files [v8.2208.0]
Mar 26 13:17:26 mw1483 rsyslogd[2876433]: imfile: cannot open state file '/var/spool/rsyslog/imfile-state:23863781:8040125d604e92ec' for persisting file state - some data will probably be duplicated on next startup: Too many open files [v8.2208.0 try https://www.rsyslog.com/e/2027 ]

Looking at /proc/$(systemctl show --property MainPID --value rsyslog.service)/fd/ it seems like almost all of the open fd's are for already deleted container log files:

root@mw1483:~# grep "^Max open files" /proc/2876433/limits
Max open files            16384                16384                files
root@mw1483:~# ls /proc/2876433/fd/ -la | wc -l
16387
root@mw1483:~# ls /proc/2876433/fd/ -la | grep "/var/lib/docker/containers" -c
16315
root@mw1483:~# ls /proc/2876433/fd/ -la | grep "/var/lib/docker/containers" | grep -v '(deleted)'  -c
72

And this seems to be pretty common:

jayme@cumin1002:~$ sudo cumin --force --no-progress --no-color -o txt A:wikikube-worker-eqiad "ls -la /proc/\$(systemctl show --property MainPID --value rsyslog.service)/fd/ | grep -c '(deleted)'" | sort -nr -k 2  | head -n 10
172 hosts will be targeted:
kubernetes[1005-1062].eqiad.wmnet,mw[1349-1354,1356-1357,1360-1363,1367-1370,1374-1397,1408,1419,1423-1425,1430-1434,1439-1442,1451-1455,1457-1479,1482-1486,1488,1494-1496].eqiad.wmnet,parse[1002-1024].eqiad.wmnet
FORCE mode enabled, continuing without confirmation
100.0% (172/172) success ratio (>= 100.0% threshold) for command: 'ls -la /proc/$(s...p -c '(deleted)''.
100.0% (172/172) success ratio (>= 100.0% threshold) of nodes successfully executed all commands.
mw1483.eqiad.wmnet: 16243
mw1485.eqiad.wmnet: 15798
mw1484.eqiad.wmnet: 15749
mw1467.eqiad.wmnet: 15318
mw1468.eqiad.wmnet: 15128
mw1431.eqiad.wmnet: 13306
mw1430.eqiad.wmnet: 13172
mw1385.eqiad.wmnet: 13090
mw1453.eqiad.wmnet: 13030
mw1494.eqiad.wmnet: 12755

But hitting the limit does not happen on a large number of machines:

jayme@cumin1002:~$ sudo cumin --force --no-progress --no-color -o txt A:wikikube-worker-eqiad "zgrep 'rsyslogd' /var/log/syslog*  | grep 'Too many open files' -c || true " |  sort -nr -k 2  | head -n 10
172 hosts will be targeted:
kubernetes[1005-1062].eqiad.wmnet,mw[1349-1354,1356-1357,1360-1363,1367-1370,1374-1397,1408,1419,1423-1425,1430-1434,1439-1442,1451-1455,1457-1479,1482-1486,1488,1494-1496].eqiad.wmnet,parse[1002-1024].eqiad.wmnet
FORCE mode enabled, continuing without confirmation
100.0% (172/172) success ratio (>= 100.0% threshold) for command: 'zgrep 'rsyslogd'...les' -c || true '.
100.0% (172/172) success ratio (>= 100.0% threshold) of nodes successfully executed all commands.
mw1455.eqiad.wmnet: 6585
mw1452.eqiad.wmnet: 5306
mw1454.eqiad.wmnet: 4352
mw1483.eqiad.wmnet: 3171
mw1451.eqiad.wmnet: 161
parse1024.eqiad.wmnet: 0

This seems to be an issue with how imfile implements inotify watches for symlinks (or symlinks to symlinks maybe?):

Unfortunately rsyslog does also not close input files on SIGHUP, so there really is no other way then restarting rsyslog before the fd limit is reached to not loose data.

btw, in case this is relevant, https://logstash.wikimedia.org/goto/b060c8f0c137245fc0d63b9329583abe shows a spike of a bunch of requests with the same request ID, but those logs for handling web requests. I can file a separate task for that if you think it's worth investigating further.

btw, in case this is relevant, https://logstash.wikimedia.org/goto/b060c8f0c137245fc0d63b9329583abe shows a spike of a bunch of requests with the same request ID, but those logs for handling web requests. I can file a separate task for that if you think it's worth investigating further.

Unfortunately that seems very unrelated. The node running the pod that seemed to emit those logs (mw2381) has not suffered from this in the time period in question. Although I do see a rsyslog restart right at that time:

Mar 20 11:45:07 mw2381 rsyslogd[2879512]: action 'fwd_centrallog1002.eqiad.wmnet:6514' resumed (module 'builtin:omfwd') [v8.2208.0 try https://www.rsyslog.com/e/2359 ]
Mar 20 12:43:24 mw2381 systemd[1]: Stopping System Logging Service...
Mar 20 12:43:24 mw2381 rsyslogd[2879512]: [origin software="rsyslogd" swVersion="8.2208.0" x-pid="2879512" x-info="https://www.rsyslog.com"] exiting on signal 15.
Mar 20 12:43:24 mw2381 rsyslog_exporter[2186074]: 2024/03/20 12:43:24 Listening on 10.192.0.44:9105
Mar 20 12:43:25 mw2381 rsyslog_exporter[2186074]: 2024/03/20 12:43:25 input ended, exiting normally
Mar 20 12:43:25 mw2381 systemd[1]: rsyslog.service: Succeeded.
Mar 20 12:43:25 mw2381 systemd[1]: Stopped System Logging Service.
Mar 20 12:43:25 mw2381 systemd[1]: rsyslog.service: Consumed 1h 34min 49.263s CPU time.
Mar 20 12:43:25 mw2381 systemd[1]: Starting System Logging Service...
Mar 20 12:43:25 mw2381 rsyslogd[2186156]: lookup table 'output_lookup' loaded from file '/etc/rsyslog.lookup.d/lookup_table_output.json' [v8.2208.0 try https://www.rsyslog.com/e/0 ]
Mar 20 12:43:25 mw2381 rsyslogd[2186156]: imuxsock: Acquired UNIX socket '/run/systemd/journal/syslog' (fd 3) from systemd.  [v8.2208.0]

Change #1015039 had a related patch set uploaded (by JMeybohm; author: JMeybohm):

[operations/puppet@production] kubernetes::node restart rsyslog if too many fd's are blocked by inotify

https://gerrit.wikimedia.org/r/1015039

Change #1015039 merged by JMeybohm:

[operations/puppet@production] kubernetes::node restart rsyslog if too many fd's are blocked by inotify

https://gerrit.wikimedia.org/r/1015039

A systemd timer has been deployed to all kubernetes nodes that will check every hour if rsyslog has accumulated >10k fd's to deleted files/folders and restarts it if that's the case...let's see.

JMeybohm claimed this task.

The restarts do work properly and we've not seen "Too many open files" errors since their implementation. I'm optimistically resolving this for now

JMeybohm reopened this task as Open.EditedFri, Apr 5, 1:25 PM
JMeybohm triaged this task as High priority.
JMeybohm removed a project: iPoid-Service.

This is still happening. K8s event logs seem suspiciously empty on April 4th for eqiad for example.

Also rsyslog got stuck on kubernetes2036, alert: 12:50 <jinxer-wm> (KubernetesRsyslogDown) firing: rsyslog on kubernetes2036:9105 is missing kubernetes logs

# journalctl -u rsyslog.service
Apr 04 22:45:01 kubernetes2036 rsyslogd[3656430]: main Q:Reg: high activity - starting 1 additional worker thread(s), currently 1 active worker threads. [v8.2208.0 try https://www.rsyslog.com/e/2439 ]
Apr 04 22:45:09 kubernetes2036 rsyslogd[3656430]: cannot resolve hostname 'centrallog1002.eqiad.wmnet': Resource temporarily unavailable [v8.2208.0 try https://www.rsyslog.com/e/2027 ]
Apr 04 22:45:09 kubernetes2036 rsyslogd[3656430]: action 'fwd_centrallog1002.eqiad.wmnet:6514' suspended (module 'builtin:omfwd'), next retry is Thu Apr  4 22:45:39 2024, retry nbr 0. There should be messages before this one giving the reason for suspension. [v8.2208.0 try https://www.rsyslog.com/e/2007 ]
Apr 04 22:45:11 kubernetes2036 rsyslog_exporter[3657112]: 2024/04/04 22:45:11 Listening on 10.192.32.169:9105
Apr 04 22:46:02 kubernetes2036 rsyslogd[3656430]: main Q:Reg: worker thread 555ab4b4aa90 terminated, now 1 active worker threads [v8.2208.0 try https://www.rsyslog.com/e/2439 ]
Apr 05 00:00:00 kubernetes2036 systemd[1]: rsyslog.service: Sent signal SIGHUP to main process 3656430 (rsyslogd) on client request.
Apr 05 00:00:00 kubernetes2036 systemd[1]: rsyslog.service: Sending signal SIGHUP to process 3657112 (prometheus-rsys) on client request.
Apr 05 00:00:00 kubernetes2036 systemd[1]: rsyslog.service: Sent signal SIGHUP to main process 3656430 (rsyslogd) on client request.
Apr 05 00:00:06 kubernetes2036 rsyslog_exporter[3970497]: 2024/04/05 00:00:06 Listening on 10.192.32.169:9105

The syslog on that host is empty as well. Rotation has not properly happened:

# ls -la /var/log/syslog /var/log/syslog.1
-rw-r----- 1 root adm       0 Apr  5 00:00 /var/log/syslog
-rw-r----- 1 root adm 5399538 Apr  5 12:40 /var/log/syslog.1
# logger "jayme is testing"
# tail /var/log/syslog.1 /var/log/syslog
==> /var/log/syslog.1 <==
Apr  5 12:35:38 kubernetes2036 systemd[1]: Finished Update NIC firmware stats exported by node_exporter.
Apr  5 12:36:00 kubernetes2036 systemd[1]: Starting Export confd Prometheus metrics...
Apr  5 12:36:00 kubernetes2036 systemd[1]: confd_prometheus_metrics.service: Succeeded.
Apr  5 12:36:00 kubernetes2036 systemd[1]: Finished Export confd Prometheus metrics.
Apr  5 08:18:00 kubernetes2036 systemd[1]: Starting Export confd Prometheus metrics...
Apr  5 08:18:00 kubernetes2036 systemd[1]: confd_prometheus_metrics.service: Succeeded.
Apr  5 08:18:00 kubernetes2036 systemd[1]: Finished Export confd Prometheus metrics.
Apr  5 12:37:00 kubernetes2036 systemd[1]: Starting Export confd Prometheus metrics...
Apr  5 12:37:00 kubernetes2036 systemd[1]: confd_prometheus_metrics.service: Succeeded.
Apr  5 12:37:00 kubernetes2036 systemd[1]: Finished Export confd Prometheus metrics.

==> /var/log/syslog <==

Note that the lines in syslog.1 are not even in order.

There is also a strange pattern in imuxsock inputs, probably from k8s (according to mmkubernetes actions called):
https://grafana.wikimedia.org/dashboard/snapshot/9yFb9lhc9WzMtC1LLq7iJnI5w4g95mcg

Raising to High as this bites us over and over again, eats time and makes debugging hard to impossible for some things k8s related.

Restarted manually:

Apr 05 13:40:53 kubernetes2036 systemd[1]: Stopping System Logging Service...
Apr 05 13:42:23 kubernetes2036 systemd[1]: rsyslog.service: State 'stop-sigterm' timed out. Killing.
Apr 05 13:42:23 kubernetes2036 systemd[1]: rsyslog.service: Killing process 3656430 (rsyslogd) with signal SIGKILL.
Apr 05 13:42:23 kubernetes2036 systemd[1]: rsyslog.service: Main process exited, code=killed, status=9/KILL
Apr 05 13:42:23 kubernetes2036 systemd[1]: rsyslog.service: Failed with result 'timeout'.
Apr 05 13:42:23 kubernetes2036 systemd[1]: Stopped System Logging Service.
Apr 05 13:42:23 kubernetes2036 systemd[1]: rsyslog.service: Consumed 1min 24.023s CPU time.
Apr 05 13:42:23 kubernetes2036 systemd[1]: Starting System Logging Service...
Apr 05 13:42:23 kubernetes2036 rsyslogd[3725129]: lookup table 'output_lookup' loaded from file '/etc/rsyslog.lookup.d/lookup_table_output.json' [v8.2208.0 try https://www.rsyslog.com/e/0 ]
Apr 05 13:42:23 kubernetes2036 rsyslogd[3725129]: imuxsock: Acquired UNIX socket '/run/systemd/journal/syslog' (fd 3) from systemd.  [v8.2208.0]
Apr 05 13:42:23 kubernetes2036 systemd[1]: Started System Logging Service.
Apr 05 13:42:23 kubernetes2036 rsyslogd[3725129]: omkafka_syslog_cee queue[DA]: queue files exist on disk, re-starting with 12208 messages. This will keep the disk queue file open, details: https://rainer.gerhards.net/2013/07/rsyslog-why-disk-assisted-queues-keep-a-file-open.html [v8.2208.0 try https://www.rsyslog.com/e/0 ]
Apr 05 13:42:23 kubernetes2036 rsyslogd[3725129]: fwd_centrallog1002.eqiad.wmnet:6514 queue[DA]: queue files exist on disk, re-starting with 14461 messages. This will keep the disk queue file open, details: https://rainer.gerhards.net/2013/07/rsyslog-why-disk-assisted-queues-keep-a-file-open.html [v8.2208.0 try https://www.rsyslog.com/e/0 ]
Apr 05 13:42:23 kubernetes2036 rsyslogd[3725129]: fwd_centrallog2002.codfw.wmnet:6514 queue[DA]: queue files exist on disk, re-starting with 11006 messages. This will keep the disk queue file open, details: https://rainer.gerhards.net/2013/07/rsyslog-why-disk-assisted-queues-keep-a-file-open.html [v8.2208.0 try https://www.rsyslog.com/e/0 ]
Apr 05 13:42:23 kubernetes2036 rsyslogd[3725129]: [origin software="rsyslogd" swVersion="8.2208.0" x-pid="3725129" x-info="https://www.rsyslog.com"] start
Apr 05 13:42:23 kubernetes2036 rsyslogd[3725129]: nsd_ossl: TLS Connection initiated with remote syslog server. [v8.2208.0]
Apr 05 13:42:23 kubernetes2036 rsyslogd[3725129]: nsd_ossl: Information, no shared curve between syslog client and server [v8.2208.0]
Apr 05 13:42:23 kubernetes2036 rsyslogd[3725129]: nsd_ossl: TLS Connection initiated with remote syslog server. [v8.2208.0]
Apr 05 13:42:23 kubernetes2036 rsyslogd[3725129]: nsd_ossl: Information, no shared curve between syslog client and server [v8.2208.0]
Apr 05 13:42:23 kubernetes2036 rsyslogd[3725129]: main Q:Reg: high activity - starting 1 additional worker thread(s), currently 1 active worker threads. [v8.2208.0 try https://www.rsyslog.com/e/2439 ]
Apr 05 13:42:33 kubernetes2036 rsyslog_exporter[3725952]: 2024/04/05 13:42:33 Listening on 10.192.32.169:9105
Apr 05 13:43:26 kubernetes2036 rsyslogd[3725129]: main Q:Reg: worker thread 55c28b18abe0 terminated, now 1 active worker threads [v8.2208.0 try https://www.rsyslog.com/e/2439 ]

I've preserved the logs, ps output, strace, open fd etc. in /root/rsyslog on kubernetes2036

I've chatted with @JMeybohm about this, and since for example a seemingly-related fix (https://github.com/rsyslog/rsyslog/pull/5012/commits/e8ac82e09f930bf99421cc323c24a9dbf215f9da) is present in the Debian testing repos (plus potentially other fixes) I've backported rsyslog to bullseye as 8.2404.0-1~bpo11+1. It is actually a straight backport (no changes needed) although there's a flaky imfile test, which I haven't verified it is equally flaky on sid.

At any rate, the package is built and can be found at build2001 /var/cache/pbuilder/result/bullseye-amd64/rsyslog_8.2404.0-1~bpo11+1_amd64.changes and IMHO is worth a test upgrade next week on k8s hosts; uploading to component/rsyslog-k8s should do the right thing

Change #1019278 had a related patch set uploaded (by JMeybohm; author: JMeybohm):

[operations/puppet@production] kubernetes::node: Log a line on rsyslog fd leak restarts

https://gerrit.wikimedia.org/r/1019278

Change #1019278 merged by JMeybohm:

[operations/puppet@production] kubernetes::node: Log a line on rsyslog fd leak restarts

https://gerrit.wikimedia.org/r/1019278

Mentioned in SAL (#wikimedia-operations) [2024-04-12T12:53:11Z] <jayme> updated rsyslog to 8.2404.0-1~bpo11+1 on staging-codfw and staging-eqiad k8s clusters - T357616

Mentioned in SAL (#wikimedia-operations) [2024-04-16T08:47:20Z] <jayme> updated rsyslog to 8.2404.0-1~bpo11+1 on wikikube codfw - T357616

Updating (restarting) rsyslog in wikikube codfw again led to quite a bump in events followed by a (LogstashKafkaConsumerLag) firing: (2) Too many messages in logging-codfw for group logstash7-codfw alert. Maybe restarting rsyslog cluster wide after a week is a viable strategy to determine if rsyslog is still "loosing" messages/getting stuck in some error state as in my understanding, there should not be a bump of events after a restart if everything is fine.

Mentioned in SAL (#wikimedia-operations) [2024-04-16T08:59:18Z] <jayme> updated rsyslog to 8.2404.0-1~bpo11+1 on wikikube eqiad - T357616

Mentioned in SAL (#wikimedia-operations) [2024-04-16T10:15:38Z] <jayme> updated rsyslog to 8.2404.0-1~bpo11+1 on all k8s nodes - T357616

Mentioned in SAL (#wikimedia-operations) [2024-04-17T16:14:42Z] <claime> restarted rsyslog on mw2412 - T357616

No event logs from the past 24 of either wikikube eqiad or codfw are available in logstash.

root@deploy1002:~# kubectl -n kube-system get po -o wide | grep event
eventrouter-757b95b56d-77tc7               1/1     Running   20 (6d13h ago)   26d     10.67.189.215   kubernetes1048.eqiad.wmnet   <none>           <none>

root@kubernetes1048:~# journalctl -u rsyslog | grep event
Apr 04 14:55:32 kubernetes1048 rsyslogd[679496]: imfile: poll_tree cannot stat file '/var/log/containers/eventrouter-757b95b56d-77tc7_kube-system_eventrouter-df9a003e7a8486224366f0c0aa5a3609fc419733941f597c21206230890669ee.log' - ignored: No such file or directory [v8.2208.0]
# This is a days old message!
# Logfile wise, everything seems fine...
root@kubernetes1048:~# ls -la /var/log/containers/eventrouter-757b95b56d-77tc7_kube-system_eventrouter-*
lrwxrwxrwx 1 root root 110 Apr 16 21:50 /var/log/containers/eventrouter-757b95b56d-77tc7_kube-system_eventrouter-881aa6b63dd58132c12667308c0bca76a57656b593b2969da84dd42074d3a76d.log -> /var/log/pods/kube-system_eventrouter-757b95b56d-77tc7_00a96536-2799-400b-b641-c80f917f0f4f/eventrouter/20.log
lrwxrwxrwx 1 root root 110 Apr 16 21:49 /var/log/containers/eventrouter-757b95b56d-77tc7_kube-system_eventrouter-bf90863d7d2bafc72a440268950ef77ebfb8cf1e6e315aa10ebb6874d0446f49.log -> /var/log/pods/kube-system_eventrouter-757b95b56d-77tc7_00a96536-2799-400b-b641-c80f917f0f4f/eventrouter/19.log
root@kubernetes1048:~# ls -la /var/log/pods/kube-system_eventrouter-757b95b56d-77tc7_00a96536-2799-400b-b641-c80f917f0f4f/eventrouter/*.log
lrwxrwxrwx 1 root root 165 Apr 16 21:49 /var/log/pods/kube-system_eventrouter-757b95b56d-77tc7_00a96536-2799-400b-b641-c80f917f0f4f/eventrouter/19.log -> /var/lib/docker/containers/bf90863d7d2bafc72a440268950ef77ebfb8cf1e6e315aa10ebb6874d0446f49/bf90863d7d2bafc72a440268950ef77ebfb8cf1e6e315aa10ebb6874d0446f49-json.log
lrwxrwxrwx 1 root root 165 Apr 16 21:50 /var/log/pods/kube-system_eventrouter-757b95b56d-77tc7_00a96536-2799-400b-b641-c80f917f0f4f/eventrouter/20.log -> /var/lib/docker/containers/881aa6b63dd58132c12667308c0bca76a57656b593b2969da84dd42074d3a76d/881aa6b63dd58132c12667308c0bca76a57656b593b2969da84dd42074d3a76d-json.log
root@kubernetes1048:~# ls -la /var/lib/docker/containers/bf90863d7d2bafc72a440268950ef77ebfb8cf1e6e315aa10ebb6874d0446f49/bf90863d7d2bafc72a440268950ef77ebfb8cf1e6e315aa10ebb6874d0446f49-json.log /var/lib/docker/containers/881aa6b63dd58132c12667308c0bca76a57656b593b2969da84dd42074d3a76d/881aa6b63dd58132c12667308c0bca76a57656b593b2969da84dd42074d3a76d-json.log
-rw-r----- 1 root root 75832572 Apr 23 11:37 /var/lib/docker/containers/881aa6b63dd58132c12667308c0bca76a57656b593b2969da84dd42074d3a76d/881aa6b63dd58132c12667308c0bca76a57656b593b2969da84dd42074d3a76d-json.log
-rw-r----- 1 root root 62518701 Apr 16 21:49 /var/lib/docker/containers/bf90863d7d2bafc72a440268950ef77ebfb8cf1e6e315aa10ebb6874d0446f49/bf90863d7d2bafc72a440268950ef77ebfb8cf1e6e315aa10ebb6874d0446f49-json.log

# I do see a couple of errors from imfile that are new to me:
root@kubernetes1048:~# journalctl -u rsyslog | grep error
Apr 23 09:39:55 kubernetes1048 rsyslogd[3704128]: imfile: internal error? inotify provided watch descriptor 3102 which we could not find in our tables - ignored [v8.2404.0 try https://www.rsyslog.com/e/2175 ]
# These are for 3 fd's in total (3108, 3105, 3102), each message is repeated exactly 11 times, all within the same second.

More or less same situation in codfw but without the rsyslog error messages. The fd leak has not kicked in in both cases.
Restarting rsyslog immediately flushes all the old events to logstash.

Change #1023417 had a related patch set uploaded (by JMeybohm; author: JMeybohm):

[operations/puppet@production] Revert: kubernetes::node restart rsyslog if too many fd's are blocked by inotify

https://gerrit.wikimedia.org/r/1023417

Change #1023422 had a related patch set uploaded (by Filippo Giunchedi; author: Filippo Giunchedi):

[operations/puppet@production] toil: add rsyslog_imfile_remedy

https://gerrit.wikimedia.org/r/1023422

Mentioned in SAL (#wikimedia-operations) [2024-04-23T17:09:17Z] <inflatador> bking@mw1461 "restart rsyslog to reclaim fds T357616"

Change #1023417 merged by JMeybohm:

[operations/puppet@production] Revert: kubernetes::node restart rsyslog if too many fd's are blocked by inotify

https://gerrit.wikimedia.org/r/1023417

Change #1023806 had a related patch set uploaded (by Filippo Giunchedi; author: Filippo Giunchedi):

[operations/puppet@production] kubernetes: add rsyslog imfile remedy to nodes

https://gerrit.wikimedia.org/r/1023806

Change #1023422 merged by Filippo Giunchedi:

[operations/puppet@production] toil: add rsyslog_imfile_remedy

https://gerrit.wikimedia.org/r/1023422

Change #1023806 merged by Filippo Giunchedi:

[operations/puppet@production] kubernetes: add rsyslog imfile remedy to nodes

https://gerrit.wikimedia.org/r/1023806

The bandaid is in place (restart rsyslog.service every 4 hours, the 4 is a magic number, it can be tweaked). Let's see how we go with this in place while a better solution is found