As shown at https://grafana-admin.wikimedia.org/dashboard/db/navigation-timing under "Hit Rate" (https://grafana-admin.wikimedia.org/dashboard/db/navigation-timing?panelId=18&fullscreen).
On the client-side we verify the data is complete and valid. But somewhere along the way a large portion of the data appears to be lost. Over 80% for some properties.
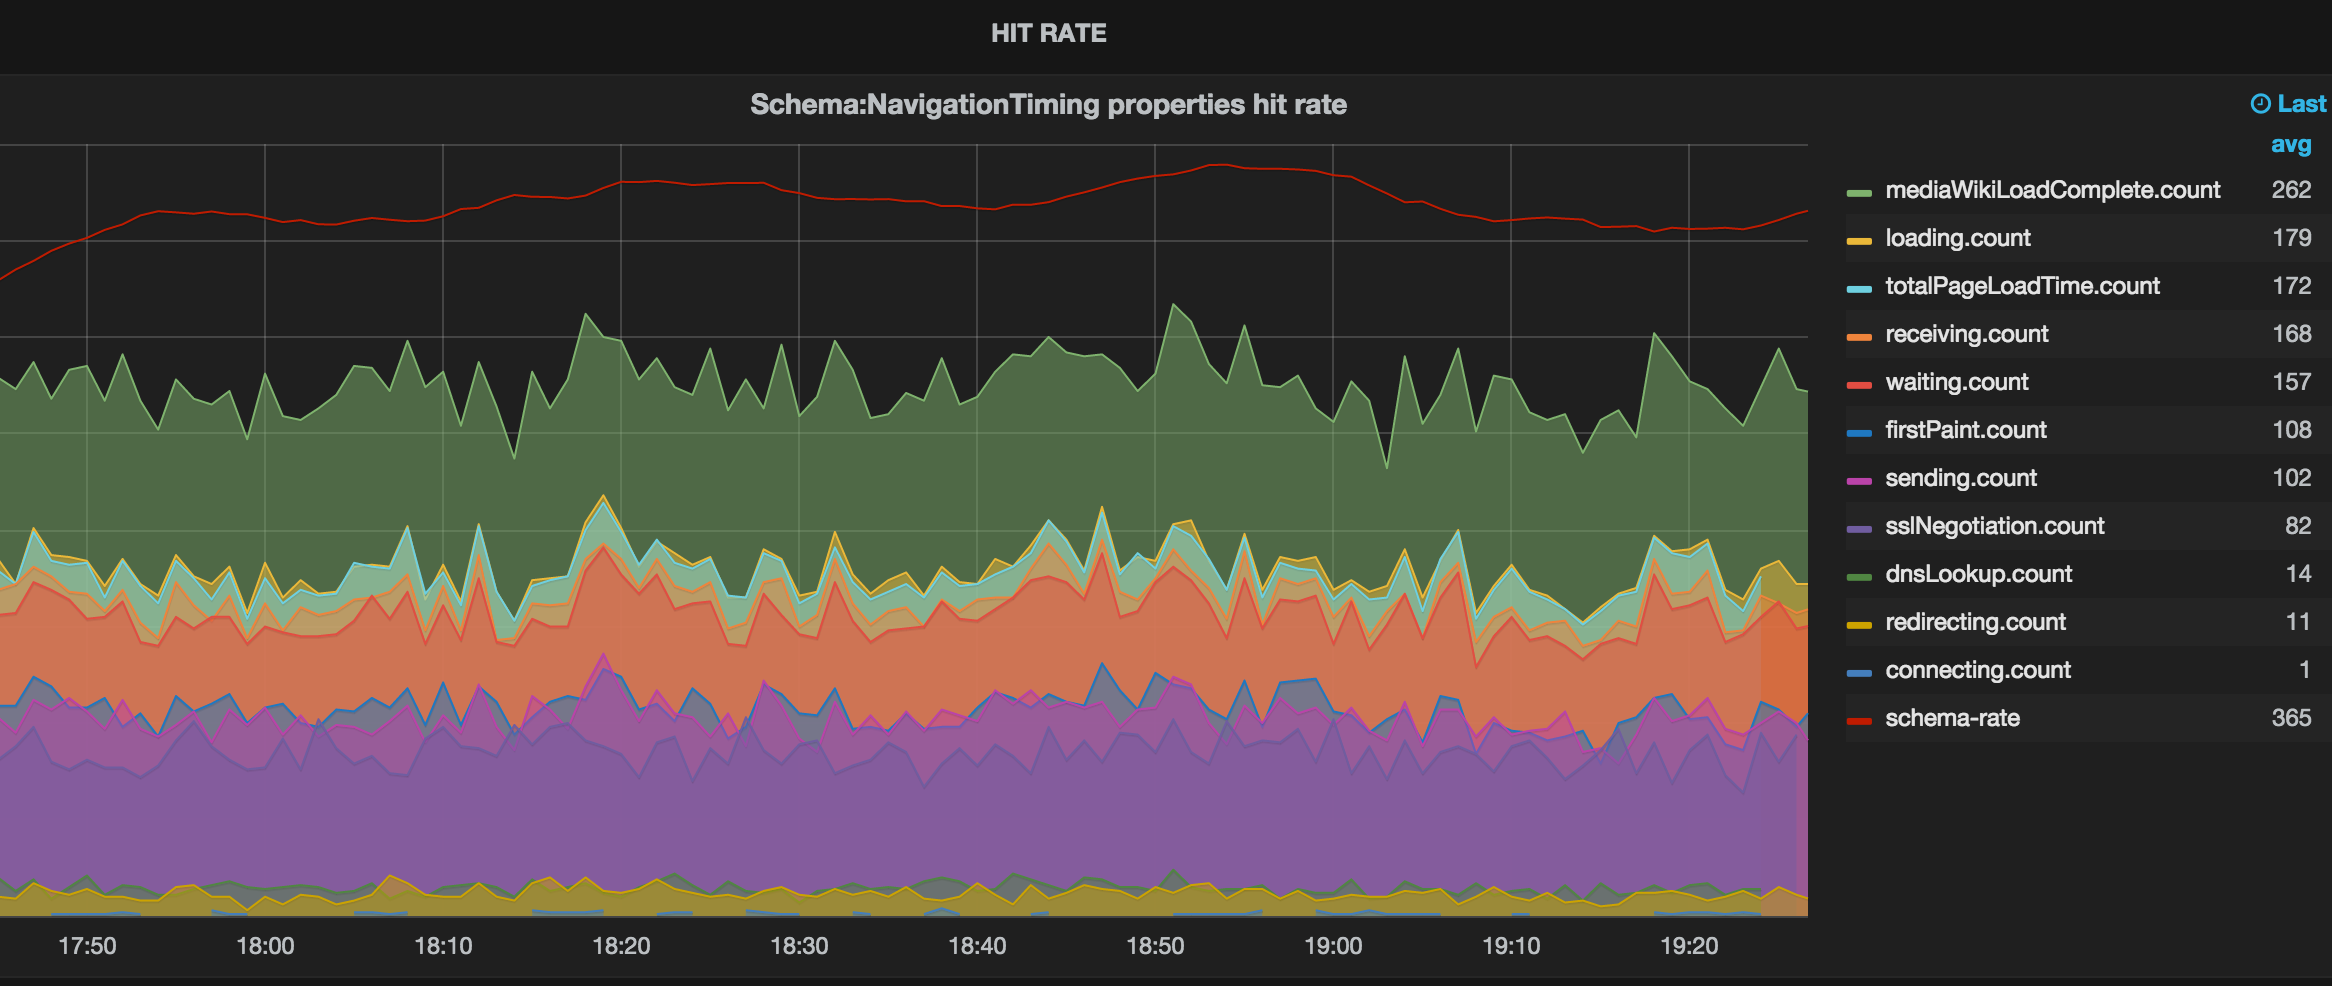
There are three gaps:
- Between "schema-rate" (350x) and "mediaWikiLoadComplete" (250x). In ext.navigationTiming.js, mediaWikiLoadComplete is supposed to be unconditional, so I'm not sure where this 1/3rd gap comes from.
- Between "mediaWikiLoadComplete" (250x) and "loading" (170x). This is gap indicates missing browsers support for the Navigation Timing API. This and other NavTiming properties are only reported for supported browsers and only for regular page navigations (e.g. not reload) so this gap is expected.
- Between "loading" and all other NavTiming properties.
This task is about gap #3.
The number of events containing connectStart/End (aka "sending") is only half that of responseStart/responseEnd ("receiving").
Even the Start and End of a single pair is inconsistent (e.g loadEventStart "loading" and loadEventEnd "totalPageLoadTime").
See also: