Page MenuHomePhabricator

Refactor Navigation Timing gathering to produce reliable stackable measures (aka "frontend.navtiming2")
Closed, ResolvedPublic

Description

Most of the required parts for this are already in place but @Peter and I found it somewhat untrustworthy.

Some metrics are missing, some are transformed to relative offsets between two points, some are aggregated, some zero values are ignored in questionable ways. It's hard to get a complete picture.

  • Move to deltas and "start" values for our metrics.
  • Have the server fragment our frontend properties by browser_family using the ua-parser library server-side. We can wildcard over this for general graphs, but it allows us to draw a more realistic picture for individual browsers (and help pinpoint problems with specific browsers), since median of everything is not very representative of real users.
  • Don't ignore non-compliant browsers that report properties out of order. Even quite recently Firefox and Chrome have both had bugs with compliancy. (e.g. https://bugzilla.mozilla.org/1123920). So if the browser is non-compliant, we'd emit some kind light-weight error increment beacon. Perhaps with statsv. This will help us keep track of how much data we're excluding.
In T99060#1299940, @ori wrote:

An idea from GitHub's engineering blog: use a stacked graph to represent navigation timing metric.

http://githubengineering.com/browser-monitoring-for-github-com/

Being able to render a graph like this would be quite valuable as well.

d9892654-ff05-11e4-8d62-340091dada79.png (793×1 px, 308 KB)

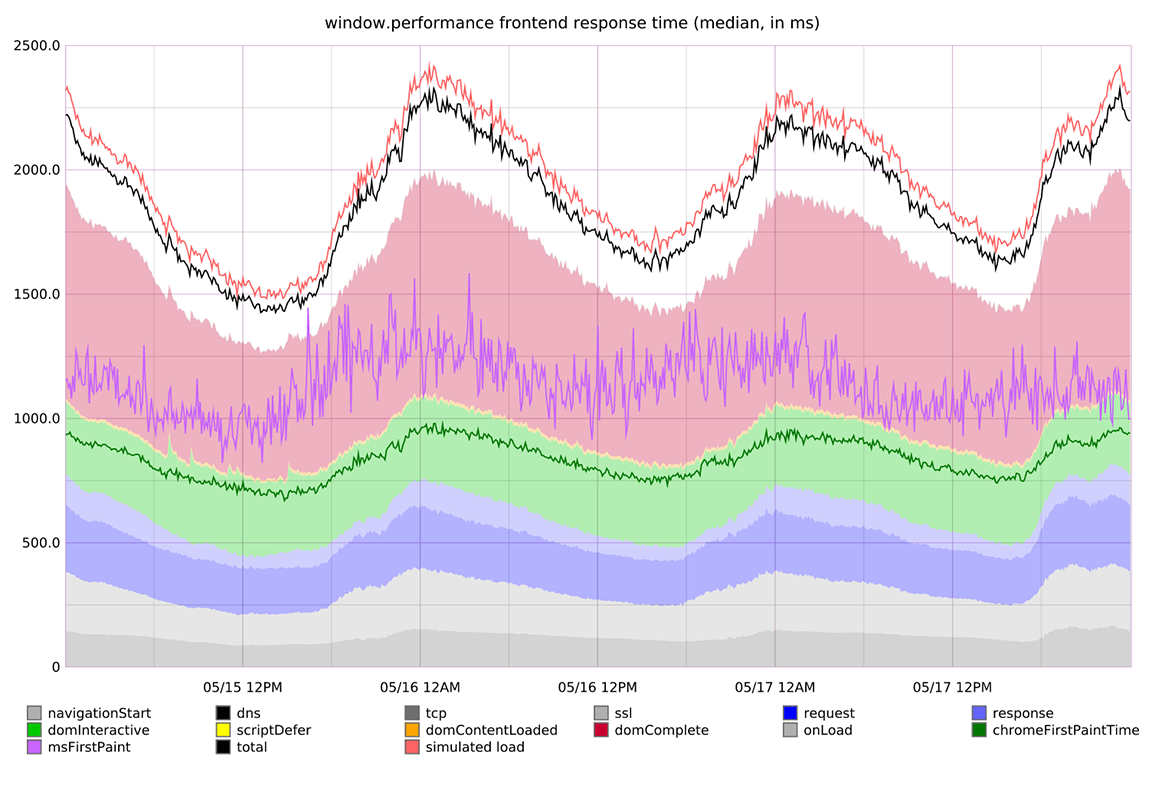
And to have the dashboard feature sub-views for individual browsers because the overall picture is somewhat skewed as it is based on medians of individual properties. It does not represent the experience of any individual user (per se).

High-level plan

From T104902#3253227, and T104902#3746563:

  • Server will not filter out zero values.
  • Server will not exclude values based on an upper bound. – T104902#3746563
  • Server will apply remaining filters to entire events, not individual values. If one of the values is invalid, discard the event as a whole.
  • Server will record values to Graphite as relative to fetchStart, instead of navigationStart.
  • Server will introduce new metrics for deltas, to make stacking more accurate. (e.g. "dns", "request", "response", etc. in addition to dnsStart/End, requestStart/End, etc.)
  • (Last step) Clean up client-side code to only send what's needed for navtiming2.

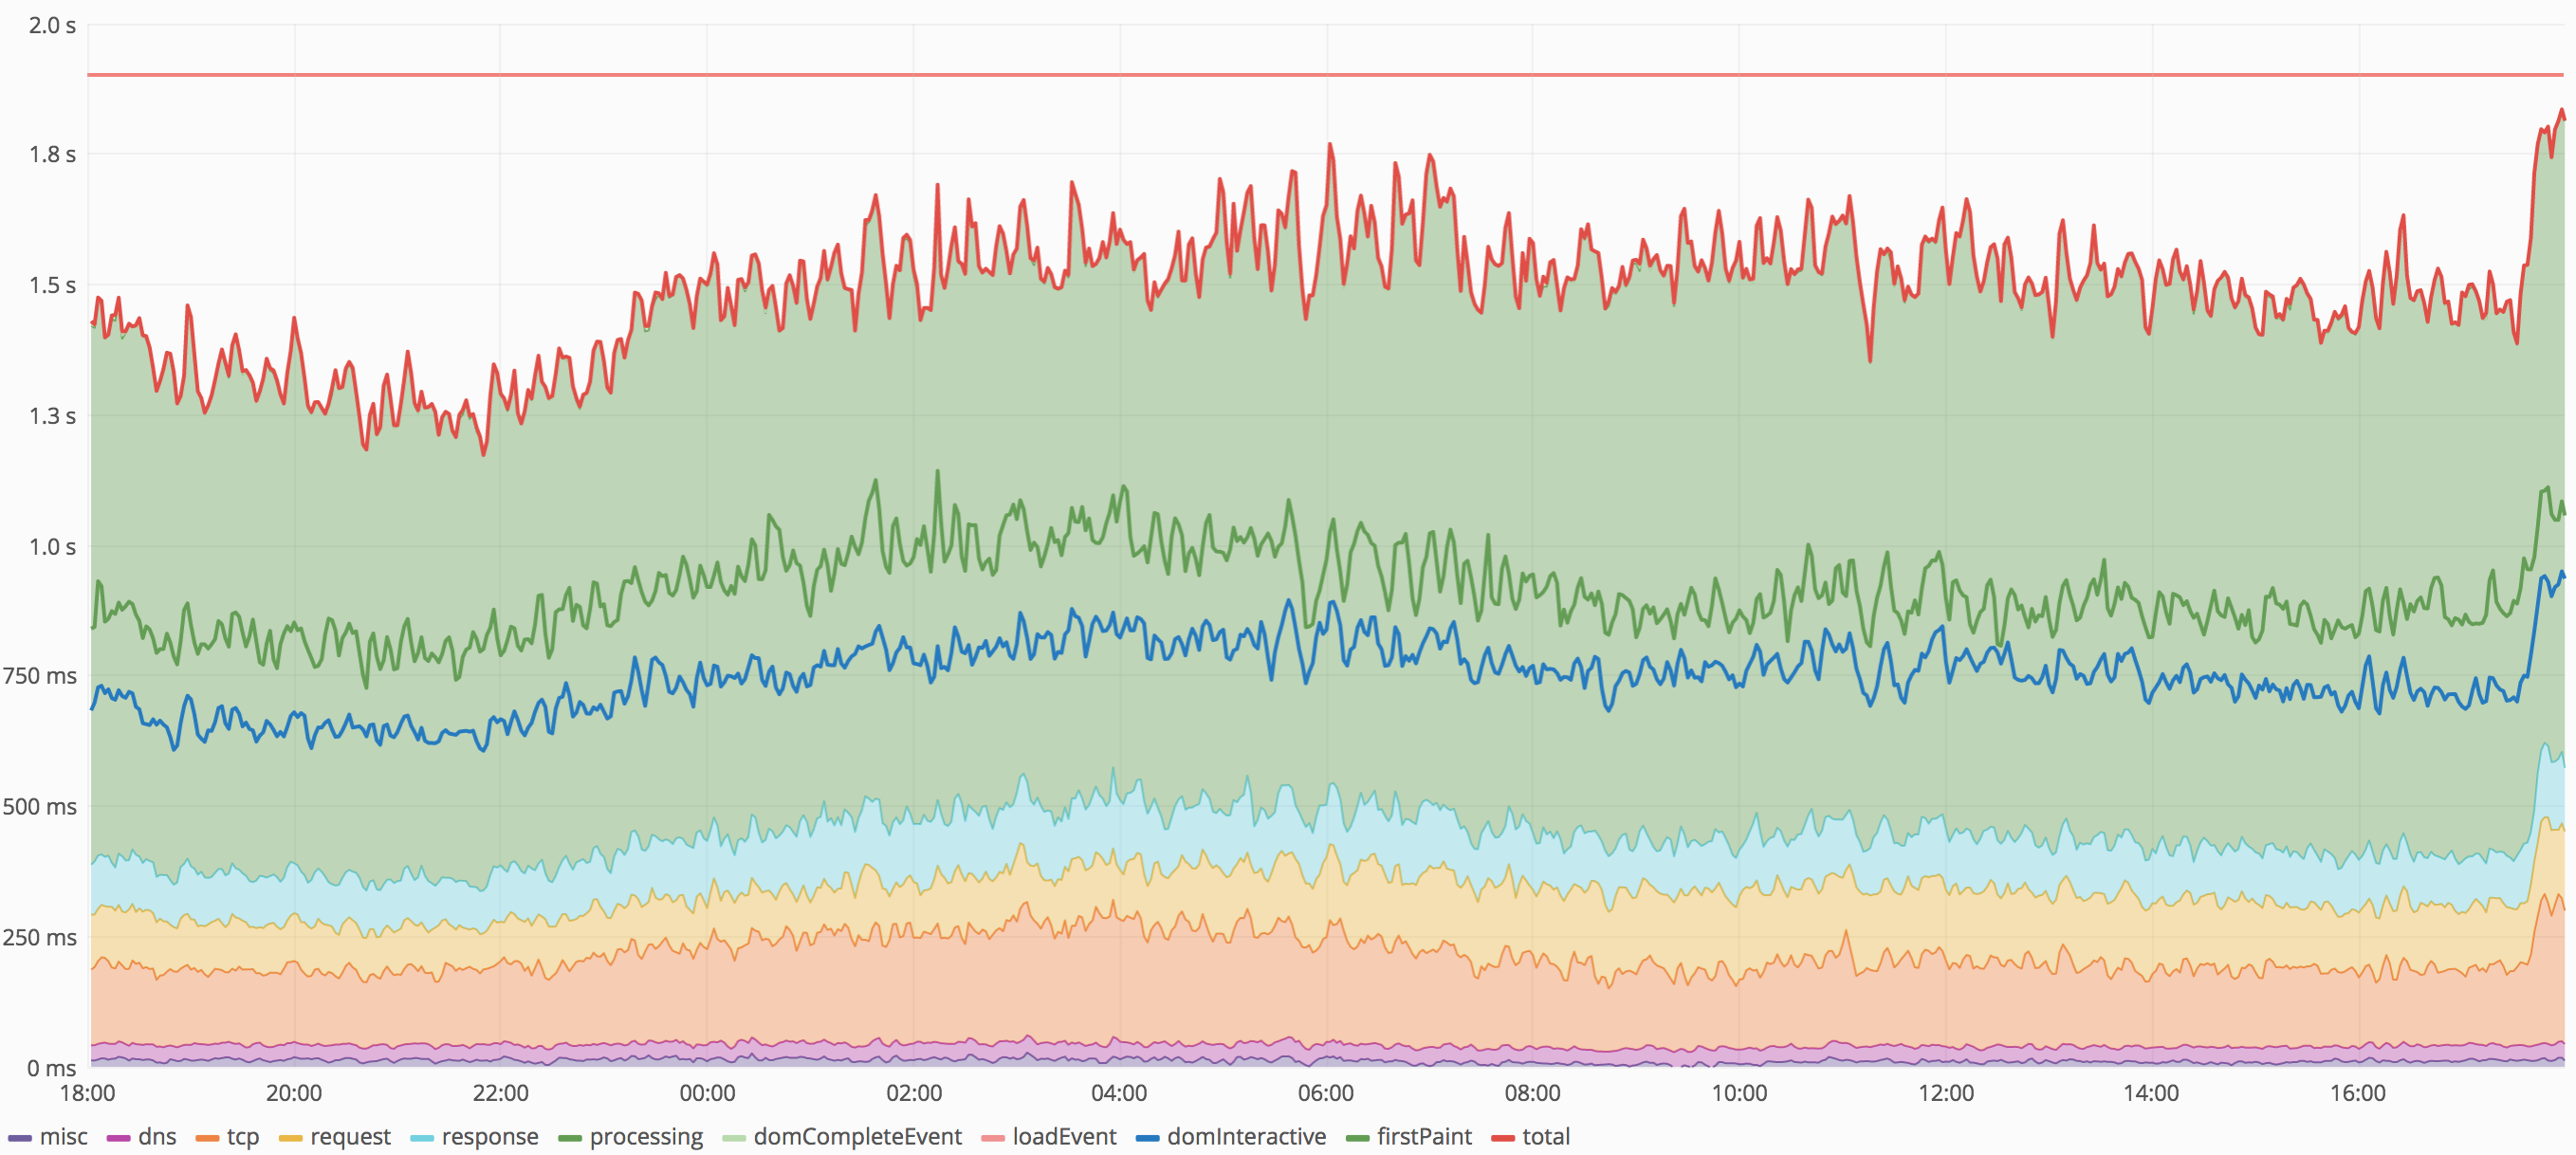
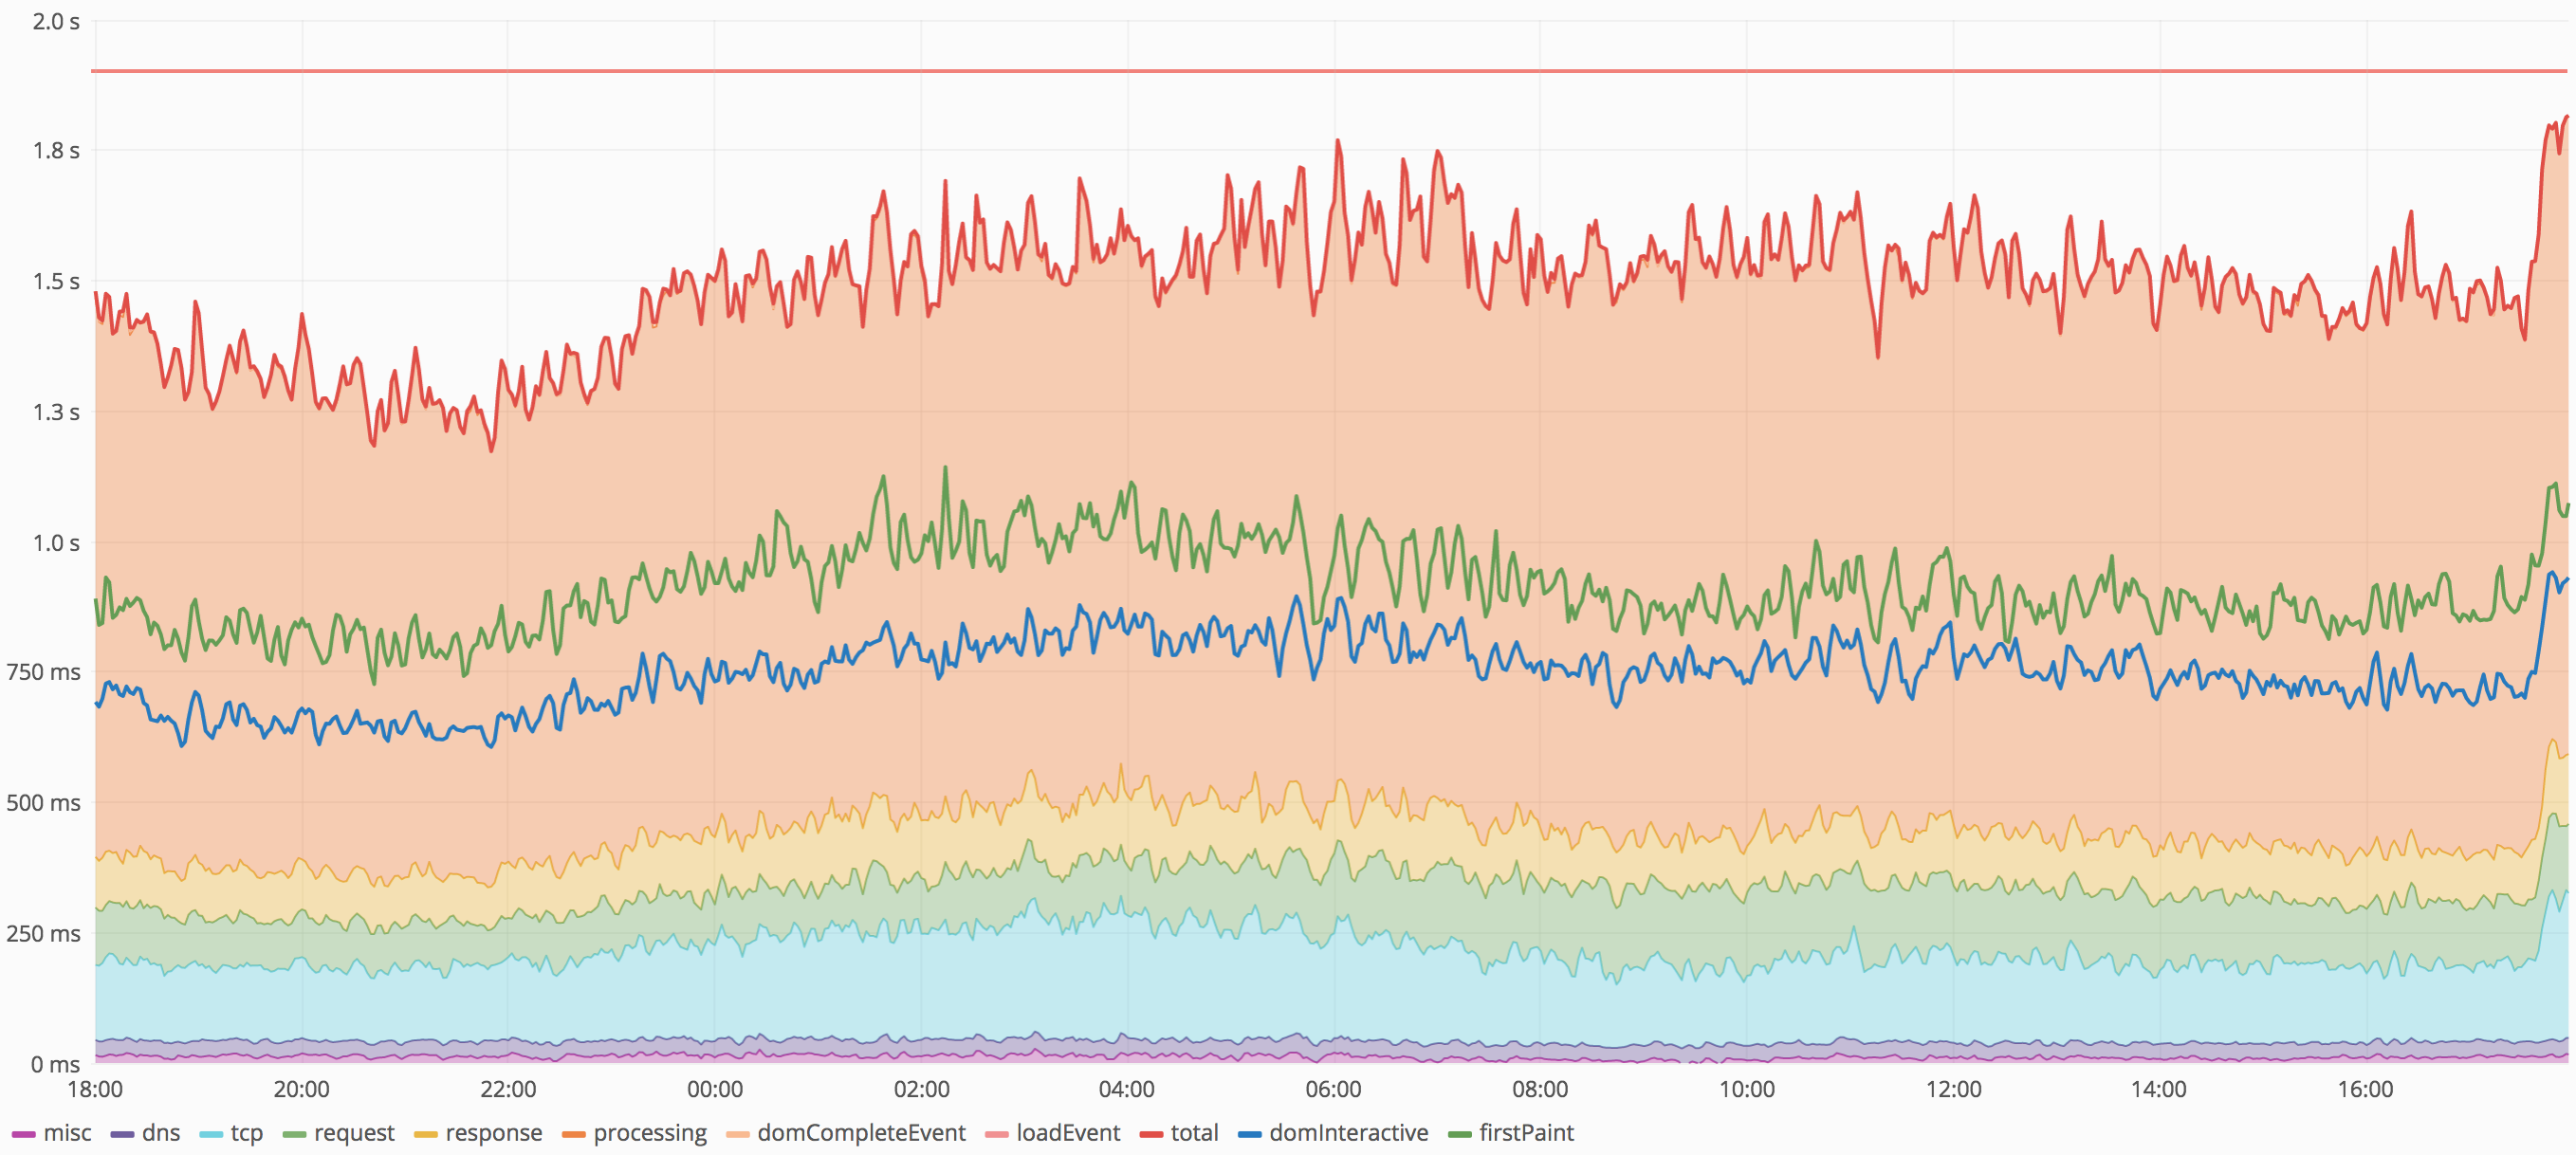
frontend.navtiming2 issues

  • Stacked values don't match the total from loadEventEnd – T178479
  • "dns" is usually zero? – T178479#3699302
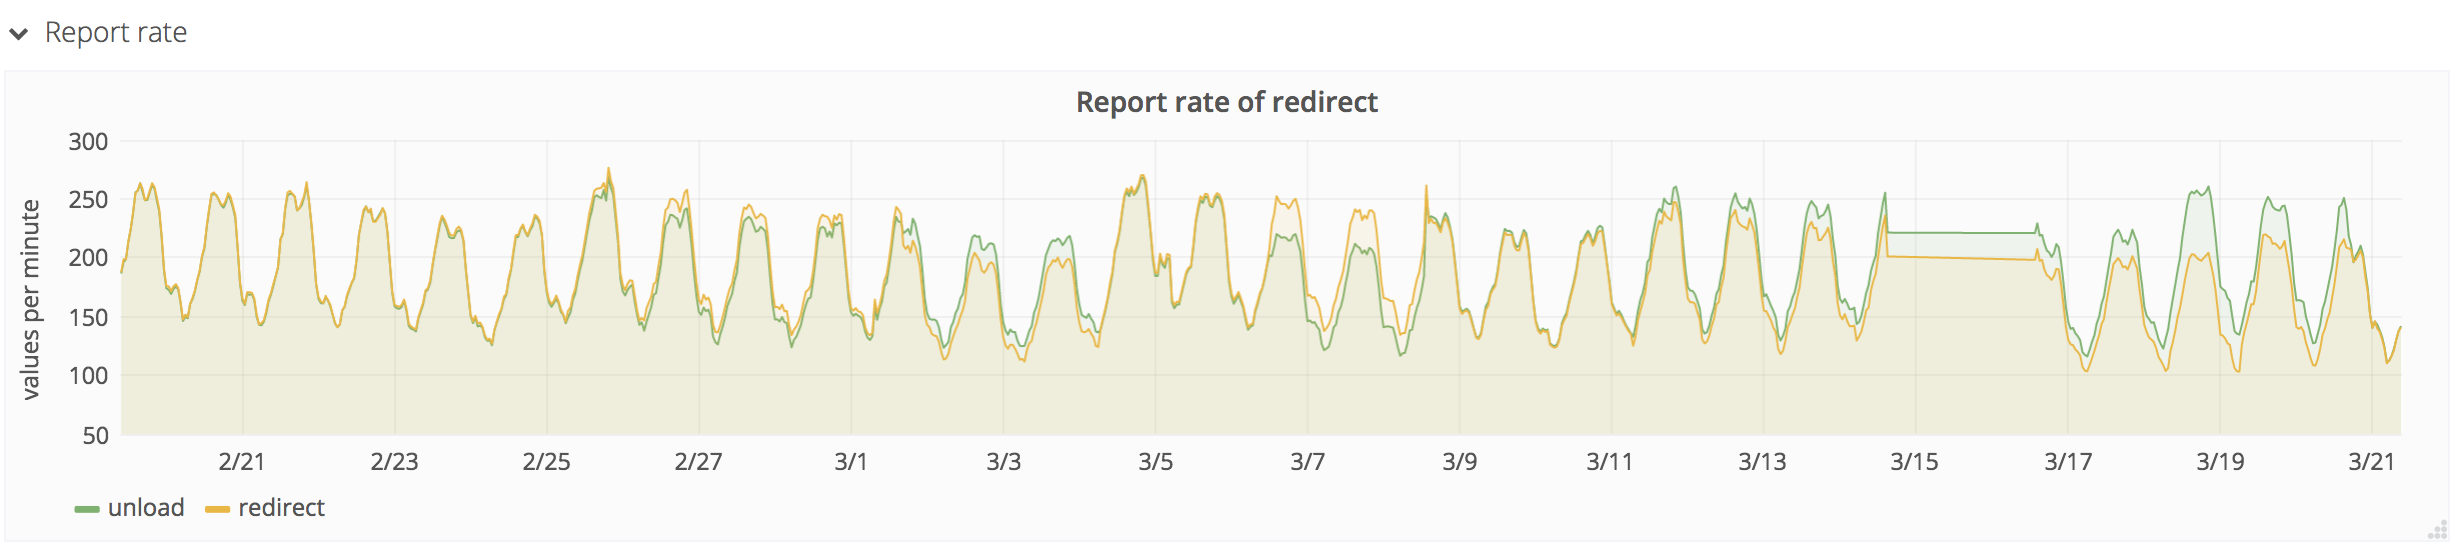
  • "unload" correctness – T178479
  • "redirecting" correctness – T178479
  • Make sure mediaWikiLoadEnd or mediaWikiLoadComplete is working - T180598

Related Objects

Event Timeline

There are a very large number of changes, so older changes are hidden. Show Older Changes

Synced with Timo last Friday and I will start with this now. A couple of things when I started to look into it:

(Final optimisation) Compute deltas client-side instead of server-side to make schema and event packet smaller.

Not sure about that, isn't better to send the full Navigation Timings to the backend and then do all the handling there? Thinking we want the (correct) deltas but we will still want some metrics compared with fetch start and not deltas, so we can get the median/p* value for that? We can build a dashboard using the deltas but to be able to act on changes as we do in the alerts we want median/p* for domInteractive/domLoaded /fullyLoaded etc?

Server will report absolute values relative to fetchStart instead of navigationStart.

Today we do that in in the Navigation Timing extension, so to make everything run in parallel we need to send everything twice for a while or first move to calculate everything in the backend as a first step (sending absolute values). @Krinkle what do you prefer or is it a better way to do it?

I started to change the backend and what about keep naming the metrics following https://www.w3.org/TR/navigation-timing/#process -
we would have deltas for:

  • redirect
  • appCache
  • dns
  • tcp
  • request
  • response
  • processing (do we want to split this one into moar?)
  • onLoad

and that means we need to send more data serverside but that is kind of good I think.

In the backend code we only have a test case for the user agent, would be good to have a test case that at least go through the code path I'm changing, I'll look else I pair up with @Gilles when he is back.

Server will report absolute values relative to fetchStart instead of navigationStart.

ah it was simpler than I thought; we send fetchStart today so lets used use that. let me commit tomorrow and you can have a first look.

In the backend code we only have a test case for the user agent, would be good to have a test case that at least go through the code path I'm changing [..]

Aye, my thoughts exactly :) I had actually already started on this the day before:

[operations/puppet@production] webperf: Add unit tests for schema handlers and stat dispatching
https://gerrit.wikimedia.org/r/372577

I actually learned a lot about Python in writing this commit. While it appears to work, I'm certainly very open to feedback on whether it makes sense (still not quite sure when to use which data type), and whether there might be any performance issue with this approach due to the introduction of iterators in the production code.

Yes you are always one step ahead :) I've most things ready by wait until the tests lands, so I can add my own make sure I don't break anything. Thanks for the help @Krinkle

Change 372577 merged by Ottomata:
[operations/puppet@production] webperf: Add unit tests for schema handlers and stat dispatching

https://gerrit.wikimedia.org/r/372577

Change 375345 had a related patch set uploaded (by Phedenskog; owner: Phedenskog):
[operations/puppet@production] Make values stackable

https://gerrit.wikimedia.org/r/375345

Change 376059 had a related patch set uploaded (by Phedenskog; owner: Phedenskog):
[mediawiki/extensions/NavigationTiming@master] Add more metrics to produce reliable stackable measures.

https://gerrit.wikimedia.org/r/376059

Change 377454 had a related patch set uploaded (by Krinkle; owner: Phedenskog):
[mediawiki/extensions/NavigationTiming@wmf/1.30.0-wmf.17] Add unload delta to make reliable stackable metrics.

https://gerrit.wikimedia.org/r/377454

Change 376059 merged by jenkins-bot:
[mediawiki/extensions/NavigationTiming@master] Add unload delta to make reliable stackable metrics.

https://gerrit.wikimedia.org/r/376059

Change 377454 merged by jenkins-bot:
[mediawiki/extensions/NavigationTiming@wmf/1.30.0-wmf.17] Add unload delta to make reliable stackable metrics.

https://gerrit.wikimedia.org/r/377454

Mentioned in SAL (#wikimedia-operations) [2017-09-14T16:59:42Z] <krinkle@tin> Synchronized php-1.30.0-wmf.17/extensions/NavigationTiming: T104902 (duration: 01m 00s)

Change 375345 merged by Elukey:
[operations/puppet@production] navtiming.py: Make values stackable

https://gerrit.wikimedia.org/r/375345

Started to create the new stackable version but we are missing processing and response time. We got that in the example data but in the output the test case so there must be bug there.

Change 382643 had a related patch set uploaded (by Phedenskog; owner: Phedenskog):
[operations/puppet@production] Fixed typeo for responseEnd property.

https://gerrit.wikimedia.org/r/382643

Change 382643 merged by Herron:
[operations/puppet@production] webperf: Fixed typeo for navtiming2 responseEnd property

https://gerrit.wikimedia.org/r/382643

@Peter I've updated the old stacked graph to merge "domInteractive" (responseEnd>domInteractive) and "domComplete" (domInteractive>domComplete) into one metric "processing" (responseEnd>domComplete) to match your new one.

Also played around with some colour changes:

PreviousCandidate 1Candidate 2 (current)
Screen Shot 2017-10-10 at 19.00.39.png (1×2 px, 659 KB)
Screen Shot 2017-10-10 at 19.00.40.png (1×2 px, 729 KB)
Screen Shot 2017-10-10 at 19.00.41.png (1×2 px, 732 KB)
(No repeats of the same color, less contrasting colors)Rainbow?

Not sure what's best or if it matter :)

Also added an extra overlay line: "domInteractive", in addition to "total" and "firstPaint". This makes up for the fact that "processing" was merged into one big stack so that we can still see at which point document-ready happens ($.ready/readyState=interactive/domContentLoaded). And I've made the colors match those of the Chrome DevTools (paint=green, dom-ready=blue, load/total=red).

From todays meeting: redirecting and unload is reported incorrect, we need to report the zeros from the client too to make medians etc correct.

@Peter I added navtiming2 as alternative source on https://grafana.wikimedia.org/dashboard/db/navigation-timing. With that, I noticed the mediaWikiLoadComplete metric is missing for navtiming2.

I believe this is because the navtiming2 code is looking for mediaWikiLoadStart/End instead of mediaWikiLoadComplete, which does not exist anymore (the property exists in Graphite due to a delta-trial we did in 2015, but not used now). The coded mediaWikiLoad case in the python code is not triggered.

For continuity, I think it'd be nice to keep reporting mediaWikiLoadComplete as one of the absolute metrics (like responseStart, firstPaint and loadEventEnd).

Later, as part of T160315, we can then re-introduce the mediaWikiLoadEnd metric in the way you proposed (from fetchStart). But that will need a change in the client side first to report it. Which we may want to save for after finishing navtiming2 as otherwise the beacon gets larger again. If we first finish navtiming2 and remove the unused fields, we'll clear up some of the 2K quota for the beacon.

Speaking of the quota, I think we're artificially limiting ourselves by using EventLogging, which relies on the URL only to transmit data. SendBeacon supports a payload in addition to the URL. From what I can gather Chrome is the only one that limits its size, at 64k. It seems like the 64k quota is shared by the different sendBeacon calls for a given pageload. That's still plenty of legroom compared to the current limit.

We could either improve EventLogging to make it look in the payload if the URL is empty, and have the client-side code of EventLogging switch to the payload as soon as the data is greater than 2k. Or we could have a separate intake mechanism for navtiming2, that doesn't rely on EventLogging.

@Gilles The limitation is not EventLogging but Varnish. EventLogging consumes and produces via Kafka. Right now, a central piece of that stack is that Varnish has no backend server for /beacon/event. Instead, it blindly responds with HTTP 204 No Content, and drops the request.

In a nutshell: Similar to the varnishrls and varnishmedia deamons, there is varnishkafka to collect webrequest stats. The shared memory buffer from Varnish doesn't hold on to entire POST bodies, only the meta data (including request urls).

Making it handle POST bodies would require creating a new backend service to handle each incoming Varnish beacon request in real-time and store it in Kafka.

Worth considering if we're really stuck with that problem. These requests aren't cached and with a new service like what you've described, I expect that the bottleneck (if any) will still be kafka. I get that piggy-backing on the shared memory buffer allowed us to avoid writing a new service, but I don't expect said service to be that different from the existing daemons, which are already services with uptime of their own.

@Peter In https://gerrit.wikimedia.org/r/#/c/390061/4 I realised that our is_sane for navtiming (v1) is actually not being applied to the continent/country breakdown.

In addition, we already know (and was a conscious decision) that the coal data also doesn't discard any values based on any threshold.

I'm thinking if it makes sense to just remove the upper bound entirely? I'm having trouble finding any reason for it to stay. We various data-compliance filters already, and we aggregate into medians and percentiles. That already cuts out a lot. Drawing an upper bound on what we include seems counter-intuitive. But I'm open to hearing reasons :-) If we do decide to remove the upper bound, navtiming2 might be a good place to starting doing it so that we have a clean cut in the future (if/when we switch).

@Krinkle Yep totally agree let us skip that.

Change 391496 had a related patch set uploaded (by Phedenskog; owner: Phedenskog):
[operations/puppet@production] Skip upper limits for values in navtiming2

https://gerrit.wikimedia.org/r/391496

Make sure mediaWikiLoadEnd or mediaWikiLoadComplete is working

Yep it is a miss match in navtiming2 what is sent from the user (mediaWikiLoadComplete) but the code expect mediaWikiLoadEnd and mediaWikiLoadStart (and then calculate the newly named mediaWikiLoad). Let me fix that.

Change 391496 merged by Dzahn:
[operations/puppet@production] webperf: Skip upper limits for values in navtiming2

https://gerrit.wikimedia.org/r/391496

TODO: Add misc to navtiming2 for gaps between metrics such as connectEnd-responseStart.

Issue "navtiming2.dns is usually zero" confirmed fixed.

Metricnavtiming.dnsnavtiming2.dns
median~24-34ms~0.1-1.2ms
p95~900ms~250ms
p99~4s~4s
rate60 - 110/min120-200/min
  • The lower median/p95 is expected given we now include values that round down to 0.
  • The higher report rate is expected, given we now include zeros.
  • The report navtiming2.dns sample rate now matches the sample report rate navtiming.loadEventEnd, which also indicates that it isn't too high (e.g. fabricating zeros for non-navtiming clients, as we saw earlier by accident).

Change 420813 had a related patch set uploaded (by Phedenskog; owner: Phedenskog):
[mediawiki/extensions/NavigationTiming@master] Collect Navigation Timing gaps

https://gerrit.wikimedia.org/r/420813

Change 420831 had a related patch set uploaded (by Phedenskog; owner: Phedenskog):
[operations/puppet@production] Performance: Collect Navigation Timing gaps

https://gerrit.wikimedia.org/r/420831

Change 420813 merged by jenkins-bot:
[mediawiki/extensions/NavigationTiming@master] Collect Navigation Timing gaps

https://gerrit.wikimedia.org/r/420813

Hmm something is wrong with the navtiming2, @Krinkle and me looked it through last night and I cannot make the numbers match? The idea with navtiming2 is that we should either we should send all metrics or no metrics at all.

For example looking at the code: https://github.com/wikimedia/mediawiki-extensions-NavigationTiming/blob/master/modules/ext.navigationTiming.js#L153-L170 it looks like we should always send redirecting and unload (if we don't have it, we send a 0).

But when I look at the graphs comparing the sample rate of those values it seems that they are drifting away from each other:

Screen Shot 2018-03-21 at 10.22.37 AM.png (552×2 px, 278 KB)

We have days where they are perfectly inline with each other but then have times where we have more redirects and sometimes more unload, so there must be a bug somewhere or am I doing something wrong?

Change 424595 had a related patch set uploaded (by Krinkle; owner: Krinkle):
[operations/puppet@production] navtiming: Remove broken 'rendering' and 'pageSpeed' metrics

https://gerrit.wikimedia.org/r/424595

looking at the code: https://github.com/wikimedia/mediawiki-extensions-NavigationTiming/blob/master/modules/ext.navigationTiming.js#L153-L170 it looks like we should always send redirecting and unload (if we don't have it, we send a 0).

Indeed.

But when I look at the graphs comparing the sample rate of those values it seems that they are drifting away from each other:

Screen Shot 2018-03-21 at 10.22.37 AM.png (552×2 px, 278 KB)

The server-side also doesn't provide a clue (src). No idea what the cause could be!

I'd recommend maybe digging through some eventlogging directly to see if we can find a beacon that has one of the values missing in the JSON beacon. Because even though our client is not supposed to send one without the other (given we set them unconditionally), the schema and our server-side processor does allow one to be missing (given all fields are optional). So that would be my only explanation - unless something gets corrupted in statsd or graphite.

I still don't know why they would be missing in the beacon, but maybe it'll explain itself once we find a complete sample.

Change 424595 merged by BBlack:
[operations/puppet@production] navtiming: Remove broken 'rendering' and 'pageSpeed' metrics

https://gerrit.wikimedia.org/r/424595

Change 420831 abandoned by Krinkle:
webperf: Collect Navigation Timing gaps

Reason:
To be resubmitted in performance/coal.git (code has diverged now).

https://gerrit.wikimedia.org/r/420831

I just want to confirm a couple of the assumptions that I've been making about this ticket:

  • Every incoming event is normalized such that fetchStart is 0; we ignore the unload delta and the redirecting delta if they exist
  • It's expected that if you sum these items, the value that you'll end up with is the same as loadEventEnd:
    • dns
    • dns-tcp gap (that is, the difference between domainLookupEnd and connectStart)
    • tcp
    • tcp-request gap (that is, the difference between connectEnd and requestStart)
    • request
    • response
    • processing
    • processing-onload gap (the difference between domComplete and loadEventStart)
    • onload

Am I off on either of those?

Looks right to me!

In my own words:

  • The client collects all offsets relative to navigationStart. This is mostly for compatibility with navtiming1 in Graphite, and because it's hard to change in non-disruptive way also for continuity in Kafka/Coal/MySQL/Hadoop.
  • The processor (for navtiming2 namespace in Graphite) subtracts fetchStart from these offsets.
  • On the performance-metrics dashboard we stack all the navtiming2 deltas, except for those that capture events before fetchStart (unload, redirecting).

[operations/puppet@production] Performance: Collect Navigation Timing gaps
https://gerrit.wikimedia.org/r/420831

We haven't applied this yet. Would be interesting to see if this perhaps closes the "gap".

https://www.w3.org/TR/navigation-timing-2/ the spec doesn't really make any recommendation about gaps between these:

https://www.w3.org/TR/navigation-timing-2/#processing-model
https://www.w3.org/TR/navigation-timing-2/#dom-performancenavigationtiming

IMHO if things like connectEnd and requestStart were meant to be strictly equal, the spec would say so. The OS and the browser are constantly multitasking, I don't think it should be surprising that there are small gaps between these blocks.

There are situations defined by the spec where there are no gaps for some values, for instance if the DNS cache is warm and there's already a connection, domainLookupStart, domainLookupEnd, connectStart and connectEnd will all be equal to fetchStart. But in situations where "stuff happens", there's no guarantee that domainLookupEnd == connectStart.

Yeah, the spec allows for gaps to exist, and that's fine. If adding the collected gaps to the graph fixes the issue, then that would be a good outcome in my opinion.

As part of this task, though, we've questioned many parts of our infrastructure relating to navtiming and found (and fixed) numerous bugs that also contributed to the metrics not adding up in the graph.

The realisation that there are also gaps in the original data from Navigation Timing API has merely been the most recent finding. It's not guaranteed that it will be the last (although I certainly hope so).

Change 434439 had a related patch set uploaded (by Phedenskog; owner: Phedenskog):
[performance/navtiming@master] Collect Navigation Timing gaps

https://gerrit.wikimedia.org/r/434439

Change 434439 merged by jenkins-bot:
[performance/navtiming@master] Collect Navigation Timing gaps

https://gerrit.wikimedia.org/r/434439

Here's the latest version: https://grafana.wikimedia.org/dashboard/db/performance-metrics?refresh=5m&panelId=30&fullscreen&orgId=1

We now collect gaps and use means for the metrics that we stack. Looks better but it's not 100% correct.

@Krinkle I tried to validate the example events with https://github.com/soulgalore/wikimedia-tools/blob/master/validate-navtiming/validate.js and I got two events there that doesn't match in total vs loadEventEnd but it could be that I just missed something in the validation. I'll dig into it tomorrow again.

@Krinkle I tried to validate the example events with https://github.com/soulgalore/wikimedia-tools/blob/master/validate-navtiming/validate.js and I got two events there that doesn't match in total vs loadEventEnd but it could be that I just missed something in the validation. I'll dig into it tomorrow again.

Nice! I spotted a minor difference with navtiming.py (comment). Might be nothing, but just in case :)

  • Use medians
  • Use navtiming2 values

Note that github's visualization also has gaps.

I've changed to medians and changed all navigation timing dashboards to use navtiming2 instead of navtiming.

Krinkle renamed this task from Refactor Navigation Timing gathering to produce reliable stackable measures to Refactor Navigation Timing gathering to produce reliable stackable measures (aka "frontend.navtiming2").Dec 5 2018, 8:41 PM

Change 477852 had a related patch set uploaded (by Krinkle; owner: Krinkle):
[performance/navtiming@master] Remove creation of frontend.navtiming metrics in favour of navtiming2

https://gerrit.wikimedia.org/r/477852

Change 477852 merged by jenkins-bot:
[performance/navtiming@master] Remove creation of frontend.navtiming metrics in favour of navtiming2

https://gerrit.wikimedia.org/r/477852