Page MenuHomePhabricator

EL replication having issues since at least January 11th
Closed, ResolvedPublic

Description

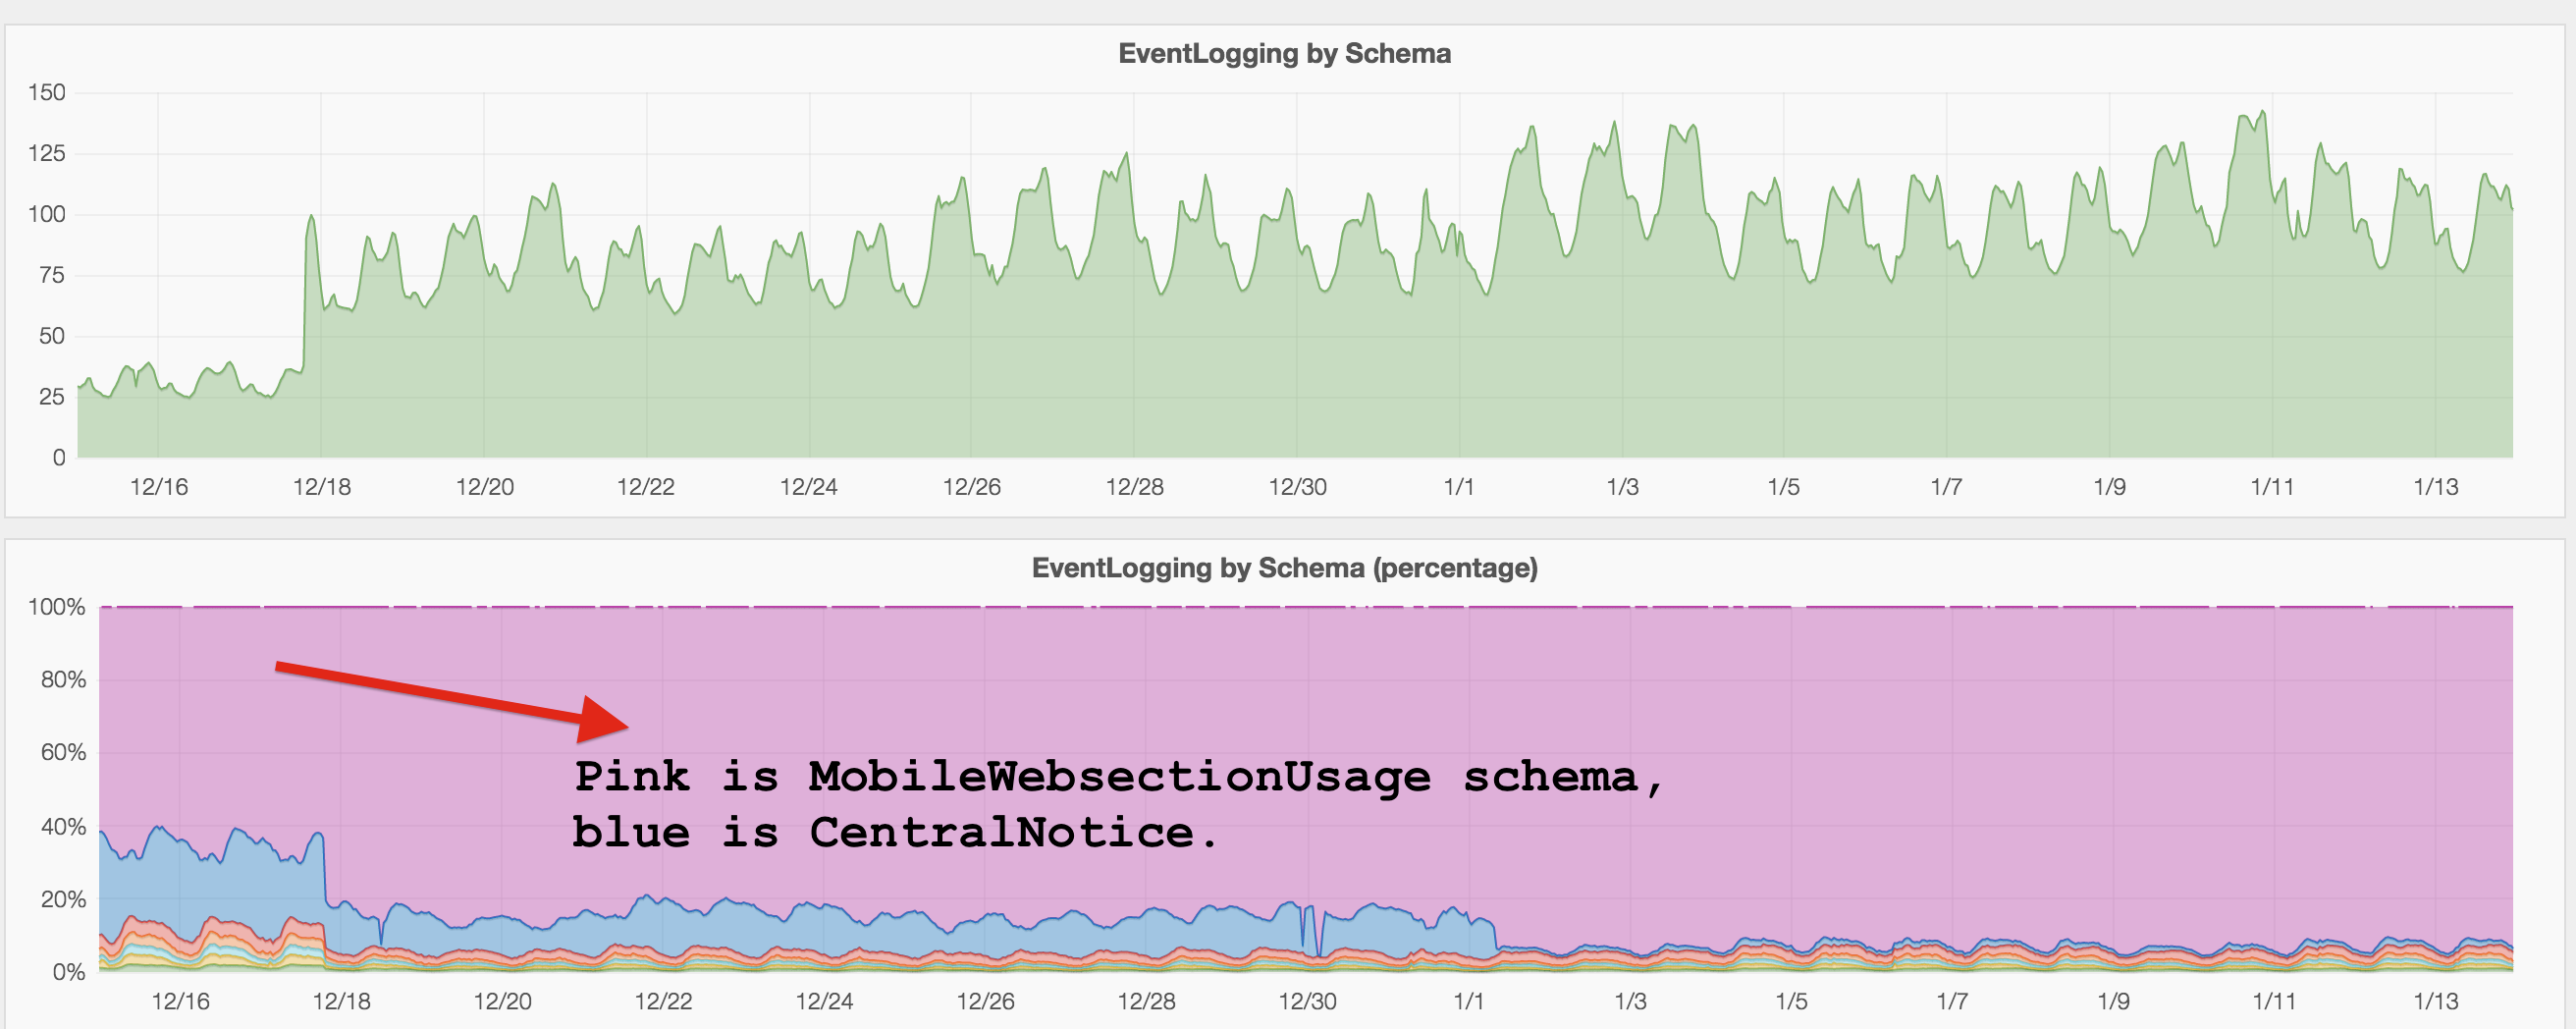
We have thus far seen that one schema was accounting for about 90% of eventlogging flow and we have blacklisted it: MobileWebSectionUsage (see image)

We have also dropped the MobileWebSectionUsage tables as the db was having disk space issues for a while (this was a just a shot in the dark though)

Looks like we have several long running queries we need to kill?

Event Timeline

Nuria raised the priority of this task from to Unbreak Now!.
Nuria updated the task description. (Show Details)
Nuria added a project: Analytics-Kanban.
Nuria subscribed.
Nuria added a project: DBA.
Nuria set Security to None.
Nuria added a subscriber: Ottomata.

From ops list:

"SELECT * FROM information_schema.processlist ORDER BY time DESC"
informs us of this:

5599890research10.64.36.103:53669enwikiQuery133527Queried about 890000 rowsCREATE TEMPORARY TA

SELECT

page_id,
views

FROM (

SELECT
    page_namespace,
    page_title,
    SUM(views) AS views
FROM staging.page_name_views_dupes
WHERE page_namespace = 0
GROUP BY 1,2

) AS group_page_name_views
INNER JOIN enwiki.page USING (page_namespace, page_title)

Column 6 is "time", i.e. this query was running for 133527 seconds at
the time (i.e. ~1.5 days!), which is obviously Not Good™. I just ran
"KILL QUERY 5599890;", hopefully this will help.

The second-next long-standing query has been running for over 6 hours
now and it way too long to paste (87 lines, starts with "INSERT INTO
editor_month_global", inline comments, all kinds of subselects in inner
joins etc., queried "about 2470000 rows"). I left it be for now, we'll
see how that goes and I may eventually kill it too, as I/O is still
pegged at 100%.

From mobile team:

https://gerrit.wikimedia.org/r/263538 was merged Monday 11th so new
sampling rate of 0 should be applied to all wikis from tomorrow
(Thursday 14th) around 5 PM PST. Please let team know if that doesn't
look right (note I am out tomorrow and Friday)

Looks we can whitelist table again as of Friday.

Change 264115 had a related patch set uploaded (by Ottomata):
Batch eventlogging_sync custom mysqldump replication

https://gerrit.wikimedia.org/r/264115

Change 264115 merged by Ottomata:
Batch eventlogging_sync custom mysqldump replication

https://gerrit.wikimedia.org/r/264115

Ok, I've modified the eventlogging_sync.sh script to do the custom mysqldump | insert based replication in batches of 1000 rows. This means that each mysqldump | insert step will only insert 1000 rows for each eventlogging table at a time. Large tables with many inserts may still lag, (and may not catch up?), but at least they won't starve out replication of smaller eventlogging tables.

https://gerrit.wikimedia.org/r/#/c/264115/2/files/mariadb/eventlogging_sync.sh

This is looking better so far. I can see many more tables with rows being inserted. If you have a particular table for which your data has not updated, let me know and I'll see if I can special case speed that one along.

db1047(???) big tables:

MariaDB EVENTLOGGING m4 localhost log >  SELECT table_name, (DATA_LENGTH + INDEX_LENGTH)/1024/1024/1024 as `TOTAL SIZE (GB)`, ENGINE, CREATE_OPTIONS FROM information_schema.tables WHERE TABLE_SCHEMA='log' /* AND `ENGINE` <> 'TokuDB' */ ORDER BY (DATA_LENGTH + INDEX_LENGTH) DESC LIMIT 30;
+--------------------------------------------+------------------+--------+---------------------------------------------+
| table_name                                 | TOTAL SIZE (GB)  | ENGINE | CREATE_OPTIONS                              |
+--------------------------------------------+------------------+--------+---------------------------------------------+
| MobileWebUIClickTracking_10742159          | 521.135482054204 | TokuDB | `compression`='tokudb_zlib'                 |
| PageContentSaveComplete_5588433            | 240.877661335282 | TokuDB | `compression`='tokudb_zlib'                 |
| MediaViewer_10867062                       | 199.722940413281 | TokuDB | page_checksum=1 `compression`='tokudb_zlib' |
| Edit_11448630                              | 178.264423341490 | TokuDB | page_checksum=1 `compression`='tokudb_zlib' |
| MobileWikiAppToCInteraction_10375484       | 137.553305364214 | TokuDB | `compression`='tokudb_zlib'                 |
| Edit_13457736                              | 115.713233947754 | Aria   |                                             |
| MobileWebEditing_8599025                   |  81.299430885352 | TokuDB | `compression`='tokudb_zlib'                 |
| MobileWikiAppSearch_10641988               |  80.191341589205 | TokuDB | page_checksum=1 `compression`='tokudb_zlib' |
| MobileWikiAppToCInteraction_8461467        |  79.605804484338 | TokuDB | `compression`='tokudb_zlib'                 |
| DeprecatedUsage_7906187                    |  79.030134613626 | TokuDB | `compression`='tokudb_zlib'                 |
| MobileWikiAppArticleSuggestions_11448426   |  74.080303261057 | TokuDB | page_checksum=1 `compression`='tokudb_zlib' |
| MediaViewer_8572637                        |  53.530012690462 | TokuDB | `compression`='tokudb_zlib'                 |
| MediaViewer_8245578                        |  52.663764884695 | TokuDB | `compression`='tokudb_zlib'                 |
| MobileWebSectionUsage_15038458             |  47.344238281250 | Aria   |                                             |
| MobileWebSectionUsage_14321266             |  46.843498229980 | Aria   |                                             |
| MobileWikiAppMediaGallery_10923135         |  44.132686159573 | TokuDB | page_checksum=1 `compression`='tokudb_zlib' |
| MultimediaViewerNetworkPerformance_7917896 |  37.447020443156 | TokuDB | `compression`='tokudb_zlib'                 |
| NavigationTiming_10785754                  |  34.445742438547 | TokuDB | page_checksum=1 `compression`='tokudb_zlib' |
| PersonalBar_7829128                        |  33.486920169555 | TokuDB | `compression`='tokudb_zlib'                 |
| MobileWikiAppArticleSuggestions_12443791   |  31.112564086914 | Aria   |                                             |
| EchoInteraction_5782287                    |  31.024022584781 | TokuDB | page_checksum=1 `compression`='tokudb_zlib' |
| MediaViewer_10606177                       |  30.944609669037 | TokuDB | page_checksum=1 `compression`='tokudb_zlib' |
| _EchoInteraction_5782287                   |  28.228873762302 | TokuDB | `compression`='tokudb_zlib'                 |
| MobileWikiAppArticleSuggestions_10590869   |  27.256117259152 | TokuDB | page_checksum=1 `compression`='tokudb_zlib' |
| PageCreation_7481635                       |  24.524119151756 | TokuDB | `compression`='tokudb_zlib'                 |
| MediaViewer_8935662                        |  24.144366898574 | TokuDB | `compression`='tokudb_zlib'                 |
| NavigationTiming_8365252                   |  21.527939989232 | TokuDB | `compression`='tokudb_zlib'                 |
| UniversalLanguageSelector_7327441          |  21.329904851504 | TokuDB | `compression`='tokudb_zlib'                 |
| MediaViewer_10308479                       |  20.706761780195 | TokuDB | `compression`='tokudb_zlib'                 |
| CentralAuth_5690875                        |  20.173187393695 | TokuDB | `compression`='tokudb_zlib'                 |
+--------------------------------------------+------------------+--------+---------------------------------------------+
30 rows in set (0.64 sec)

Replag is ~50,000 seconds now, slowly decreasing since I killed that big query yesterday.

This query is still running, for more than a day now:

| 5761690 | research        | 10.64.36.103:46490   | staging            | Query   |  116980 | Sending data                                          
SELECT
   user_name,
   STR_TO_DATE( CONCAT(month, "01") , "%Y%m%d" ),
   SUM(revisions),
   SUM(archived),
   STR_TO_DATE( first_registration, "%Y%m%d%H%i%S" )
FROM editor_month
LEFT JOIN (
   SELECT
      user_name,
      MIN(user_registration) AS first_registration
   FROM editor_month
   GROUP BY user_name
) reg USING (user_name)
GROUP BY user_name, month

I talked to Neil p Quinn about it. Decided to just let it go, since I was able to find a work around to allow some EL tables to sync. Neil said we could kill it if it was absolutely necessary.

"CREATE TEMPORARY TABLE SELECT" is not recommended (any kind of DDL + SELECTing/going over lots of rows) because it will create a huge amount of locking/contention for other queries, delaying replication during its execution.

cc-ing @Neil_P._Quinn_WMF. Please take a look at @jcrespo (dba) recommendations regarding your selects

@jcrespo: can we get some help here to see what is wrong with replication?

If you mean s1-s7 replication, I found Faidon's analysis to be quite accurate, plus I already gave some recommendations regarding queries to be rewritten. The only protection for replication about those kind of queries is having your permission to kill queries [automatically] that are creating more than X amount of replication lag (as we currently do for labs).

If you mean enventlogging lag, we still have pending maintenance (T120187), which is important to keep it low - I mentioned several times to include partitioning/keep table size low to keep it healthy, but my recommendations, which some require application changes, have been many times ignored. @Ottomata patch is a good try, but having working with this dataset for a while I think is not a good term solution, more changes have to be done to improve the script (which I merely inherited from Sean and puppetized it unchanged). I think dbstore1002 is so saturated that it would be better to run it from a separate host, which I am doing right now manually to reduce the current ongoing issues.

This is the current state of m4 replication:

$ bash check_eventlogging_lag.sh dbstore1002
[Warning] EchoInteraction_15180901 lag: 01:08:45
[CRITICAL] Echo_7731316 lag > 1 day (146813 seconds)
[CRITICAL] Edit_13457736 lag > 1 day (292472 seconds)
[Warning] MediaViewer_10867062 lag: 01:20:40
[CRITICAL] MobileAppUploadAttempts_5257716 lag > 1 day (22242114 seconds)
[Warning] MobileWebUIClickTracking_10742159 lag: 01:07:22
[CRITICAL] PageContentSaveComplete_5588433 lag > 1 day (598602 seconds)

(all not shown tables have less than 1 hour of lag)

sX replication lag is a non-issue right now:

mysql -h dbstore1002 -e "SHOW ALL SLAVES STATUS\G" | grep Seconds
        Seconds_Behind_Master: 0
        Seconds_Behind_Master: 1
        Seconds_Behind_Master: 0
        Seconds_Behind_Master: 0
        Seconds_Behind_Master: 0
        Seconds_Behind_Master: 0
        Seconds_Behind_Master: 0
        Seconds_Behind_Master: 0
        Seconds_Behind_Master: 0

Oh! I didn't know of a check_eventlogging_lag.sh script. Cool!

Thanks for looking into this Jaime.

I think all issues are gone, except on MobileAppUploadAttempts_5257716, which may be a false positive or something else that makes the check complain, I will check it:

$ bash check_eventlogging_lag.sh dbstore1002
[Warning] EchoInteraction_15180901 lag: 01:12:47
[Warning] Edit_13457736 lag: 02:18:46
[CRITICAL] MobileAppUploadAttempts_5257716 lag > 1 day (22242114 seconds)
[Warning] NavigationTiming_13317958 lag: 01:44:28
jcrespo claimed this task.

There is definitely something wrong with that table, but it is not related to replication:

root@iron:~$ mysql -h dbstore1002 log -e "SELECT count(*), max(id), min(id) FROM MobileAppUploadAttempts_5257716"
+----------+---------+---------+
| count(*) | max(id) | min(id) |
+----------+---------+---------+
|     1779 |    3695 |       1 |
+----------+---------+---------+
root@iron:~$ mysql -h db1046 log -e "SELECT count(*), max(id), min(id) FROM MobileAppUploadAttempts_5257716"
+----------+---------+---------+
| count(*) | max(id) | min(id) |
+----------+---------+---------+
|       12 |      70 |      59 |
+----------+---------+---------+

FYI, I ended up killing that query (the one which started INSERT INTO editor_month_global) Sunday morning as it still hadn't completed. Sorry for the burden it caused.

@jcrespo, thank you for the advice. I have a couple questions about it (@Nuria, @Ottomata, maybe you know the answers as well). Reading recommendations would be welcome.

  1. Regarding "any kind of DDL + SELECTing/going over lots of rows", is there a workaround you'd recommend? Writing a script which does it in batches? Somehow setting a low priority for the query?
  2. The tables I was inserting from and selecting to were both in the staging database. How would that create locking that affects EventLogging?
  3. In the future, is there a better way to tell whether one of my queries is placing too much load on the server? I started watching Tendril after the query had been running for a while, but none of the variables (including replication lag) went up or down in sync with my starting and killing the query. Are there other tools I should use? I would be okay with you killing queries that create too much lag, as long as I know how to figure out whether mine are getting close to the threshold.

For those kind of questions "general consultancy/help", it is quicker if you schedule a chat/meeting. I am trying to organize a session for developers on query optimization, but here you have some quick answers:

  1. Create the table, then INSERT ...SELECT if you are using InnoDB/TokuDB. That should not (in general) lock the existing tables to continue being written thanks to them being transactional (multiversioning). If you want to be minimize even less the load or you are using non-transactional tables/configuration mode, you can export and import tables using mysqldump and mysql (or a similar schema with client-side commands). In some cases that will be faster, in some others, it won't, but the important things is to avoid impact on the replication process avoiding unnecessary locks and throtting the IOPS used.
  1. Even if you are not touching the replicated tables, long running transactions can have an impact server-wide. Due to transaction isolation, a long running select has to keep older version of the rows so that reads do not differ when they are written to. This can lead to several performance problems when using multi-day queries, as MySQL is not optimized for OLAP or long running transactions. Creating several, shorter transactions to compute something in chunks is much preferred, specially if you are not the only user, even if it takes a bit longer to run. In some cases I have seem many people computing the same table many times, by running something like count(*) over an ever-growing table, instead of only the newsest records. That is another possible optimization.
  1. There is no good single parameters to indicate the performance impact of a query beforehand. When there is high CPU or disk usage, or the other way round, low CPU and disk usage due to contention, the servers are checked and if there is something that matches the cause, usually due to having lots of locks reserved or too many resources used, it is stopped. There are several profiling options, from knowing the locks with SHOW ENGINE INNODB STATUS, memory usage/cpu usage/disk usage/counters in information_schema/user_stats plugin, and profiling provided by performance schema. Some of them may not be available to non-administrators, or do not have *yet* a nice web interface were they are exposed (in most cases due to privacy concerns). SHOW SESSION STATUS like 'Hand%'; is a good low-level method for measuring query resources usage, but we do not have per-user reports, only per server and per query. It also has the problem of serveral users sharing the same account, which is unoptimal. Please note that due to replication (we have 7+ shards on a single server) we are already using a good chunk of resources just on keeping up to date with the production the database.

The truth is, as infrastructure owners, that once we receive complains, we use tendril, graphana server's board and db-specific profiling to search a root cause and perform immediate actions to solve on-going issues, but we do not have the manpower to followup and help tuning queries (even if I'd love to), as this is just 1 out of the 200 mysql we host, and the thousands of users and applications we run). Sorry for that :-/