As discussed with @GWicke we want to measure how long saving a page with MathML takes compared to the png rendering baseline.
We should make sure that MathML performs at least as well as the older PNG render mode.
As discussed with @GWicke we want to measure how long saving a page with MathML takes compared to the png rendering baseline.
We should make sure that MathML performs at least as well as the older PNG render mode.
| Status | Subtype | Assigned | Task | ||
|---|---|---|---|---|---|
| Open | None | T96152 Problems with Math in section titles | |||
| Open | None | T28213 Strip marker (UNIQ / QINU) issues (tracking) | |||
| Open | None | T94344 Section anchor depends on the rendering mode | |||
| Declined | Physikerwelt | T109195 Install texlive-extra-utils on mw appservers | |||
| Duplicate | None | T129107 Change png format for mathematical formulae to be more accessible | |||
| Duplicate | None | T131190 Set MathML / SVG as the default rendering mode on de.wikibooks.org | |||
| Resolved | • mobrovac | T131177 Enable MathML by default | |||
| Resolved | Physikerwelt | T78046 Implement a single math rendering mode that works across all devices (MathML / SVG using mathoid) | |||
| Resolved | • mobrovac | T132096 Improve save / preview performance of MathML math rendering mode |
On my local server
https://en.formulasearchengine.com/w/index.php?title=Fourier_transform
it takes 4min 32 seconds for the first preview of the page in png rendering mode.
The second preview took 31.44 seconds and the third one 19.1 seconds.
In mathml mode it takes 2.95 seconds to visit the page (probably it was cached).
Preview takes 24.6 s, 26.0s for the second and 25.3 for the third rendering.
In production it was around 4seconds for png and 15 for MathML.
That's what the profiler says for preview with MathML mode
100.00% 27389.668      1 - main()
 99.94% 27372.931      1 - MediaWiki::run
 99.94% 27372.186      1 - MediaWiki::main
 99.17% 27163.596      1 - MediaWiki::performRequest
 99.11% 27146.380      1 - MediaWiki::performAction
 99.11% 27146.118      1 - SubmitAction::show
 99.11% 27146.103      1 - EditAction::show
 99.11% 27145.270      1 - EditPage::edit
 99.01% 27119.345      1 - EditPage::showEditForm
 97.60% 26731.913      1 - EditPage::getPreviewText
 96.90% 26540.836     35 - Parser::parse
 96.50% 26431.841      1 - AbstractContent::getParserOutput
 96.50% 26431.103      1 - WikitextContent::fillParserOutput
 87.55% 23980.399   1585 - call_user_func_array
 79.42% 21753.053     35 - Parser::internalParseHalfParsed
 76.21% 20874.431   5774 - Hooks::run
 75.84% 20771.678     35 - MathHooks::onParserBeforeTidy
 58.54% 16035.220    393 - VirtualRESTServiceClient::runMulti
 58.37% 15988.661    393 - MultiHttpClient::runMulti
 55.73% 15264.949   1472 - call_user_func_array@1
 50.40% 13805.195    392 - MathHooks::mathPostTagHook
 47.85% 13104.690    392 - MathMathML::render
 47.68% 13058.360    392 - MathRestbaseInterface::getMathML
 47.65% 13052.382    392 - MathRestbaseInterface::getContent
 46.40% 12709.705    392 - VirtualRESTServiceClient::run
 32.07% 8784.482   1615 - curl_multi_select
 24.47% 6702.551   2015 - curl_multi_exec
 17.22% 4716.549     35 - Parser::internalParse
 15.62% 4279.448   1303 - PPFrame_DOM::expand
 14.97% 4101.265    427 - Parser::replaceVariables
 12.33% 3376.707     35 - MathRestbaseInterface::batchEvaluate
 11.22% 3072.671    247 - Parser::braceSubstitution
 11.04% 3022.538   5075 - PPFrame_DOM::expand@1
 10.77% 2950.537   5655 - preg_replace
  9.93% 2720.452    127 - Parser::braceSubstitution@1
  8.79% 2408.510    313 - Parser::callParserFunction
  7.55% 2069.265     81 - ScribuntoHooks::invokeHook
  7.08% 1939.451     81 - Scribunto_LuaModule::invoke
  6.89% 1887.962    582 - Scribunto_LuaStandaloneInterpreter::dispatch
  6.08% 1664.969    183 - Scribunto_LuaStandaloneInterpreter::callFunction
  5.39% 1475.254    545 - PPFrame_DOM::expand@2
  5.12% 1402.735     81 - Scribunto_LuaEngine::executeFunctionChunk
  4.65% 1274.073    216 - Parser::braceSubstitution@2
  4.50% 1233.777   2431 - Scribunto_LuaStandaloneInterpreter::sendMessage
  3.54% 968.559     70 - Parser::callParserFunction@1
  3.26% 893.665    245 - ExtParserFunctions::ifObj
  2.86% 783.217   1040 - Scribunto_LuaStandaloneInterpreter::handleCall
  2.79% 764.055   2431 - fwrite
  2.75% 754.235   1040 - Scribunto_LuaStandaloneInterpreter::callback
  2.54% 694.957    914 - Scribunto_LuaEngine::getInterpreter
  2.53% 692.437    915 - Scribunto_LuaStandaloneEngine::load
  2.53% 691.828   1146 - PPFrame_DOM::expand@3
  2.43% 666.316   1512 - PPTemplateFrame_DOM::getArgument
  2.34% 639.972    796 - Parser::extensionSubstitution
  2.15% 587.791    587 - Scribunto_LuaEngine::getExpandedArgument
  2.11% 577.064     35 - Parser::replaceTransparentTags
  2.08% 569.092    938 - Scribunto_LuaStandaloneInterpreter::getStatus
  1.93% 529.502     35 - Parser::extractTagsAndParams
  1.91% 524.483    673 - Scribunto_LuaStandaloneInterpreter::dispatch@1
  1.87% 510.835    532 - PPFrame_DOM::expand@4
  1.86% 509.635  26912 - strtr
  1.78% 488.283    637 - Parser::argSubstitution
  1.75% 478.896  17248 - MultiHttpClient::{closure}
  1.73% 472.625     36 - Parser::braceSubstitution@3
  1.65% 451.703   4580 - preg_split
  1.60% 437.832    392 - MathMathML::getHtmlOutput
  1.59% 436.203   1599 - PPTemplateFrame_DOM::getNumberedArgument
  1.57% 428.773   2431 - Scribunto_LuaStandaloneInterpreter::encodeMessage
  1.54% 420.729    392 - MathHooks::mathTagHook
  1.47% 402.373   2431 - Scribunto_LuaStandaloneInterpreter::encodeLuaVar
  1.47% 402.226     24 - Parser::braceSubstitution@4
  1.41% 385.216    312 - PPFrame_DOM::expand@5
  1.36% 371.650    787 - call_user_func_array@2
  1.35% 369.996     83 - Scribunto_LuaEngine::executeModule
  1.32% 361.851     39 - Parser::formatHeadings
  1.26% 345.168  11004 - Scribunto_LuaStandaloneInterpreter::encodeLuaVar@1
  1.10% 301.581   3925 - MathHooks::mathConstantToString
  1.03% 281.192    393 - MultiHttpClient::__destruct
  1.03% 281.048     12 - ExtParserFunctions::switchObj
  1.02% 280.144   2431 - Scribunto_LuaStandaloneInterpreter::receiveMessage
  1.01% 275.731    393 - curl_multi_close
  0.96% 262.037    215 - DatabaseBase::select
  0.92% 251.089  23775 - preg_replace_callback
  0.89% 244.668      2 - StubObject::_call
  0.89% 244.357    519 - Linker::link
0.89% 244.340 1 - WikitextContent::preSaveTransformWe need to figure out why MathML rendering is about 3x slower than the PNG render mode on https://en.wikipedia.org/wiki/Fourier_transform.
One possible area of improvement might be increasing the parallelism of math tag rendering, by bumping up maxConnsPerHost. Each of those fetches should not take more than 100ms, so if they are all performed in parallel, they should not add up to 10+s.
I haven't looked into how math tags are found before sending off batch requests; there might be optimization potential by storing / caching the list / rendering of math tags in a page as a blob, or selecting them from the DB.
@GWicke as you can see from the profiler output it still makes individual request for each formulae.
Also there was a discussion in decomber with @mobrovac https://etherpad.wikimedia.org/p/Mathoid and two unmerged requests
https://gerrit.wikimedia.org/r/#/c/267611/
and
https://gerrit.wikimedia.org/r/#/c/267544/
I'll get back to that later... but I wanted to manifest it here since it came to my mind right now.
@Physikerwelt: Ahh, so I guess the third column in the profile is the number of calls? That would be 393 fomulas, requested sequentially. Assuming about 25ms per request, that works out to ~10s of waiting. Looks like we have the explanation.
To fix, this, we should move to a model where we request all math tags in a single VirtualRESTServiceClient::runMulti call. This might entail collecting all those math tags, and substituting the results in a second pass over the content. My memory of the MediaWiki facilities in that space is a bit foggy, but IIRC there is support for doing something like this with strip markers / strip state.
Edit: A combination of [Parser::insertStripItem()](https://github.com/wikimedia/mediawiki/blob/9b510882d79549bdc6be3b89d10f67d3f6c5da2d/includes/parser/Parser.php#L1005) (to collect the tag) and [the InternalParseBeforeSanitize hook](https://github.com/wikimedia/mediawiki/blob/9ee6461287f5d2d6fae719ec62ae6465e0a3809d/docs/hooks.txt#L1679) (to replace the tags' content based on the curl_multi result) might work.
@GWicke I think it would be optimal if restbase could return the svg-dimensions and the mathml code on the first post request, if the input is valid tex.
Even if you are trying to get the mathml code manually on https://en.wikipedia.org/api/rest_v1/?doc#!/Math/get_media_math_render_format_hash you wonder why you have to make two request.
I remember that @mobrovac was not too much in favor of putting that logic into restbase, but I guess that would be most efficient.
@Physikerwelt: Compared to doing all those requests sequentially, that's a minor optimization. Lets first get from 10s to < 100ms, before worrying about the last dozen ms.
Change 282413 had a related patch set uploaded (by Physikerwelt):
Reduce number of Restbase requests
@GWicke ok. I implemented that. On that server the profiler reported runtime is reduced from 22 to 14 seconds. I guess that the change in restbase would lead to a similar improvement.
See the new profiler output
100.00% 14464.696      1 - main()
 99.93% 14454.067      1 - MediaWiki::run
 99.92% 14453.243      1 - MediaWiki::main
 98.25% 14210.940      1 - MediaWiki::performRequest
 98.15% 14197.321      1 - MediaWiki::performAction
 98.15% 14197.143      1 - ViewAction::show
 98.15% 14197.132      1 - Article::view
 97.44% 14093.905      1 - PoolCounterWork::execute
 97.43% 14093.451      1 - PoolWorkArticleView::doWork
 97.42% 14091.996      3 - Parser::parse
 97.38% 14085.483      1 - AbstractContent::getParserOutput
 97.37% 14084.051      1 - WikitextContent::fillParserOutput
 81.05% 11723.254   1398 - call_user_func_array
 59.66% 8629.930      3 - Parser::internalParseHalfParsed
 58.11% 8404.905   4597 - Hooks::run
 57.56% 8326.251      3 - MathHooks::onParserAfterTidy
 40.32% 5832.064      3 - MathRestbaseInterface::batchEvaluate
 40.06% 5794.550      2 - VirtualRESTServiceClient::runMulti
 40.01% 5787.768      2 - MultiHttpClient::runMulti
 37.42% 5412.410      3 - Parser::internalParse
 34.30% 4961.303    559 - curl_multi_exec
 32.41% 4688.119   1266 - PPFrame_DOM::expand
 31.05% 4491.969    387 - Parser::replaceVariables
 25.98% 3757.572    124 - Parser::braceSubstitution
 24.51% 3545.939   3328 - PPFrame_DOM::expand@1
 22.84% 3303.253    127 - Parser::braceSubstitution@1
 19.84% 2869.263    304 - Parser::callParserFunction
 16.89% 2442.666     81 - ScribuntoHooks::invokeHook
 15.89% 2298.879     81 - Scribunto_LuaModule::invoke
 15.53% 2246.859    582 - Scribunto_LuaStandaloneInterpreter::dispatch
 14.55% 2105.299   1463 - call_user_func_array@1
 13.65% 1974.410    183 - Scribunto_LuaStandaloneInterpreter::callFunction
 12.22% 1767.588    545 - PPFrame_DOM::expand@2
 11.56% 1671.535     81 - Scribunto_LuaEngine::executeFunctionChunk
 11.41% 1651.114   4230 - preg_replace
 10.55% 1526.472   2431 - Scribunto_LuaStandaloneInterpreter::sendMessage
 10.44% 1509.867    216 - Parser::braceSubstitution@2
  7.82% 1131.282     70 - Parser::callParserFunction@1
  7.22% 1044.462    245 - ExtParserFunctions::ifObj
  7.04% 1018.726   2431 - fwrite
  6.24% 902.653   1040 - Scribunto_LuaStandaloneInterpreter::handleCall
  6.19% 896.022   1146 - PPFrame_DOM::expand@3
  6.03% 872.532   1512 - PPTemplateFrame_DOM::getArgument
  6.02% 871.054   1040 - Scribunto_LuaStandaloneInterpreter::callback
  5.51% 797.432    914 - Scribunto_LuaEngine::getInterpreter
  5.49% 794.649    915 - Scribunto_LuaStandaloneEngine::load
  4.82% 697.356    587 - Scribunto_LuaEngine::getExpandedArgument
  4.70% 679.560    938 - Scribunto_LuaStandaloneInterpreter::getStatus
  4.52% 654.111    532 - PPFrame_DOM::expand@4
  4.50% 650.679    637 - Parser::argSubstitution
  4.33% 626.853    673 - Scribunto_LuaStandaloneInterpreter::dispatch@1
  4.15% 599.897     36 - Parser::braceSubstitution@3
  4.09% 590.917   1599 - PPTemplateFrame_DOM::getNumberedArgument
  3.81% 551.477    543 - curl_multi_select
  3.49% 504.537     24 - Parser::braceSubstitution@4
  3.28% 474.969    312 - PPFrame_DOM::expand@5
  3.16% 456.937    403 - Parser::extensionSubstitution
  3.15% 455.715   2431 - Scribunto_LuaStandaloneInterpreter::encodeMessage
  3.13% 452.398     83 - Scribunto_LuaEngine::executeModule
  3.09% 447.480  25642 - strtr
  3.05% 440.456    395 - call_user_func_array@2
  2.94% 425.235    392 - MathHooks::mathPostTagHook
  2.94% 424.949   2431 - Scribunto_LuaStandaloneInterpreter::encodeLuaVar
  2.57% 371.842      7 - Parser::formatHeadings
  2.49% 359.590  11004 - Scribunto_LuaStandaloneInterpreter::encodeLuaVar@1
  2.24% 324.124    392 - MathHooks::mathTagHook
  2.22% 321.299     12 - ExtParserFunctions::switchObj
  2.19% 316.093   2431 - Scribunto_LuaStandaloneInterpreter::receiveMessage
  2.09% 301.726    150 - Parser::getTemplateDom
  2.07% 299.652  20548 - preg_replace_callback
  1.99% 287.967  17640 - MultiHttpClient::{closure}
  1.93% 279.463    576 - call_user_func
  1.89% 273.535   1564 - PPTemplateFrame_DOM::getNamedArgument
  1.88% 271.713     37 - Parser::fetchTemplateAndTitle
  1.84% 266.516     37 - Parser::statelessFetchTemplate
  1.82% 262.746    392 - MathMathML::getHtmlOutput
  1.81% 261.413      9 - Sanitizer::removeHTMLtags
  1.68% 243.140    133 - DatabaseBase::select
  1.66% 240.790     11 - Parser::braceSubstitution@5
1.55% 224.551 1 - OutputPage::output@Physikerwelt, do you see a difference when you allow a greater concurrency (say, 500) for the math requests?
@GWicke do you remember how I can adjust taht in LocalSettings.php
Note, that this test is run on desktop machines at TU Berlin not on real wmf servers.
@Physikerwelt, I'm afraid that there is currently no support for changing the default from LocalSettings. There is support in MultiHTTPClient (both in the constructor and [runMulti](https://github.com/wikimedia/mediawiki/blob/c42f06642091e1cb1142066b0a52a69a0c7e783d/includes/libs/MultiHttpClient.php#L55)), but this is not used in VRS right now. It should not be too hard to add support for forwarding options (or setting them at mount time), though.
As mentioned earlier, the default concurrency is 50, which means that we'd end up with 8 rounds for ~380 math tags. In theory, given sufficient server resources, bumping the concurrency to 200 or 500 should cut that down significantly. Could you try passing in array('maxConnsPerHost' => 500) as the second parameter into runMulti()?
I made some experiements with ab
Document Path:          /en.wikipedia.org/v1/media/math/
Document Length:        28 bytes

Concurrency Level:      10
Time taken for tests:   4.483 seconds
Complete requests:      10000
Failed requests:        0
Total transferred:      7180000 bytes
HTML transferred:       280000 bytes
Requests per second:    2230.41 [#/sec] (mean)
Time per request:       4.483 [ms] (mean)
Time per request:       0.448 [ms] (mean, across all concurrent requests)
Transfer rate:          1563.90 [Kbytes/sec] received

Connection Times (ms)
              min  mean[+/-sd] median   max
Connect:        0    1   0.5      1       4
Processing:     1    3   1.0      3      20
Waiting:        1    2   0.9      2      19
Total:          2    4   1.1      4      22
Document Path: /en.wikipedia.org/v1/media/math/
Document Length: 28 bytes
Concurrency Level: 50
Time taken for tests: 2.845 seconds
Complete requests: 10000
Failed requests: 0
Total transferred: 7180000 bytes
HTML transferred: 280000 bytes
Requests per second: 3514.80 [#/sec] (mean)
Time per request: 14.226 [ms] (mean)
Time per request: 0.285 [ms] (mean, across all concurrent requests)
Transfer rate: 2464.48 [Kbytes/sec] received
Connection Times (ms)
min mean[+/-sd] median max
Connect: 1 5 1.7 5 13
Processing: 2 9 3.4 8 26
Waiting: 1 7 2.8 7 23
Total: 4 14 3.8 14 32
Percentage of the requests served within a certain time (ms)
50% 14
66% 15
75% 17
80% 17
90% 19
95% 21
98% 23
99% 25
100% 32 (longest request)Document Path: /en.wikipedia.org/v1/media/math/
Document Length: 28 bytes
Concurrency Level: 100
Time taken for tests: 2.672 seconds
Complete requests: 10000
Failed requests: 0
Total transferred: 7180000 bytes
HTML transferred: 280000 bytes
Requests per second: 3741.89 [#/sec] (mean)
Time per request: 26.724 [ms] (mean)
Time per request: 0.267 [ms] (mean, across all concurrent requests)
Transfer rate: 2623.71 [Kbytes/sec] received
Connection Times (ms)
min mean[+/-sd] median max
Connect: 2 10 3.4 10 21
Processing: 3 16 5.8 16 41
Waiting: 2 13 4.9 13 39
Total: 6 27 6.4 26 53
Percentage of the requests served within a certain time (ms)
50% 26
66% 29
75% 30
80% 32
90% 35
95% 38
98% 40
99% 43
100% 53 (longest request)Document Path: /en.wikipedia.org/v1/media/math/
Document Length: 28 bytes
Concurrency Level: 200
Time taken for tests: 22.779 seconds
Complete requests: 10000
Failed requests: 0
Total transferred: 7180000 bytes
HTML transferred: 280000 bytes
Requests per second: 439.01 [#/sec] (mean)
Time per request: 455.575 [ms] (mean)
Time per request: 2.278 [ms] (mean, across all concurrent requests)
Transfer rate: 307.82 [Kbytes/sec] received
Connection Times (ms)
min mean[+/-sd] median max
Connect: 5 225 357.5 25 1794
Processing: 6 228 343.7 39 1186
Waiting: 5 214 337.4 30 1181
Total: 18 454 630.2 63 2193
Percentage of the requests served within a certain time (ms)
50% 63
66% 357
75% 735
80% 1014
90% 1812
95% 1917
98% 2005
99% 2015
100% 2193 (longest request)@Physikerwelt, in production, we have a lot more servers with many cores / workers each handling this in parallel. This means that we can use rather high parallelism without slowing down individual requests.
@GWicke I could not find a significant improvement by playing around with that variable.
Note that the value already has improved quite a bit: Before it was
58.54% 16035.220 393 - VirtualRESTServiceClient::runMulti
after the proposed change it will be
40.06% 5794.550 2 - VirtualRESTServiceClient::runMulti
Let me check how long the page would take on that server without any math...
@Physikerwelt: Yeah, this is already a big step forward. Based on the data we have, it is likely that this patch already brings math processing time to < 1s, which means that the difference vs. PNG mode will be insignificant.
It would of course be nice to be even faster, and I think in production bumping up concurrency and eliminating the need for the second request should get us there.
@Physikerwelt, the best place to specify such per-backend options should be in the VRS setup. I think we can bump this up for RESTBase in general, not just math.
@GWicke even better. Without math https://en.formulasearchengine.com/wiki/Fourier_transform_nomath
the profiler reports 4.2 seconds rather than 13.1 seconds with math. Of that 13.1 seconds 6.0 seconds were spend in MultiHttpClient::runMulti. Which is the majority of the math overhead of 8.9 s.
Change 283262 had a related patch set uploaded (by Mobrovac):
Allow the number of concurrent connections to be configurable
Change 283269 had a related patch set uploaded (by Mobrovac):
Math: increase the number of concurrent connections to 150
Gerrit 283262 allows us to configure the number of concurrent connections made by the Math extension to RESTBase, while Gerrit 283269 bumps that number in prod from 50 to 150.
I think that with these two changes we can consider this issue effectively resolved, as they allow us to further fine-tune the number of connections at a later time in an easy matter.
Change 283262 merged by jenkins-bot:
Allow the number of concurrent connections to be configurable
To predict the result of the config change I did an experiment here
http://en.wikipedia.beta.wmflabs.org/w/index.php?title=Math25&action=submit
With png it takes about 1.4 s with mathml about 2.5 s
However, in total I would say this is expected. We are now sending two consequitve http requests. In the png rendering mode, we get the outputhash (16 byte) based on a 16 byte inputhash. Moreover, the inputhash is the primary key.
I think that problem should not be solved as a part of the Math exetension. It's more about adding some in memory based cached to the VirtualRESTServiceClient. Given the zipf distribution of the formulae even a small amout of memory could do a lot and for a lot of pages no requests to restbase would have to be sent at all.
Note that privately hosted wikis that used remote restbase instances for math rendering would benefit even more, since they have higher network latency.
Do we need to add the config change to this list
https://wikitech.wikimedia.org/wiki/Deployments
?
Change 283269 merged by jenkins-bot:
Math: increase the number of concurrent connections to 150
The changes are now fully deployed everywhere. The Fourier transform enwiki page now loads in under 8 seconds, down from 30 seconds before Gerrit 283269 got in the mix! This is a big improvement, so resolving the task. We can subsequently change the value of $wgMathConcurrentReqs to tune the load times.
I'm sorry, but to me it looks like performance is still quite poor:
Is this change actually deployed in production?
Edit: These timings are from the Chrome network console, for the HTML request (so excluding rendering delays).
I had a look at the fourier transform page which had 609 formulae.
The most recent version has by far more formulae than the one I had on my test server.
https://en.wikipedia.org/w/index.php?title=User:Physikerwelt/sandbox/609&action=submit
I can preview that page in mathml mode in >7.1s
For the actual formulae on the fourier transform page it takes much longer
https://en.wikipedia.org/w/index.php?title=User:Physikerwelt/sandbox/FT&action=submit
preview with mathml >13.5s
Change 286260 had a related patch set uploaded (by Physikerwelt):
Use the cached version of checkTex to improve performance
Change 286260 merged by jenkins-bot:
Use the cached version of checkTex to improve performance
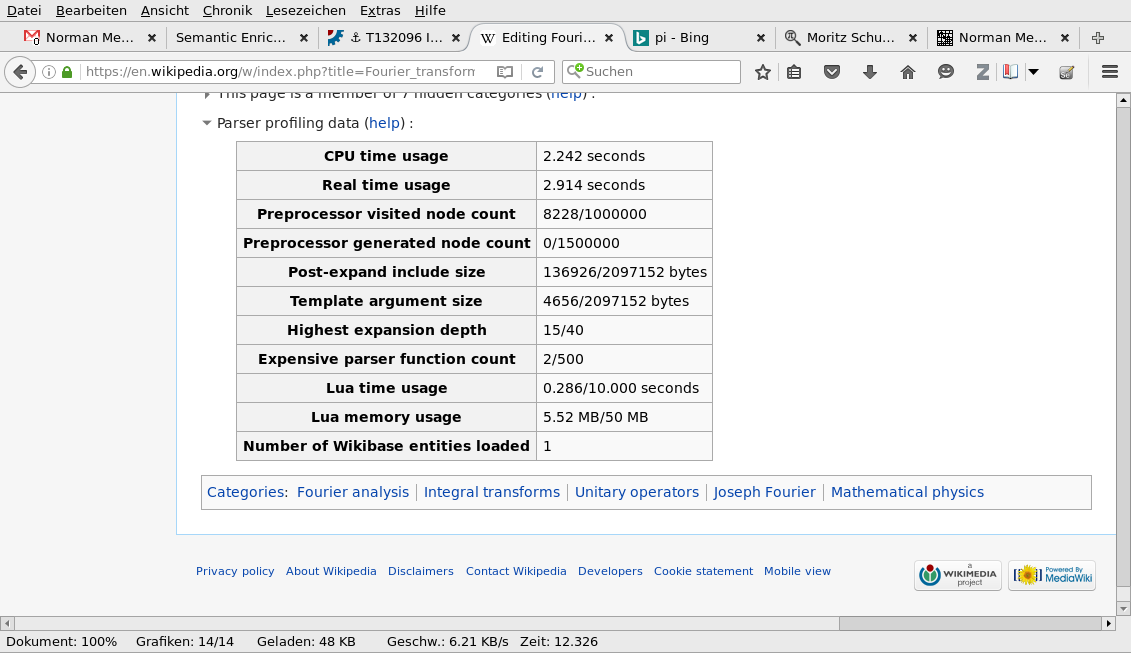
With the last change deployed on beta the time (now self reported parsing times) has changed as follows:
Fourier_transform on enwiki
CPU time usage	4.028 seconds
Real time usage	22.192 seconds
Fourier_transform on beta
CPU time usage	5.642 seconds
Real time usage	11.458 seconds
609 test on enwiki
CPU time usage	2.171 seconds
Real time usage	10.711 seconds
609 test on beta
CPU time usage	2.693 seconds
Real time usage	6.003 seconds
FT test on enwiki
CPU time usage	2.488 seconds
Real time usage	13.313 seconds
FT test on beta
CPU time usage	3.259 seconds
Real time usage	7.362 seconds
Note that the times vary quite a bit for repeated tests.
Change 286412 had a related patch set uploaded (by Mobrovac):
Use the cached version of checkTex to improve performance
Change 286412 merged by jenkins-bot:
Use the cached version of checkTex to improve performance