Page MenuHomePhabricator

Tools instances flapping puppet failure alerts
Closed, ResolvedPublic

Assigned To
None
Authored By
Andrew
Mar 31 2017, 2:32 PM
Referenced Files
F7688440: Screen Shot 2017-04-21 at 10.23.45 AM.png
Apr 21 2017, 3:36 PM
F7688472: Screen Shot 2017-04-21 at 10.27.05 AM.png
Apr 21 2017, 3:36 PM
F7688449: Screen Shot 2017-04-21 at 10.25.03 AM.png
Apr 21 2017, 3:36 PM
F7688492: Screen Shot 2017-04-21 at 10.29.55 AM.png
Apr 21 2017, 3:36 PM
F7667581: cobot-1437.png
Apr 20 2017, 1:26 PM
F7667582: cobot-1421.png
Apr 20 2017, 1:26 PM
F7532090: Screen Shot 2017-04-13 at 1.32.35 PM.png
Apr 13 2017, 7:12 PM
F7492564: Screen Shot 2017-04-11 at 12.30.00 PM.png
Apr 11 2017, 5:30 PM
Tokens
"Orange Medal" token, awarded by Andrew.

Description

Shinken monitoring alerts for puppet errors on the tools instances have been flapping. Apparently there are legitimate reasons for some alerts but most have no obvious cause or impact. We still need puppet failure alerts due to it being an important proxy, but differentiating between a single instance/low percentage alert and general failures across all is essential to prioritize.

Original description:

For the last month or so I've been seeing a smattering of shinken alerts like this:

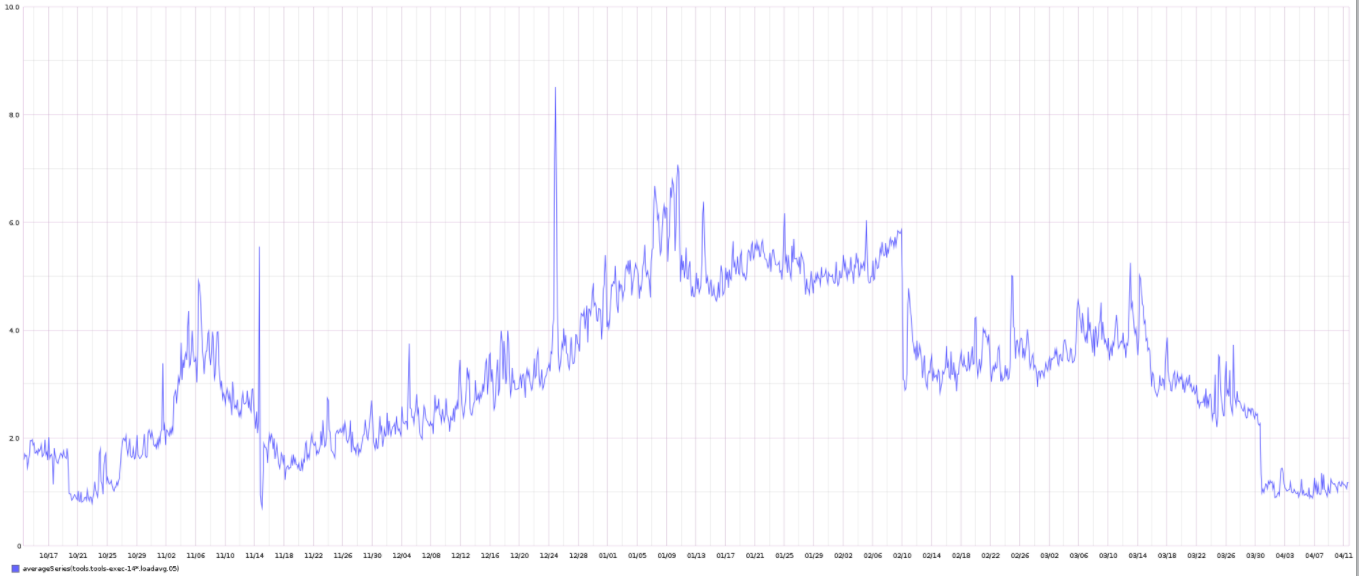
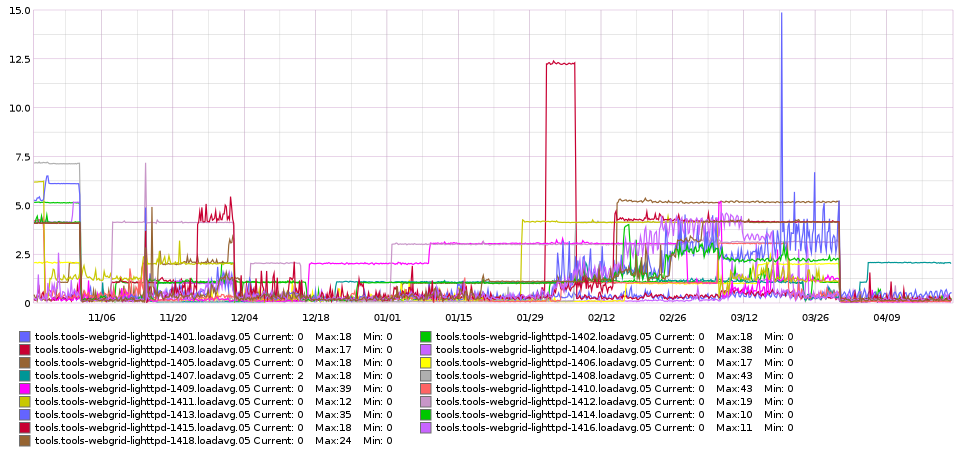
Notification Type: PROBLEM

Service: High iowait
Host: tools-exec-1408
Address: 10.68.18.14
State: WARNING

Date/Time: Fri 31 Mar 12:52:06 UTC 2017

Additional Info:

WARNING: tools.tools-exec-1408.cpu.total.iowait (>11.11%)

I've also seen them for webgrid nodes. I'm not sure if this is because the labvirts themselves are overloaded or if we just need new exec nodes.

Event Timeline

There are a very large number of changes, so older changes are hidden. Show Older Changes
Andrew triaged this task as Medium priority.Mar 31 2017, 2:33 PM
Andrew added a project: Cloud-Services.

I don't have anything definite and in spot checking I don't see the issue now unfortunately. Without catching this in action it is hard to know and it could be one tool floating around causing issues even. However, one thing to note is since we throttle NFS per instance in putting fewer instances out there, even if cpu and mem are fine, there is technically less bw available for NFS based storage work, and that generally shows up as io issues. We could up the threshold for individual nodes but that also increases the chances of individual tools causing resource spikes. With the idea being to smooth the load I vote more nodes and scaling out horizontally reducing the possibility of impact per tool.

From IRC discussions it seems like we are down 5 instances from Precise days count, I think we should reintroduce and see how it fares.

AFAICT this is the check that is alerting modules/toollabs/files/shinken.cfg:

# Check that no nodes have more than 50% iowait (warn) / 80% iowait (crit) for over 5 minutes
define service {
    check_command                  check_graphite_series_threshold!https://graphite-labs.wikimedia.org!10!$HOSTNOTES$.$HOSTNAME$.cpu.total.iowait!50!80!10min!0min!1!--over
    hostgroup_name                 tools
    service_description            High iowait
    use                            generic-service
}
chasemp renamed this task from iowait alerts for grid engine nodes to IO issues for Tools instances flapping with iowait and puppet failure.Apr 13 2017, 6:30 PM

I noticed we saw puppet failures from tools-exec-1432 this morning so I decided to take a look.

I untangled the layers in shinken to recreate the command that demonstrates failure for puppet:

/usr/lib/nagios/plugins/check_graphite -U https://graphite-labs.wikimedia.org -T 10 check_threshold tools.tools-exec-1432.puppetagent.time_since_last_run -W 3600 -C 43200 --from 10min --until 0min --perc 1 --over

This does return failure predictably and can be seen via:

https://graphite-labs.wikimedia.org/render/?width=951&height=494&_salt=1492096423.669&target=tools.tools-exec-1432.puppetagent.failed_events&from=-12h

Screen Shot 2017-04-13 at 1.32.35 PM.png (495×947 px, 36 KB)

This check is looking at the puppet run for any resource failing within. When I tracked back (after verification the failures were real) I saw what seems to be consistently some version of IO/NFS issues. It seems to coincide with high levels of bursty IO.

Error: /usr/local/sbin/nfs-mount-manager mount /mnt/nfs/labstore-secondary-tools-project returned 32 instead of one of [0]
Error: /Stage[main]/Role::Labs::Nfsclient/Labstore::Nfs_mount[tools-project-on-labstore-secondary]/Exec[ensure-nfs-tools-project-on-labstore-secondary]/returns: change from notrun to 0 failed: /usr/local/sbin/nfs-mount-manager mount /mnt/nfs/labstore-secondary-tools-project returned 32 instead of one of [0]

which is really the mount check portion of the process failing which triggers an attempt to mount from modules/labstore/manifests/nfs_mount.pp:

# Via exec to gracefully handle the frozen mount case where
# Puppet will normally get stuck and freeze raising load and effectively
# failing to run
exec { "create-${mount_path}":
    command => "/usr/bin/timeout -k 5s 10s /bin/mkdir ${mount_path}",
    unless  => "/usr/bin/timeout -k 5s 10s /usr/bin/test -d ${mount_path}",
    require => Mount[$mount_path],
}

or it surfaces as

Error: /Stage[main]/Toollabs/Exec[ensure-grid-is-on-NFS]/returns: change from notrun to 0 failed: /bin/false returned 1 ins
tead of one of [0]

Which is a sanity check within the Puppet run that ensures NFS is accessible before attempting to do work that would otherwise fail. This behavior is fairly transient and a manual run or the next Puppet run is usually clean.

In looking back at my IRC logs with grep -i PROBLEM $d | grep -i 'puppet run'| cut -d ' ' -f 8 | sort | uniq -c | sort -h; done I see the issue from the beginning of april but the pattern has changed:

#wikimedia-labs_20170401.log
      1 tools-exec-1401
      1 tools-exec-1402
      1 tools-exec-1403
      1 tools-exec-1404
      1 tools-exec-1405
      1 tools-exec-1406
      1 tools-exec-1407
      1 tools-exec-1408
      1 tools-exec-1409
      1 tools-exec-1410
      1 tools-exec-1412
      1 tools-exec-1413
      1 tools-exec-1415
      1 tools-exec-1416
      1 tools-exec-1420
      1 tools-exec-1421
      1 tools-exec-gift-trusty-01
      1 tools-worker-1001
#wikimedia-labs_20170402.log
#wikimedia-labs_20170403.log
      1 tools-checker-02
      1 tools-exec-1428
#wikimedia-labs_20170404.log
      1 fails
#wikimedia-labs_20170405.log
      1 tools-exec-1404
      1 tools-exec-1423
#wikimedia-labs_20170406.log
#wikimedia-labs_20170407.log
      1 tools-exec-1405
      1 tools-exec-1420
      1 tools-webgrid-generic-1401
#wikimedia-labs_20170408.log
      1 tools-bastion-05
      1 tools-webgrid-lighttpd-1404
      1 tools-worker-1008
#wikimedia-labs_20170409.log
#wikimedia-labs_20170410.log
      1 tools-exec-1418
      2 tools-exec-1415
#wikimedia-labs_20170411.log
      1 tools-exec-1430
      1 tools-exec-1432
      1 tools-exec-1433
      1 tools-webgrid-lighttpd-1416
      2 tools-exec-1434
#wikimedia-labs_20170412.log
      1 tools-exec-1428
      1 tools-exec-1430
      1 tools-webgrid-lighttpd-1416
      4 tools-exec-1432
#wikimedia-labs_20170413.log
      1 tools-bastion-03
      1 tools-exec-1434
      3 tools-exec-1432

https://wikitech.wikimedia.org/wiki/Nova_Resource:Tools/SAL

On 4/11 @Andrew introduced 5 new exec nodes which would then be the most likely to receive commonly scheduled small jobs that are most likely the IO burner here. Since 4/11 it has been almost exclusively these new instances.

2017-04-11 16:46 andrewbogott: added exec nodes tools-exec-1430, 31, 32, 33, 34.

It's possible we /still/ don't have quite enough exec nodes to handled the transition from precise. Precise nodes were reduced to 10 at the end of Nov 2016, to 5 on Jan 3, 2017 and then removed totally on March 14.

That means with in the last 6 months we went from an effective 42 exec nodes to an effective 34 now (where 10 of those were only added since 4/1.)

I still think we have some tools which are spawning intensive (and IO consuming) processes in small but frequent batches that need investigation:

tools-grid-master:~# tail -n 100000 /var/lib/gridengine/default/common/accounting | cut -d ':' -f 4,5 | sort | uniq -c | sort -h

look at 1432

 22 tools.himo:wikidatalink
 23 tools.avicbot:enwpcsd
 23 tools.hazard-bot:d-rfdarchiver
 24 tools.avicbot:comcsd
 25 tools.avicbot:uaaby5min
 26 tools.himo:commonscat2
 26 tools.xmlfeed:logrotate
 26 tools.yifeibot:jsubtest
 27 tools.ia-upload:cron_ia-upload
 27 tools.invadibot:inv-global-redirects
 27 tools.perfectbot:ListMovesAcrossNamespaces
 28 tools.avicbot:twitter
 29 tools.citationhunt:compute_fixed_snippets_global
 29 tools.geocommons:update
 30 tools.mjbmr:logrotate
 31 tools.mjbmrbot:fix
 33 tools.himo:newcate
 44 tools.liangent-php:php_populateCite_zhwiki
 59 tools.chie-bot:ChieBot
 72 tools.perfectbot:ListUtanDefaultsort
 80 tools.hazard-bot:en-sandbot_header
121 tools.ruarbcom:python2
123 tools.request:secWatch
160 tools.perfectbot:ListSpeedyDeletions
365 tools.wsexport:xvfb-run

looking at 1434

 27 tools.cydebot:cron-tools.cydebot-3
 28 tools.hazard-bot:d-rfdarchiver
 28 tools.himo:commonscat2
 28 tools.wmcounter:wmcounter
 29 tools.himo:wikidatalink
 29 tools.mjbmr:fix
 30 tools.avicbot:simplewpcsd
 30 tools.invadibot:inv-es-redirects
 30 tools.listeria:bot2
 30 tools.pb:pickle_stats
 32 tools.avicbot:uaaby5min
 32 tools.bene:run
 32 tools.mjbmrbot:fix
 34 tools.liangent-php:php_populateCite_zhwiki
 34 tools.xmlfeed:fix
 35 tools.invadibot:inv-global-redirects
 37 tools.citationhunt:compute_fixed_snippets_global
 44 tools.geocommons:update
 53 tools.chie-bot:ChieBot
 54 tools.hazard-bot:en-sandbot_header
 62 tools.perfectbot:ListUtanDefaultsort
130 tools.request:secWatch
165 tools.perfectbot:ListSpeedyDeletions
166 tools.ruarbcom:python2
357 tools.wsexport:xvfb-run

looking at 1430

 17 tools.invadibot:inv-global-redirects
 17 tools.listeria:bot2
 17 tools.xmlfeed:fix
 18 tools.himo:wikidatalink
 18 tools.incolabot:bar
 18 tools.mjbmrbot:fix
 18 tools.wmcounter:wmcounter
 19 tools.avicbot:comcsd
 19 tools.ia-upload:cron_ia-upload
 19 tools.pb:pickle_stats
 20 tools.bene:run
 20 tools.citationhunt:compute_fixed_snippets_global
 20 tools.xmlfeed:logrotate
 21 tools.geocommons:update
 22 tools.mjbmr-tools:fix
 22 tools.mjbmr-tools:logrotate
 24 tools.avicbot:simplewpcsd
 31 tools.liangent-php:php_populateCite_zhwiki
 32 tools.chie-bot:ChieBot
 34 tools.hazard-bot:en-sandbot_header
 48 tools.perfectbot:ListUtanDefaultsort
 63 tools.ruarbcom:python2
 69 tools.request:secWatch
 75 tools.perfectbot:ListSpeedyDeletions
150 tools.wsexport:xvfb-run

Looking at the last 100k entries in the accounting log:

tail -n 100000 /var/lib/gridengine/default/common/accounting | cut -d ':' -f 2 | sort | uniq -c | sort -h

2157 tools-exec-1430.tools.eqiad.wmflabs
2193 tools-exec-1423.tools.eqiad.wmflabs
2214 tools-exec-1407.eqiad.wmflabs
2243 tools-webgrid-generic-1401.eqiad.wmflabs
2261 tools-exec-1404.eqiad.wmflabs
2340 tools-exec-1421.tools.eqiad.wmflabs
2485 tools-exec-1403.eqiad.wmflabs
2671 tools-exec-1429.tools.eqiad.wmflabs
2674 tools-exec-1427.tools.eqiad.wmflabs
2795 tools-exec-1417.tools.eqiad.wmflabs
2874 tools-exec-1411.tools.eqiad.wmflabs
2917 tools-webgrid-generic-1403.eqiad.wmflabs
2986 tools-exec-1431.tools.eqiad.wmflabs
3020 tools-exec-1410.eqiad.wmflabs
3144 tools-webgrid-generic-1402.eqiad.wmflabs
3159 tools-exec-1408.eqiad.wmflabs
3257 tools-exec-1424.tools.eqiad.wmflabs
3358 tools-exec-1414.tools.eqiad.wmflabs
3362 tools-exec-1432.tools.eqiad.wmflabs
3399 tools-exec-1426.tools.eqiad.wmflabs
3637 tools-exec-1434.tools.eqiad.wmflabs
3791 tools-exec-1422.tools.eqiad.wmflabs
3796 tools-exec-1433.tools.eqiad.wmflabs
4002 tools-exec-1413.tools.eqiad.wmflabs
4236 tools-exec-1415.tools.eqiad.wmflabs

Looking at last 100k entries in accounting tools and job name tail -n 100000 /var/lib/gridengine/default/common/accounting | cut -d ':' -f 4,5 | sort | uniq -c | sort -h | tail -n 25

 588 tools.gerrit-reviewer-bot:gerrit_reviewer_bot
 588 tools.ia-upload:cron_ia-upload
 588 tools.incolabot:bar
 588 tools.invadibot:inv-es-redirects
 588 tools.mjbmrbot:fix
 588 tools.mjbmrbot:logrotate
 588 tools.mjbmr:logrotate
 588 tools.mjbmr-tools:fix
 588 tools.mjbmr-tools:logrotate
 588 tools.perfectbot:ListMovesAcrossNamespaces
 588 tools.sbot:filerenamings.bot
 588 tools.xmlfeed:fix
 590 tools.wmcounter:wmcounter
 685 tools.bene:run
 881 tools.liangent-php:php_populateCite_zhwiki
 978 tools.geocommons:update
1335 tools.chie-bot:ChieBot
1469 tools.perfectbot:ListUtanDefaultsort
1497 tools.hazard-bot:en-sandbot_header
2935 tools.request:secWatch
2937 tools.perfectbot:ListSpeedyDeletions
2937 tools.ruarbcom:python2
5567 tools.wsexport:xvfb-run
9107 tools.best-image:uwsgi-python-best-image
9115 tools.framabot:lighttpd-framabot

My suspicion is tools.wsexport:xvfb-run jobs are farmed out and the IO load is fairly heavy in many cases.

Examples:

root@tools-exec-1434:~# pidstat -l | grep ebook
03:58:51 PM 52561     26033    0.00    0.00    0.00    0.00     2  /bin/sh /usr/bin/xvfb-run -a ebook-convert /mnt/nfs/labstore-secondary-tools-project/wsexport/tool/http/../temp/c5_c0_Histoire_
03:58:51 PM 52561     26048    0.01    0.00    0.00    0.01     0  /usr/bin/python2.7 /usr/bin/ebook-convert /mnt/nfs/labstore-secondary-tools-project/wsexport/tool/http/../temp/c5_c0_Histoire_a

Looking at tools-exec-1432 as the most common recent offender.

root@tools-exec-1432
tools.p+ 21290 31643 97 16:33 ?        00:00:05 tesseract /data/project/phetools/cache/hocr/7e/58/af8b658d222de2ac414a8362f0e2/page_0448.tif /data/project/phetools/cache/hocr/7e/58/af8b658d222de2ac414a8362f0e2/page_0448 -l fra hocr
tools.p+ 21296 31643  0 16:33 ?        00:00:00 ddjvu -format=tiff -page=449 -subsample=1 /data/project/phetools/tmp/hocr/fr/Tocqueville_-_Œuvres_complètes,_édition_1866,_volume_7.djvu /data/project/phetools/cache/hocr/7e/58/af8b658d222de2ac414a8362f0e2/page_0449.tif``


```tools.wsexport@tools-bastion-03:~$ qstat
job-ID  prior   name       user         state submit/start at     queue                          slots ja-task-ID
-----------------------------------------------------------------------------------------------------------------
1199220 0.48623 xvfb-run   tools.wsexpo dr    01/19/2017 21:32:49 task@tools-exec-1418.tools.eqi     1
3820189 0.30231 lighttpd-w tools.wsexpo r     04/12/2017 15:05:52 webgrid-lighttpd@tools-webgrid     1
tools.phetools@tools-bastion-03:~$ qstat
job-ID  prior   name       user         state submit/start at     queue                          slots ja-task-ID
-----------------------------------------------------------------------------------------------------------------
3172131 0.33082 match_and_ tools.phetoo r     03/30/2017 18:56:25 continuous@tools-exec-1421.too     1
3172134 0.33082 extract_te tools.phetoo r     03/30/2017 18:56:41 continuous@tools-exec-1403.eqi     1
3172137 0.33082 ws_ocr_dae tools.phetoo r     03/30/2017 18:56:56 continuous@tools-exec-1401.eqi     1
3172139 0.33082 verify_mat tools.phetoo r     03/30/2017 18:56:59 continuous@tools-exec-1407.eqi     1
3172140 0.33082 wsircdaemo tools.phetoo r     03/30/2017 18:57:01 continuous@tools-exec-1409.eqi     1
3173091 0.33078 lighttpd-p tools.phetoo r     03/30/2017 19:19:17 webgrid-lighttpd@tools-webgrid     1
3868956 0.30007 hocr       tools.phetoo r     04/13/2017 14:50:20 task@tools-exec-1432.tools.eqi     1

thoughts:

  • Track down why these tools are submitting so many jobs and look for IO usage:
    • 1335 tools.chie-bot:ChieBot
    • 1469 tools.perfectbot:ListUtanDefaultsort
    • 1497 tools.hazard-bot:en-sandbot_header
    • 2935 tools.request:secWatch
    • 2937 tools.perfectbot:ListSpeedyDeletions
    • 2937 tools.ruarbcom:python2
    • 5567 tools.wsexport:xvfb-run
    • 9107 tools.best-image:uwsgi-python-best-image
    • 9115 tools.framabot:lighttpd-framabot
  • We could /still/ stand to add another 5 exec nodes at least.
  • We need to shore up our nfs-mount-manager logic so that it's not failing such pecular ways and leaves more of a track for what the failure actually is
  • 9107 tools.best-image:uwsgi-python-best-image
  • 9115 tools.framabot:lighttpd-framabot

These were both badly broken webservices that the watchdog component of webservice was trying to restart on every loop. There is an open task about adding some circuit breaker to that: T107878: Limit webservice manifest restarts

I spotted a handful of * * * * * ... crons and opened tasks to see if they could be run a bit less often:

There is a dashboard tool now that can be used to spot things that are execing a large number of jobs over time: https://tools.wmflabs.org/grid-jobs/

Are you sure you used the IO amount to get your report? I did a fix in phetools, but I didn't get why I was mentioned in this report, it's unclear if it was worth or not.

By the way, until I'm at it, I see you ulimit unlimited for core file size and core file are dumped to nfs, I saw recently, I don't remember where, a 1.5GB core file, that surely can hurt nfs, you could move them to /tmp, limit their size or tweak what is dumped in core file or whatsoever combinations of above fit your need.

Are you sure you used the IO amount to get your report? I did a fix in phetools, but I didn't get why I was mentioned in this report, it's unclear if it was worth or not.

phetool is mentioned here only because it was actively running a job on a host that was having issues. This task is more about open ended questions than conclusions at the moment.

By the way, until I'm at it, I see you ulimit unlimited for core file size and core file are dumped to nfs, I saw recently, I don't remember where, a 1.5GB core file, that surely can hurt nfs, you could move them to /tmp, limit their size or tweak what is dumped in core file or whatsoever combinations of above fit your need.

Good point we should clarify what we need to do here.

!log tools.cobot set crons to schedule on tools-exec-1422 only for testing. This tool is launching jobs that write and then read hundreds of megs in a few minutes. I caught it tripping up puppet on tools-exec-1437

0 0 1,15 * *  /usr/bin/jsub -mem 1G -l hostname=tools-exec-1422 -once ./vomit.sh
0 * * * * jsub -mem 700M -l hostname=tools-exec-1422 -once ./sargento.py
0 0 * * * jsub -mem 700M -l hostname=tools-exec-1422 -once ./actividad.py
*/5 * * * * jsub -mem 700M  -l hostname=tools-exec-1422 -once ./alertbot/teniente.py

alertbot/teniente.py

def addAlert(alerta):
    f = json.load(open("alertas"))
    f.append(alerta)
    open("alertas", "w").write(json.dumps(f))

During puppet runs failing:

cobot-1437.png (458×1 px, 252 KB)

and then a few minutes later on another exec

cobot-1421.png (250×1 px, 133 KB)

I see one maintainer for cobot and I can't find a Phab account for them https://wikitech.wikimedia.org/wiki/Shell_Request/MistrX

I see one maintainer for cobot and I can't find a Phab account for them https://wikitech.wikimedia.org/wiki/Shell_Request/MistrX

Account they link to from their wikitech profile is only attached on cswiki and has 23 edits in the last 2 years. Other than log files nothing in the tools.cobot directory has timestamps showing changes in the last 1+ years. The crontab has the MAILTO nulled out. I'm just going to shutdown the crons and leave a note on their talk page. If they are somehow using this data they can log in and re-enable them.

Mentioned in SAL (#wikimedia-labs) [2017-04-21T13:43:16Z] <chasemp> T161898 clush -g all 'sudo puppet agent --disable "rollout nfs-mount-manager"'

Change 349433 merged by Rush:
[operations/puppet@production] wmcs: better output from nfs-mount-manager

https://gerrit.wikimedia.org/r/349433

iowait errors over the past few weeks:

chasemp_freenode_#wikimedia-labs_20170401.log
      1 tools-grid-master
      1 tools-webgrid-lighttpd-1415
chasemp_freenode_#wikimedia-labs_20170402.log
chasemp_freenode_#wikimedia-labs_20170403.log
chasemp_freenode_#wikimedia-labs_20170404.log
chasemp_freenode_#wikimedia-labs_20170405.log
chasemp_freenode_#wikimedia-labs_20170406.log
chasemp_freenode_#wikimedia-labs_20170407.log
chasemp_freenode_#wikimedia-labs_20170408.log
      1 tools-webgrid-lighttpd-1415
chasemp_freenode_#wikimedia-labs_20170409.log
chasemp_freenode_#wikimedia-labs_20170410.log
chasemp_freenode_#wikimedia-labs_20170411.log
chasemp_freenode_#wikimedia-labs_20170412.log
chasemp_freenode_#wikimedia-labs_20170413.log
chasemp_freenode_#wikimedia-labs_20170414.log
chasemp_freenode_#wikimedia-labs_20170415.log
      1 tools-webgrid-generic-1402
chasemp_freenode_#wikimedia-labs_20170416.log
chasemp_freenode_#wikimedia-labs_20170417.log
chasemp_freenode_#wikimedia-labs_20170418.log
chasemp_freenode_#wikimedia-labs_20170419.log
chasemp_freenode_#wikimedia-labs_20170420.log
chasemp_freenode_#wikimedia-labs_20170421.log

I currently count 17 tools-webgrid-lighttpd-14* and 4 tools-webgrid-generic-14*. it looks like we previously had something like 37 tools-webgrid-lighttpd-[12|14]* and tools-webgrid-generic afaict was always small in number.

In looking at the last 90d effect on tools-webgrid-lighttpd-*

https://graphite-labs.wikimedia.org/render/?width=964&height=493&_salt=1492787997.234&target=cactiStyle(averageSeries(tools.tools-services-01.sge.hosts.tools-webgrid-lighttpd-12*.job_count))&from=00%3A00_20170101&target=cactiStyle(averageSeries(tools.tools-services-01.sge.hosts.tools-webgrid-lighttpd-14*.job_count))&until=23%3A59_20170421

Screen Shot 2017-04-21 at 10.23.45 AM.png (494×968 px, 54 KB)

We are clearly trending upward in job count on Trusty even after the dust has settled on migration from precise (even after some serious cleanup rounds)

We should create
The average job count per webgrid-lighttpd has increased dramatically.

We transitioned the bulk of this load to Trusty without a serious increase in nodes to handle it

https://graphite-labs.wikimedia.org/render/?width=964&height=493&_salt=1492787997.234&target=tools.tools-services-01.sge.hosts.tools-webgrid-lighttpd-12*.job_count&from=00%3A00_20170101&until=23%3A59_20170421

Screen Shot 2017-04-21 at 10.25.03 AM.png (496×965 px, 116 KB)

The effect on load for the trusty webgrid's has been curious. It was having a rough time during transition without a doubt and some work early in April leveled things off. But load isn't a perfect indicator of health for us esp with our shaping around NFS.

https://graphite-labs.wikimedia.org/render/?width=964&height=493&_salt=1492781999.747&target=cactiStyle(tools.tools-webgrid-lighttpd-14*.loadavg.05)&from=-180d&hideLegend=False

Screen Shot 2017-04-21 at 10.27.05 AM.png (459×963 px, 167 KB)

That load chart is incredibly curious considering

https://graphite-labs.wikimedia.org/render/?width=1200&height=600&_salt=1492781803.753&target=averageSeries(cactiStyle(tools.tools-services-01.sge.hosts.tools-webgrid-lighttpd-14*.job_count))&from=-90d

Screen Shot 2017-04-21 at 10.29.55 AM.png (603×1 px, 65 KB)

I think we should create 10 tools-webgrid-lighttpd-14* instances to make up for the 20 lost precise ones and see how jobs and load shift. Making 2 tools-webgrid-generic instances seems wise as well.

Puppet errors (previously Puppet run) alerts

chasemp_freenode_#wikimedia-labs_20170420.log
      1 tools-exec-1432
      1 tools-exec-1433
      2 tools-exec-1437
chasemp_freenode_#wikimedia-labs_20170421.log
      1 tools-exec-1441

I excluded one intentional alert for tools-exec-1437 I had triggered on the 21st.

Looking at 1441

root@tools-exec-1441:~# grep -i error /var/log/puppet.log*
/var/log/puppet.log.1:Error: /bin/false returned 1 instead of one of [0]
/var/log/puppet.log.1:Error: /Stage[main]/Toollabs/Exec[ensure-grid-is-on-NFS]/returns: change from notrun to 0 failed: /bin/false returned 1 instead of one of [0]

Time of apply per Puppet
root@tools-exec-1441:~# date -d @1492751718
Fri Apr 21 05:15:18 UTC 201

My logs (my timestamps are in another tz I'm sure)

[00:33:25] <shinken-wm> PROBLEM - Puppet errors on tools-exec-1441 is CRITICAL: CRITICAL: 60.00% of data above the critical threshold [0.0]
[01:08:25] <shinken-wm> RECOVERY - Puppet errors on tools-exec-1441 is OK: OK: Less than 1.00% above the threshold [0.0]

Point in time many hours later:

root@tools-exec-1441:~# pstree -lanp 28328
sge_execd,28328

├─sge_shepherd,17118 -bg
│   └─259823,17120 /var/spool/gridengine/execd/tools-exec-1441/job_scripts/259823
│       └─python,12543 /mnt/nfs/labstore-secondary-tools-project/olsibot/pywikibot-core/pwb.py welcome.py -random -pt:0 -limit:1
│           └─(git,12550)
├─sge_shepherd,26934 -bg
│   └─bash,26936 -c /mnt/nfs/labstore-secondary-tools-home/aka/pdredir/start.sh
│       └─perl,26963 step1_pd_holen.pl 2
│           ├─{perl},26967
│           └─{perl},26968

going back to Thu Apr 20 23:17:34 UTC 2017 in the accounting logs for this instance I see

 4 tools.citationhunt:compute_fixed_snippets_global
 4 tools.cydebot:cron-tools.cydebot-2
 4 tools.cydebot:cron-tools.cydebot-3
 4 tools.deltaquad-bots:cron-tools.deltaquad-bots-SPI
 4 tools.hashtags:svHashtagUpdate
 4 tools.hashtags:zhHashtagUpdate
 4 tools.himo:mredirect
 4 tools.himo:wikidatalink
 4 tools.mjbmrbot:fix
 4 tools.mjbmr-tools:fix
 4 tools.musikbot:copypatrol-fr
 4 tools.musikbot:perm_clerk
 4 tools.persondata:update_templatedata
 4 tools.totoazero:drp_warn
 4 tools.totoazero:unblock
 5 tools.avicbot:clean
 5 tools.avicbot:enwpcsd
 5 tools.avicbot:simplewpcsd
 5 tools.deltabot:cron1
 5 tools.himo:ref33
 5 tools.incolabot:bar
 5 tools.perfectbot:ListMovesAcrossNamespaces
 5 tools.perfectbot:ListSpeedyDeletions
 5 tools.request:secWatch
 6 tools.himo:commonscat2
 6 tools.himo:newrecent
 6 tools.listeria:bot2
 6 tools.mjbmr:fix
 6 tools.pb:pickle_stats
 6 tools.xmlfeed:fix
 6 tools.xmlfeed:logrotate
 7 tools.bothasava:DRY
 7 tools.cydebot:cron-tools.cydebot-1
 7 tools.hazard-bot:d-rfdarchiver
 7 tools.mjbmr-tools:logrotate
 7 tools.perfectbot:ListUtanDefaultsort
 7 tools.ryu:cron-tools.ryu-1
 7 tools.toolschecker:cron-tools.toolschecker-1
 7 tools.yifeibot:jsubtest
 8 tools.gerrit-reviewer-bot:gerrit_reviewer_bot
 8 tools.invadibot:inv-es-redirects
 8 tools.liangent-php:php_populateCite_zhwiki
 8 tools.mjbmrbot:logrotate
 9 tools.bene:run
 9 tools.mjbmr:logrotate
 9 tools.sbot:filerenamings.bot
11 tools.invadibot:inv-global-redirects
12 tools.geocommons:update
16 tools.chie-bot:ChieBot
31 tools.hazard-bot:en-sandbot_header

Going back the same duration I see accounting entries across the grid for these last few

954 tools.hazard-bot:en-sandbot_header

455 tools.chie-bot:ChieBot

336 tools.geocommons:update

I think we should create 10 tools-webgrid-lighttpd-14* instances to make up for the 20 lost precise ones and see how jobs and load shift. Making 2 tools-webgrid-generic instances seems wise as well.

@bd808 @madhuvishy @Andrew thoughts?

@madhuvishy or @Andrew do you have time to handle?

edit: average job count by webgrid since jan https://phab.wmfusercontent.org/file/data/jsxhwcdtiravowo4ec4f/PHID-FILE-xwhathh3545l42tbgvkq/Screen_Shot_2017-04-21_at_10.29.55_AM.png

I think we should create 10 tools-webgrid-lighttpd-14* instances to make up for the 20 lost precise ones and see how jobs and load shift. Making 2 tools-webgrid-generic instances seems wise as well.

I've added 8 nodes:

tools-webgrid-lighttpd-1420
tools-webgrid-lighttpd-1421
tools-webgrid-lighttpd-1422
tools-webgrid-lighttpd-1424
tools-webgrid-lighttpd-1425
tools-webgrid-lighttpd-1426
tools-webgrid-lighttpd-1427
tools-webgrid-lighttpd-1428

We could use a 17, 19 or 23 -- those builds were failures and I'll try again with them soon.

-1417 and -1419 are now in the process of puppetizing. This is a note to myself to remember to queue those two over the weekend.

OK, 1417 and 1419 are now up and pooled as well.

Chicocvenancio renamed this task from IO issues for Tools instances flapping with iowait and puppet failure to Tools instances flapping puppet failure alerts.Feb 16 2018, 2:37 PM
Chicocvenancio claimed this task.
Chicocvenancio updated the task description. (Show Details)

@chasemp mentioned that checking for a percentage of failing hosts might be a better alternative here.
I tried to analyse a bit of the patterns of adding failed events for all tools-* hosts and it seems we can get away with a simple sumSeries aggregate to get a minimal amount of false positives while also keeping the alerts relevant.
The final piece of the puzzle is to define warning and critical thresholds.

By the advanced analysis of "looking at this graph" I think we should define warning somewhere between 2 and 5.
I used a script (P6712) to see the number and date of alerts at each integer warning level in that range, based on that I vote 5 for warning and 15 for critical. A sanity check that this won't leave us unwarned in critical situations is definitely warranted.

We might also want to define another check that warns on sustained failures of a smaller number, such as between january 23 and 28 and february 10 and 13.

Change 411315 had a related patch set uploaded (by Chico Venancio; owner: Chico Venancio):
[operations/puppet@production] Graphite sumSeries to reduce shinken puppet failures false positves

https://gerrit.wikimedia.org/r/411315

Seriously thank you @Chicocvenancio for thinking about this -- a few notes:

We should probably loosen up on the high IO wait alert duration too, it's definitely a problem but the thresholds now are firing so often and when it's not actually causing issues that we've begun to ignore it. It scares me to be too liberal here but some of that is PTSD from historical potentially.

I talked with @Chicocvenancio about revising our current puppet failure / staleness alerting logic to alert on percentage of instances in the project (say if 10% are currently failing) rather than per-instance alerts in shinken. BUT I still think we have a problem with flapping that needs sto be investigated and solved, it's just we don't ahve time right now and we've been ignoring these constant flapping things for nearly a year or more and it's causing alert fatigue. It's still a problem to be solved but at the moment let's reduce the actively alerting check to be more actionable

@chasemp mentioned that checking for a percentage of failing hosts might be a better alternative here.
I tried to analyse a bit of the patterns of adding failed events for all tools-* hosts and it seems we can get away with a simple sumSeries aggregate to get a minimal amount of false positives while also keeping the alerts relevant.
The final piece of the puzzle is to define warning and critical thresholds.

By the advanced analysis of "looking at this graph" I think we should define warning somewhere between 2 and 5.
I used a script (P6712) to see the number and date of alerts at each integer warning level in that range, based on that I vote 5 for warning and 15 for critical. A sanity check that this won't leave us unwarned in critical situations is definitely warranted.

We might also want to define another check that warns on sustained failures of a smaller number, such as between january 23 and 28 and february 10 and 13.

Awesome work. Please let's start at 5 and then 10 just to be conservative, and a check to alert on sustained failures in smaller number would go a long way towards my anxiety about not keeping an eye on the underlying issue here.

Change 411315 had a related patch set uploaded (by Chico Venancio; owner: Chico Venancio):
[operations/puppet@production] shinken: WMCS: use sumSeries to reduce puppet failures false positves

https://gerrit.wikimedia.org/r/411315

Change 411315 merged by Rush:
[operations/puppet@production] shinken: WMCS: use sumSeries to reduce puppet failures false positves

https://gerrit.wikimedia.org/r/411315

Change 413632 had a related patch set uploaded (by Chico Venancio; owner: Chico Venancio):
[operations/puppet@production] shinken: WMCS: fix Sum of puppet failures service deffinition

https://gerrit.wikimedia.org/r/413632

Change 413632 merged by Rush:
[operations/puppet@production] shinken: WMCS: fix Sum of puppet failures service deffinition

https://gerrit.wikimedia.org/r/413632

One of the things I've found causing these failures is that there is a condition (one that is supposedly solved on the Red Hat Network that I cannot access, I hear) that causes Puppet to attempt to mount already mounted NFS mounts. This throws exit code 32 (already mounted), which puppet treats as a failure and kills the whole run.

In discussions at today's retrospective, one proposal discussed is to nice the puppet agent process on worker and exec nodes in toolforge, prioritizing user code, which could help with some things (or cause additional staleness alerts).

I've read this task and the code that is failing, but it's all very new to me, so please take my suggestions with a grain of salt.

It seems that with the increased load we see in labstore1004 following the kernel upgrade (T203254), some operations might take longer than usual. Would it make sense to increase the timeouts in nfs-mount-manager? They already seem very high for an NFS mount (20-30s), but I'm wondering if there is a situation where an I/O operation might get stuck while a subsequent one could work (my memory is a bit rusty about how this works in practice). In that vein, would it be useful to have shorter timeouts in nfs-mount-manager but retry the check operation a few times before giving up?

Another idea would be to simplify the code that gets triggered by Puppet to limit itself to only ensuring things are mounted and move the verification part over to the monitoring system. In doing this, we could just be shifting the alerts to a different area, but we could have a higher resolution by scheduling checks more often than the Puppet runs.

If you would like to implement any of these ideas, I can work on nfs-mount-manager and any Puppet/monitoring changes.

Finally, I've analyzed the past few days of Puppet failures, and it seems that, although NFS errors are the majority of it, there are some transient errors not related to Puppet (file locks and network issues) that fall outside of this ticket. It seems the situation around Puppet failures triggered by NFS failures have improved considerably if I understood the initial impact correctly :)

Good ideas, but this all far predates the kernel upgrades. The NFS performance from the servers also hasn't significantly degraded for clients (just for the servers from all metrics I can see). The NFS errors that cause this are that our puppetization often tries to mount NFS volumes that are already mounted (for some reason), which returns status 32 (in puppet, that's a failure). 32 in NFS means that it's already mounted. On the next run, the puppet setup notes the mount. The question is: why didn't it see it in the first place? also can we make it recognize 32 as success?

This all likely does relate to nfs-mount-manager anyway, and it may relate to other puppet mechanisms because some versions of puppet do this either way.

I think those are very good points. I'm taking quick pass at nfs-mount-manager just to improve error handling a little bit hoping it will get rid of at least a few of those alerts.

Change 460401 had a related patch set uploaded (by GTirloni; owner: GTirloni):
[operations/puppet@production] nfs-mount-manager: Add retry logic to check command

https://gerrit.wikimedia.org/r/460401

@Bstorm this change only adds the minimum amount of code required to retry the ls operation, in an attempt to introduce as little change as possible to an otherwise already complex situation. I'm happy to refactor the script once it goes through some real-world tests.

See my comments on the change. I'm suddenly wondering why we are using ls as our test. There might be some context in git. I'll check.

Change 460429 had a related patch set uploaded (by GTirloni; owner: GTirloni):
[operations/puppet@production] nfs-mount-manager - Switch from using ls to stat

https://gerrit.wikimedia.org/r/460429

Change 460401 abandoned by GTirloni:
nfs-mount-manager: Add retry logic to check command

Reason:
Gerrit doesn't like it when a repository is reset to an erlier revision

https://gerrit.wikimedia.org/r/460401

Change 460429 merged by Bstorm:
[operations/puppet@production] nfs-mount-manager - Switch from using ls to stat

https://gerrit.wikimedia.org/r/460429

Change 461632 had a related patch set uploaded (by GTirloni; owner: GTirloni):
[operations/puppet@production] shinken - Change Puppet thresholds

https://gerrit.wikimedia.org/r/461632

Change 461632 merged by GTirloni:
[operations/puppet@production] shinken - Change Puppet thresholds

https://gerrit.wikimedia.org/r/461632

Change 463581 had a related patch set uploaded (by GTirloni; owner: GTirloni):
[operations/puppet@production] shinken - Tweak Puppet thresholds

https://gerrit.wikimedia.org/r/463581

I've just realized my previous change was for the wrong alert ("Sum of Puppet errors"). Although that one seems to have very strict thresholds, this task is about the "Puppet errors" emails.

I've submitted a new change that I think is harmless but I'll until the weekend is over to merge it. It reverts the previous change and tweaks the "Puppet errors" alert (warn=2 failures, critical=3 failures, and look at the last 90min of data). In the original change, I was working with percentages but it seems this data point is actually for the number of failures (integer).

Change 463581 merged by GTirloni:
[operations/puppet@production] shinken - Tweak Puppet thresholds

https://gerrit.wikimedia.org/r/463581

Change 477013 had a related patch set uploaded (by GTirloni; owner: GTirloni):
[operations/puppet@production] toolforge: Increase shinken 'High iowait' time period to 30min

https://gerrit.wikimedia.org/r/477013

Change 477013 merged by GTirloni:
[operations/puppet@production] toolforge: Increase shinken 'High iowait' time period to 30min

https://gerrit.wikimedia.org/r/477013

Change 478880 had a related patch set uploaded (by GTirloni; owner: GTirloni):
[operations/puppet@production] toolforge: Increase shinken 'High iowait' time period to 60min

https://gerrit.wikimedia.org/r/478880

Change 478880 merged by GTirloni:
[operations/puppet@production] toolforge: Increase shinken 'High iowait' time period to 60min

https://gerrit.wikimedia.org/r/478880

Change 479187 had a related patch set uploaded (by GTirloni; owner: GTirloni):
[operations/puppet@production] toolforge: Increase shinken 'High iowait' to 70/90 warning/critical.

https://gerrit.wikimedia.org/r/479187

Change 479187 merged by GTirloni:
[operations/puppet@production] toolforge: Increase shinken 'High iowait' to 70/90 warning/critical.

https://gerrit.wikimedia.org/r/479187

Emails about Puppet failures have been rare now. Emails about High I/O wait still happen every other day but we don't do anything with them.

Since the high I/O wait is an inherent characteristic of our infrastructure (NFS and spinning disks), there isn't much we can do at this point regarding the monitoring itself. I'm going to close this task but feel free to re-open if this becomes troublesome again.