Count the daily requests with 'printable=yes' URLs (normally reached by clicking "Printable version" in the left sidebar on desktop)
Description
Description
| Status | Subtype | Assigned | Task | ||
|---|---|---|---|---|---|
| Resolved | Fomafix | T93746 Style for print is not applied at printable version | |||
| Declined | None | T51722 ResourceLoader does not process media queries for printable view with JS-added CSS | |||
| Declined | None | T134248 printableversion link in toolbox does not take viewed revision into account | |||
| Resolved | ovasileva | T167956 Deprecate printable version mode | |||
| Resolved | None | T167237 Determine number of "Printable version" clicks per day |
Event Timeline
Comment Actions
Answer: 398k/day during the week from May 22-28, excluding spiders. Very roughly, that corresponds to about [edit: fixed typo] 0.08% of our total pageviews (although of course a printed-out Wikipedia article is likely to be associated with vastly more reader attention / content consumption that one pageview in a web browser).
SELECT COUNT(*) AS printviews
FROM wmf.webrequest
WHERE
agent_type = 'user'
AND uri_query LIKE '%printable=yes%'
AND year = 2017 AND month = 5 AND day >= 22 AND day <= 28;

printviews
2787554
1 row selected (794.559 seconds)
Comment Actions
PS: Out of curiosity, I also looked at the numbers per country for that timespan. The differences are intriguing (e.g. Kenya, as the only African country besides South Africa in this top 50 list, had by far the highest print version click ratio, and China and Cambodia are also on the high end); but one would need a more thorough examination to determine if there are really persistent geographical differences in how often readers use this feature (on could start with comparing Global South with Global North, and looking at a longer timespan).
SELECT country, SUM(partprintrequests) AS printrequests,
ROUND(100*SUM(partprintrequests)/SUM(partpvs),2) AS printpercentage
FROM (
  SELECT geocoded_data['country'] AS country,
  SUM(IF(uri_query LIKE '%printable=yes%',1,0)) AS partprintrequests,
  SUM(IF(is_pageview,1,0)) AS partpvs
  FROM wmf.webrequest
  WHERE year = 2017 AND month = 5 AND day >= 22 AND day <= 28
  AND agent_type = 'user'
  GROUP BY geocoded_data) AS gpbygeod
GROUP BY country ORDER BY printrequests DESC LIMIT 50;
| country | printrequests | printpercentage |
|---|---|---|
| United States | 1158501 | 0.14 |
| Kenya | 231533 | 5.97 |
| Germany | 227123 | 0.1 |
| United Kingdom | 183139 | 0.1 |
| China | 100621 | 0.38 |
| Spain | 83539 | 0.12 |
| Bulgaria | 78155 | 0.8 |
| Netherlands | 66008 | 0.14 |
| Canada | 61365 | 0.06 |
| France | 57528 | 0.04 |
| India | 53859 | 0.04 |
| Brazil | 33476 | 0.04 |
| Japan | 31172 | 0.01 |
| Iran | 31126 | 0.04 |
| Australia | 29137 | 0.05 |
| Russia | 26472 | 0.02 |
| Italy | 23017 | 0.02 |
| Slovenia | 20529 | 0.49 |
| Vietnam | 20395 | 0.12 |
| Hong Kong | 17934 | 0.07 |
| Ukraine | 15971 | 0.04 |
| Mexico | 15887 | 0.02 |
| Switzerland | 13572 | 0.06 |
| South Africa | 10524 | 0.09 |
| Indonesia | 10222 | 0.03 |
| Taiwan | 9281 | 0.02 |
| Colombia | 7835 | 0.03 |
| Sweden | 7109 | 0.02 |
| Thailand | 7065 | 0.04 |
| New Zealand | 7060 | 0.07 |
| Romania | 6767 | 0.04 |
| Argentina | 6494 | 0.02 |
| Estonia | 6292 | 0.16 |
| Israel | 6063 | 0.03 |
| Denmark | 5674 | 0.05 |
| Republic of Lithuania | 5568 | 0.12 |
| Cambodia | 5329 | 0.36 |
| Poland | 5222 | 0.01 |
| Slovak Republic | 4431 | 0.07 |
| Norway | 4255 | 0.03 |
| Peru | 4245 | 0.02 |
| Singapore | 4095 | 0.03 |
| Chile | 3812 | 0.02 |
| Malaysia | 3651 | 0.02 |
| United Arab Emirates | 3561 | 0.04 |
| Republic of Korea | 3437 | 0.01 |
| Hungary | 3427 | 0.03 |
| Belgium | 3369 | 0.02 |
| Ireland | 3240 | 0.01 |
| Austria | 2856 | 0.01 |
50 rows selected (12161.217 seconds)
Comment Actions
That seems a particular bad week to analyse, due to the roll out of T24256: Change printable link to JavaScript `print()`. We should probably check for the week BEFORE and the week AFTER that particular week.
Comment Actions
@TheDJ Good point, I guess @ovasileva and I weren't aware of that context. Running a query for daily numbers during the time from May 15 to June 4 now.
Comment Actions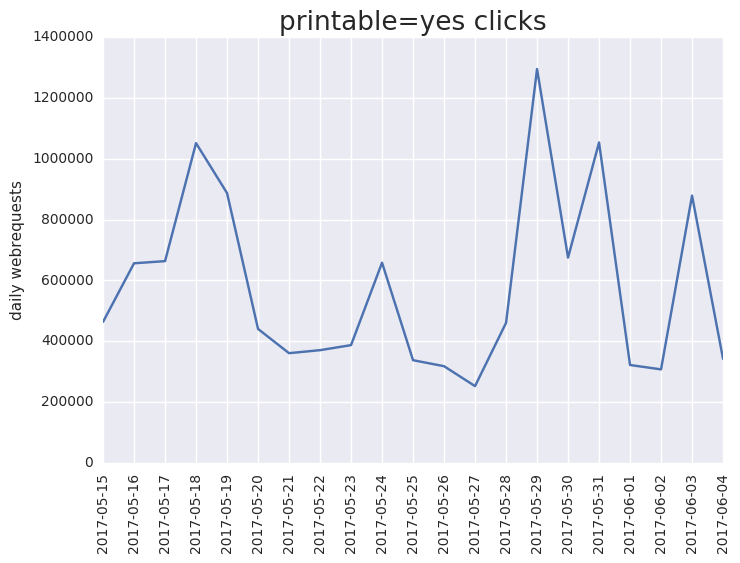
(Via SWAP notebook, cp ~tbayer/printable=yes%20clicks\ May-June\ 2017.ipynb .)
Here is a daily graph for the time from May 15 to June 4. When exactly did T24256 roll out - on May 28?
(Via SWAP notebook, cp ~tbayer/printable=yes%20clicks\ May-June\ 2017.ipynb .)
Comment Actions
@Tbayer partly on 23 and 24th for the smaller stuff, and the big wikipedias on june 1st it seems: https://www.mediawiki.org/wiki/MediaWiki_1.30/Roadmap (1.30.0-wmf.2)
Not really a significant influence it seems so far I guess. But there is a lot of variance there in that graph.. A lot more than I would have anticipated (maybe it correlates with the overall traffic those days. Any way, it's anywhere between 0.01-0.15 % of pageviews if I'm basing it on 650 million daily average of pageviews (incl. robots, spiders etc, all projects)
Comment Actions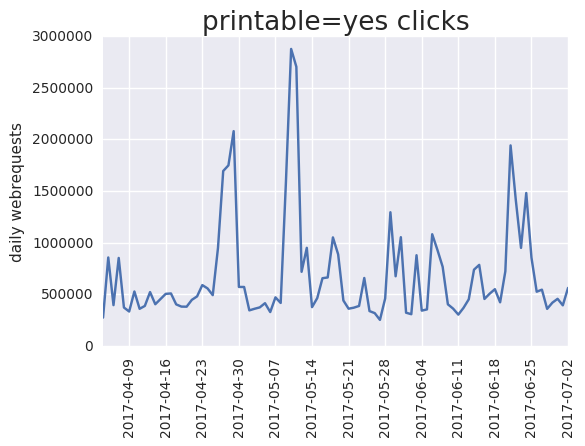
Looking at this fuller picture, it seems like there is a baseline of about 400-500k/day (which, again, would correspond to about 0.08 to 0.09% of the ca. 530 million daily non-spider pageviews) , and various spikes on top of it.
OK, here is an extension of the previous graph, now covering April 4-July 2:
Looking at this fuller picture, it seems like there is a baseline of about 400-500k/day (which, again, would correspond to about 0.08 to 0.09% of the ca. 530 million daily non-spider pageviews) , and various spikes on top of it.
BTW I also checked that all those requests are actually human (more precisely, 100.0% had agent_type = 'user' on each day from June 25 to July 2).
Data sources: see previously mentioned SWAP notebook
Closing this now; feel free to reopen in case there are further questions.
Comment Actions
It's weird, I really had expected to see a big drop somewhere due to more JS prints.... I'm amazed that it's not there. I can't explain it.