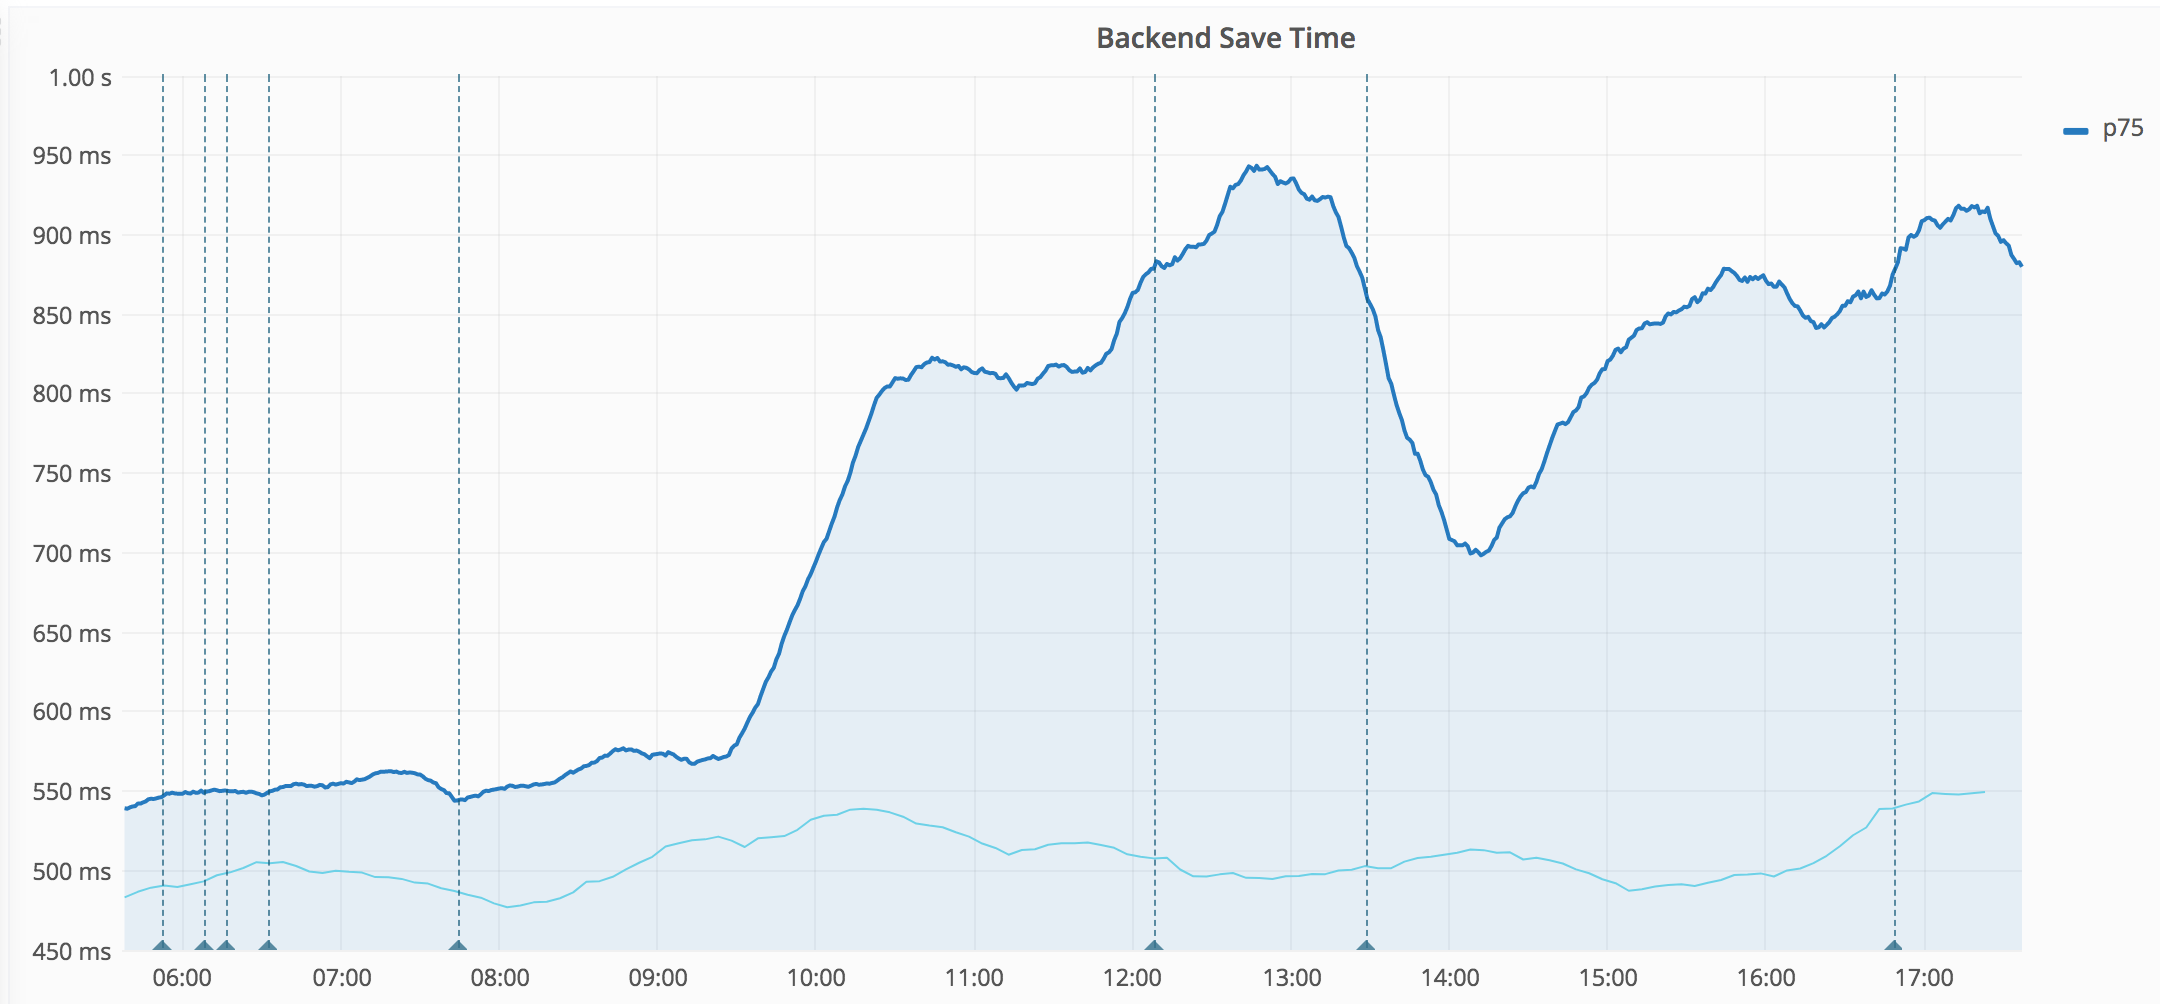
The p75 shot all the way up to 2.4s. The edit rate around that time is twice of last week's at the same time. Further investigation is required.
| • Gilles | |
| Jul 3 2017, 7:49 AM |
| F8633961: Screen Shot 2017-07-06 at 11.01.20.png | |
| Jul 6 2017, 7:18 PM |
| F8634063: Screen Shot 2017-07-06 at 11.19.56.png | |
| Jul 6 2017, 7:18 PM |
| F8633836: Screen Shot 2017-07-06 at 10.41.11.png | |
| Jul 6 2017, 7:18 PM |
| F8633818: Screen Shot 2017-07-06 at 10.39.21.png | |
| Jul 6 2017, 7:18 PM |
| F8634367: Screen Shot 2017-07-06 at 12.12.46.png | |
| Jul 6 2017, 7:18 PM |
| F8634366: Screen Shot 2017-07-06 at 12.12.34.png | |
| Jul 6 2017, 7:18 PM |
| F8633959: Screen Shot 2017-07-06 at 10.59.21 1.png | |
| Jul 6 2017, 7:18 PM |
| F8627919: Screen Shot 2017-07-05 at 23.11.14.png | |
| Jul 6 2017, 6:11 AM |
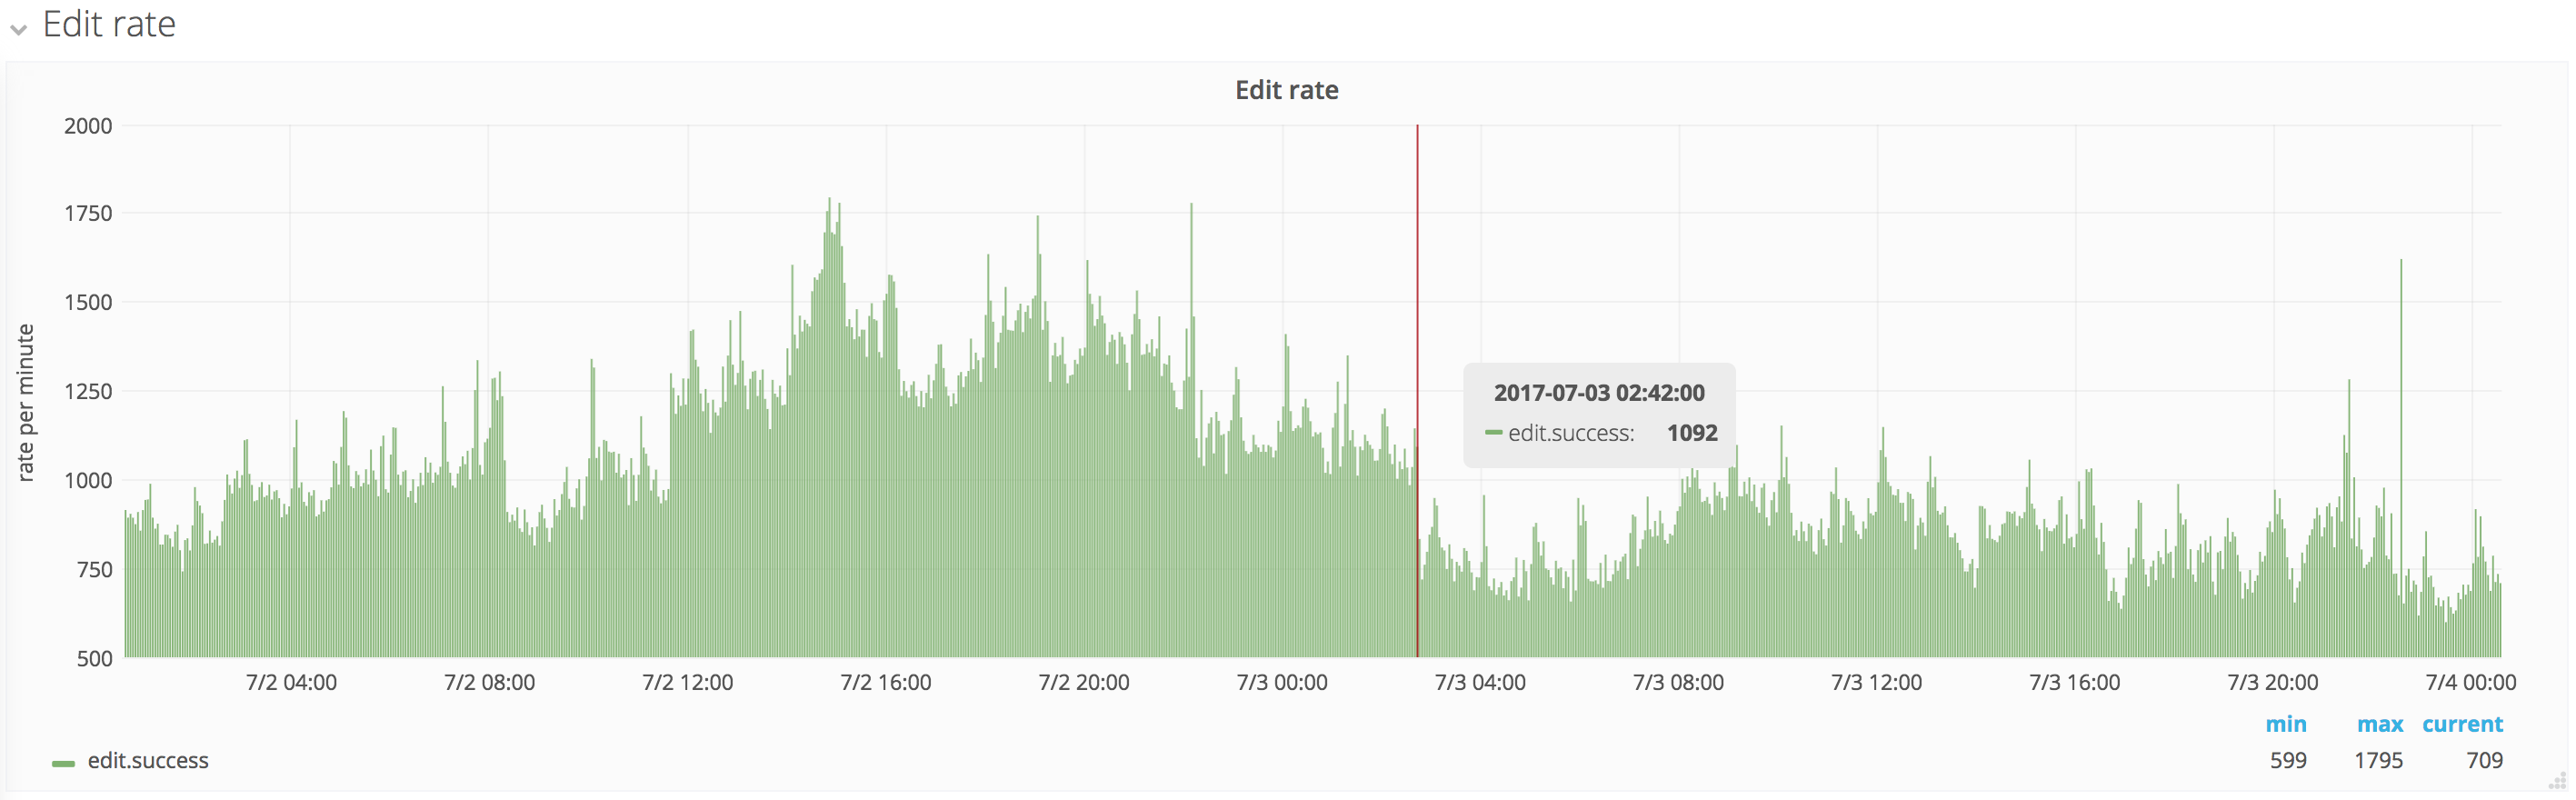
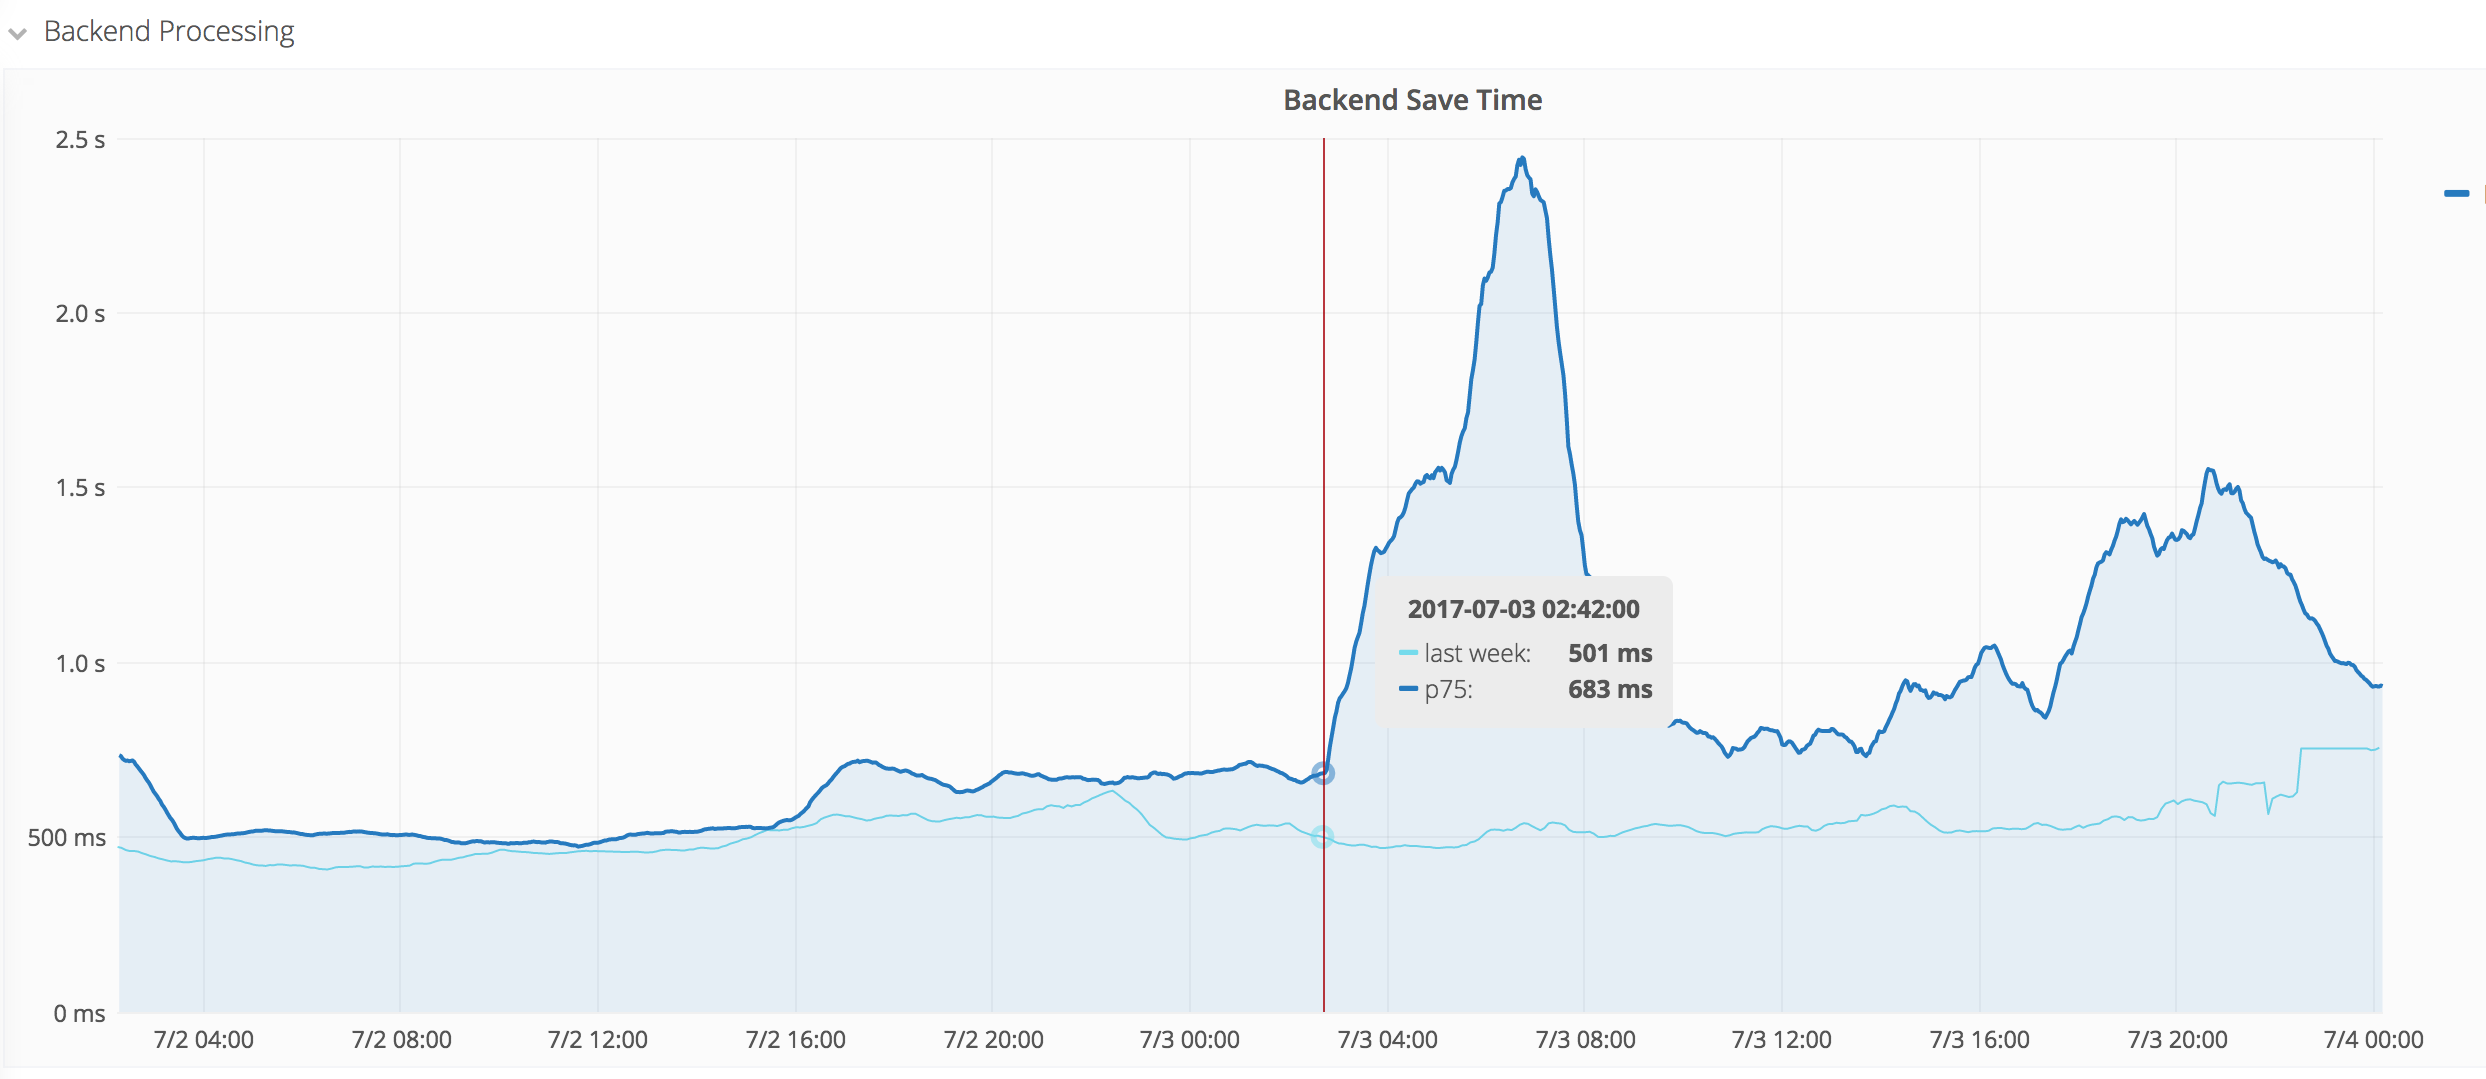
The p75 shot all the way up to 2.4s. The edit rate around that time is twice of last week's at the same time. Further investigation is required.
The biggest part of the spike is over, however we're not back to usual levels yet. It would be nice to understand those spikes regardless.
The spike from today isn't reflected at all in frontend save timing, which might suggest that it's about bot/API edits?
| 2017-07-03 02:42 UTC | Increase starts (red vertical line below) |
| 2017-07-03 05:18 UTC | Second increase starts |
| 2017-07-03 06:44 UTC | Peak |
| 2017-07-03 07:12 UTC | Decrease starts |
| 2017-07-03 10:30 UTC | Decrease ends |
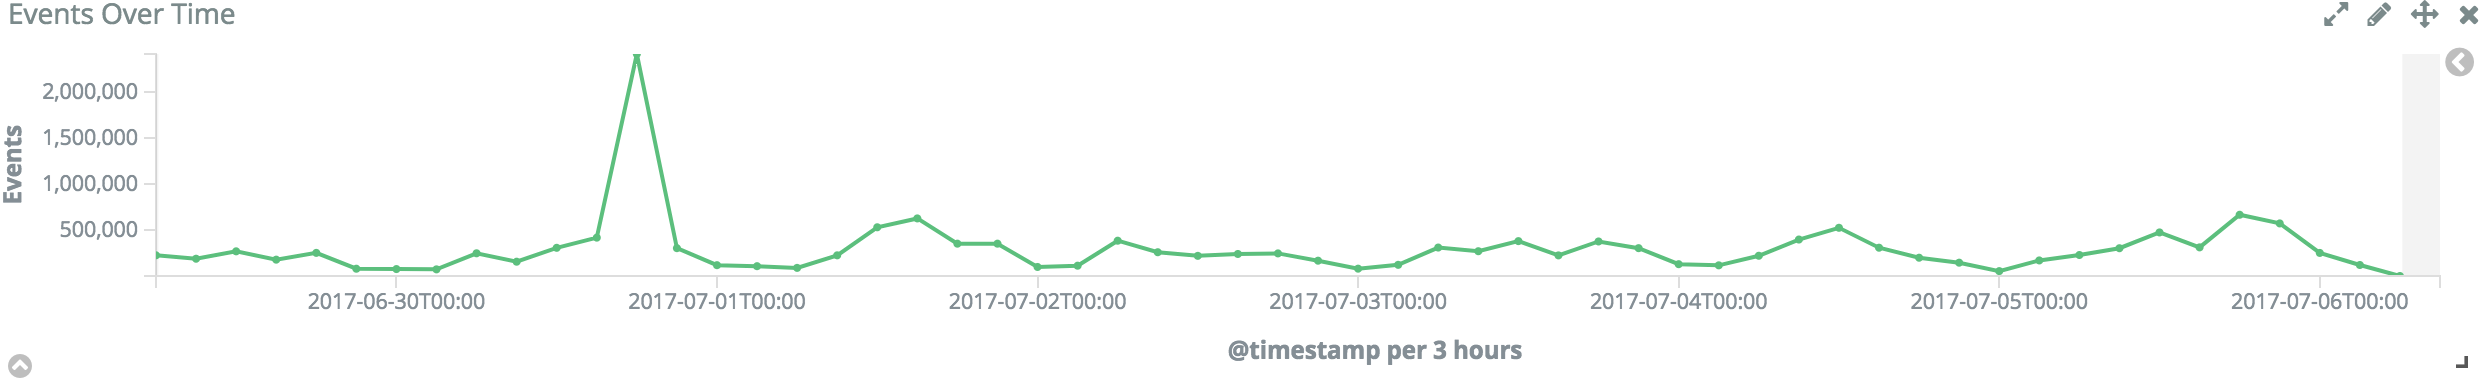
Edit count, while higher than last week around that time, actually shows a sharp drop right at 02:42 when the increase starts. Probably unrelated, but interesting nonetheless.
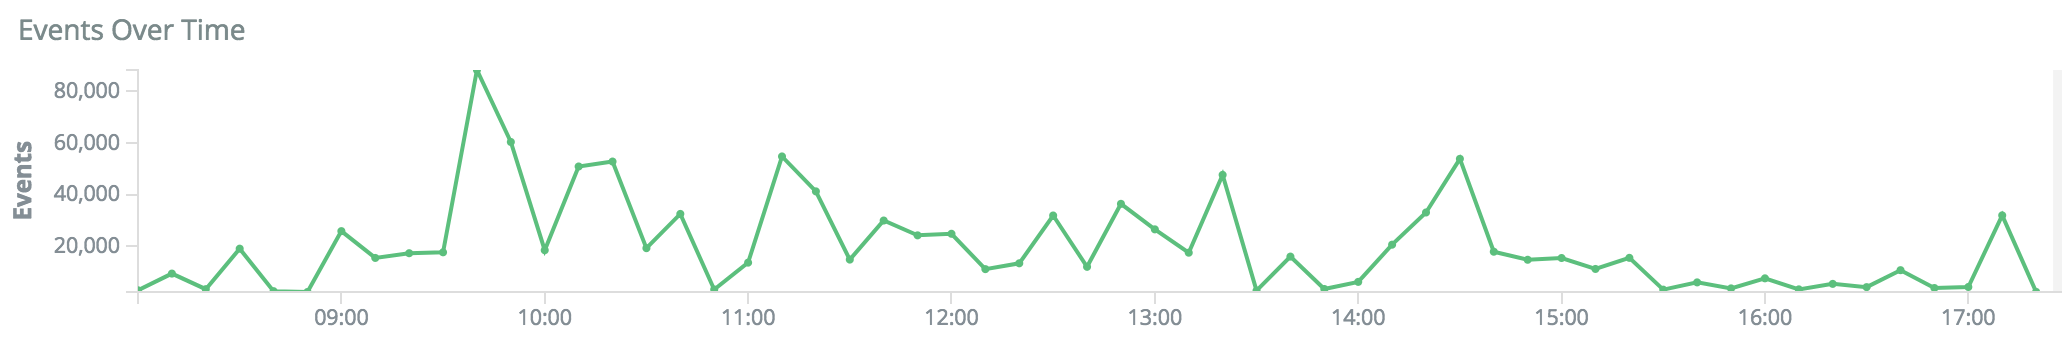
Very few events in the Server admin log around that time:
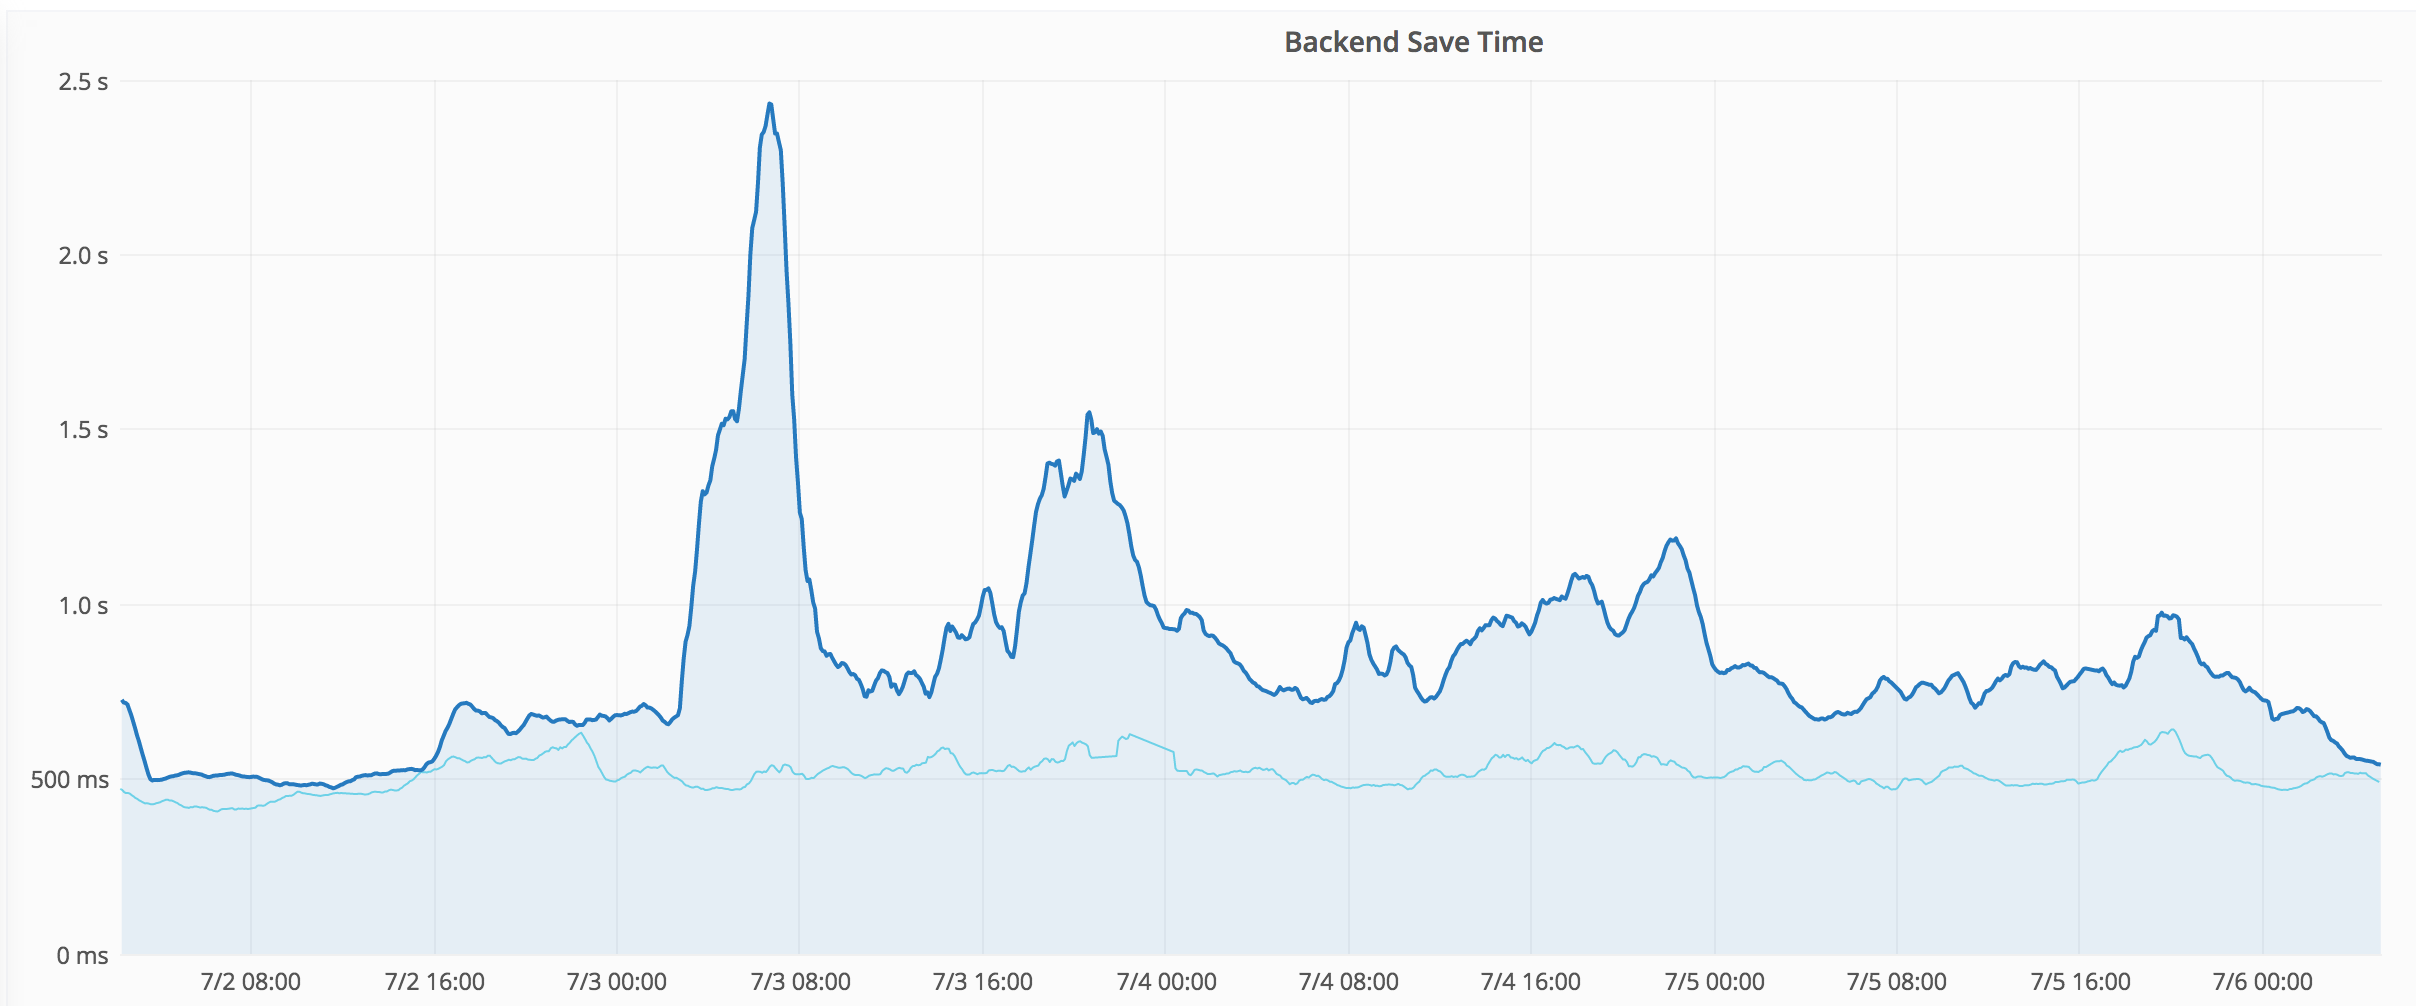
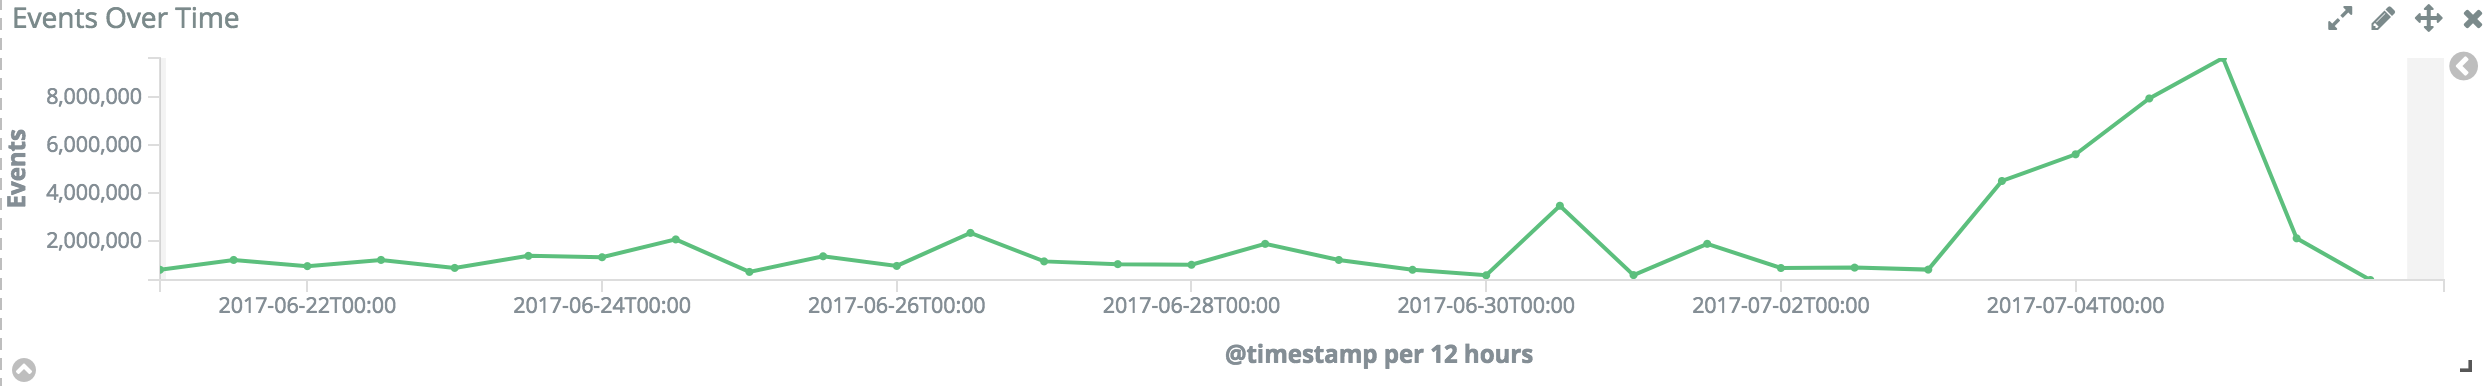
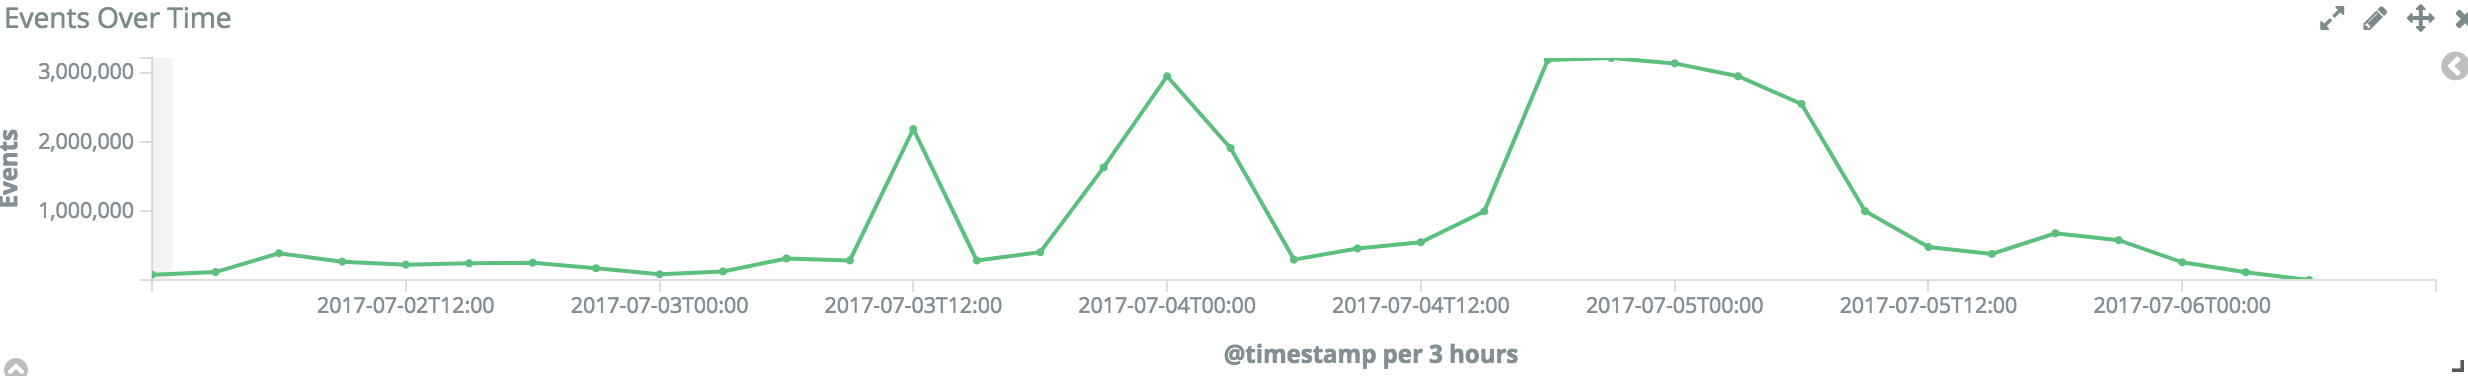
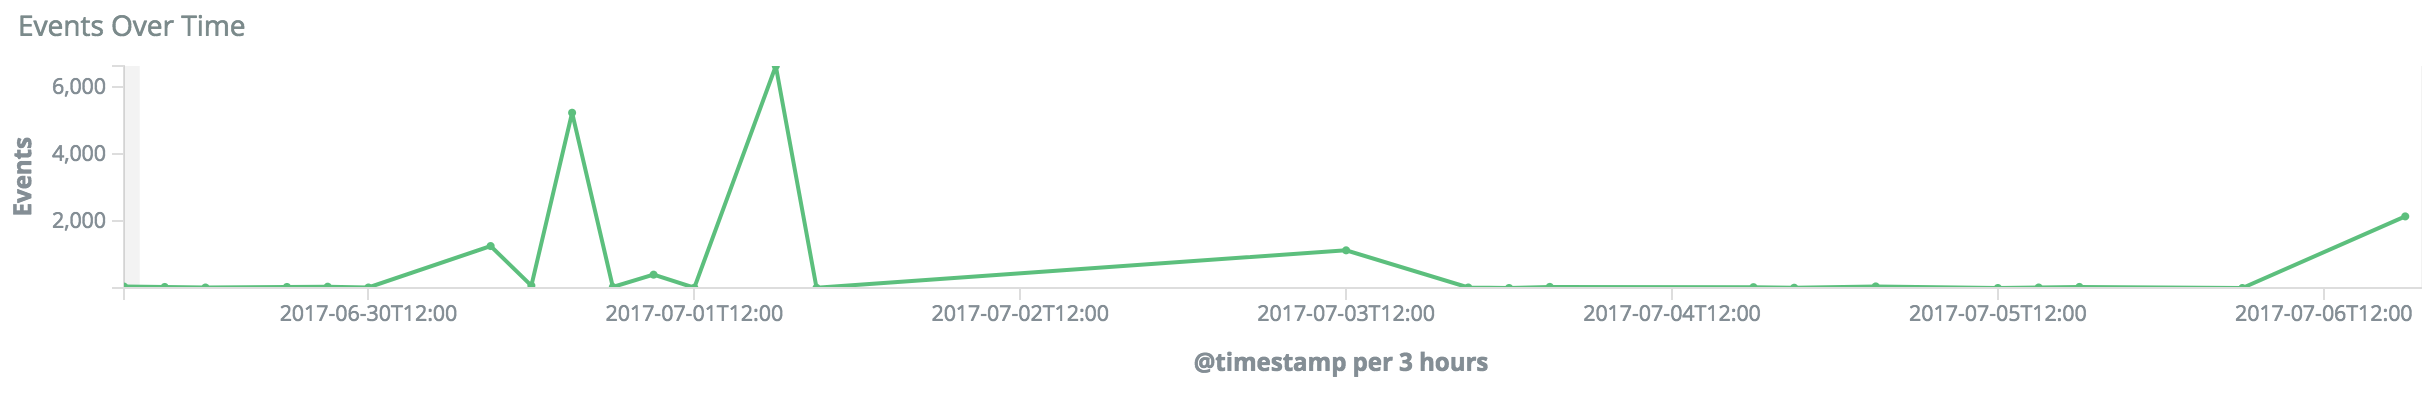
Another day has past and two more medium-size spikes on record:
It's now finally back to last week's levels.
A few more potentially relevant log entries:
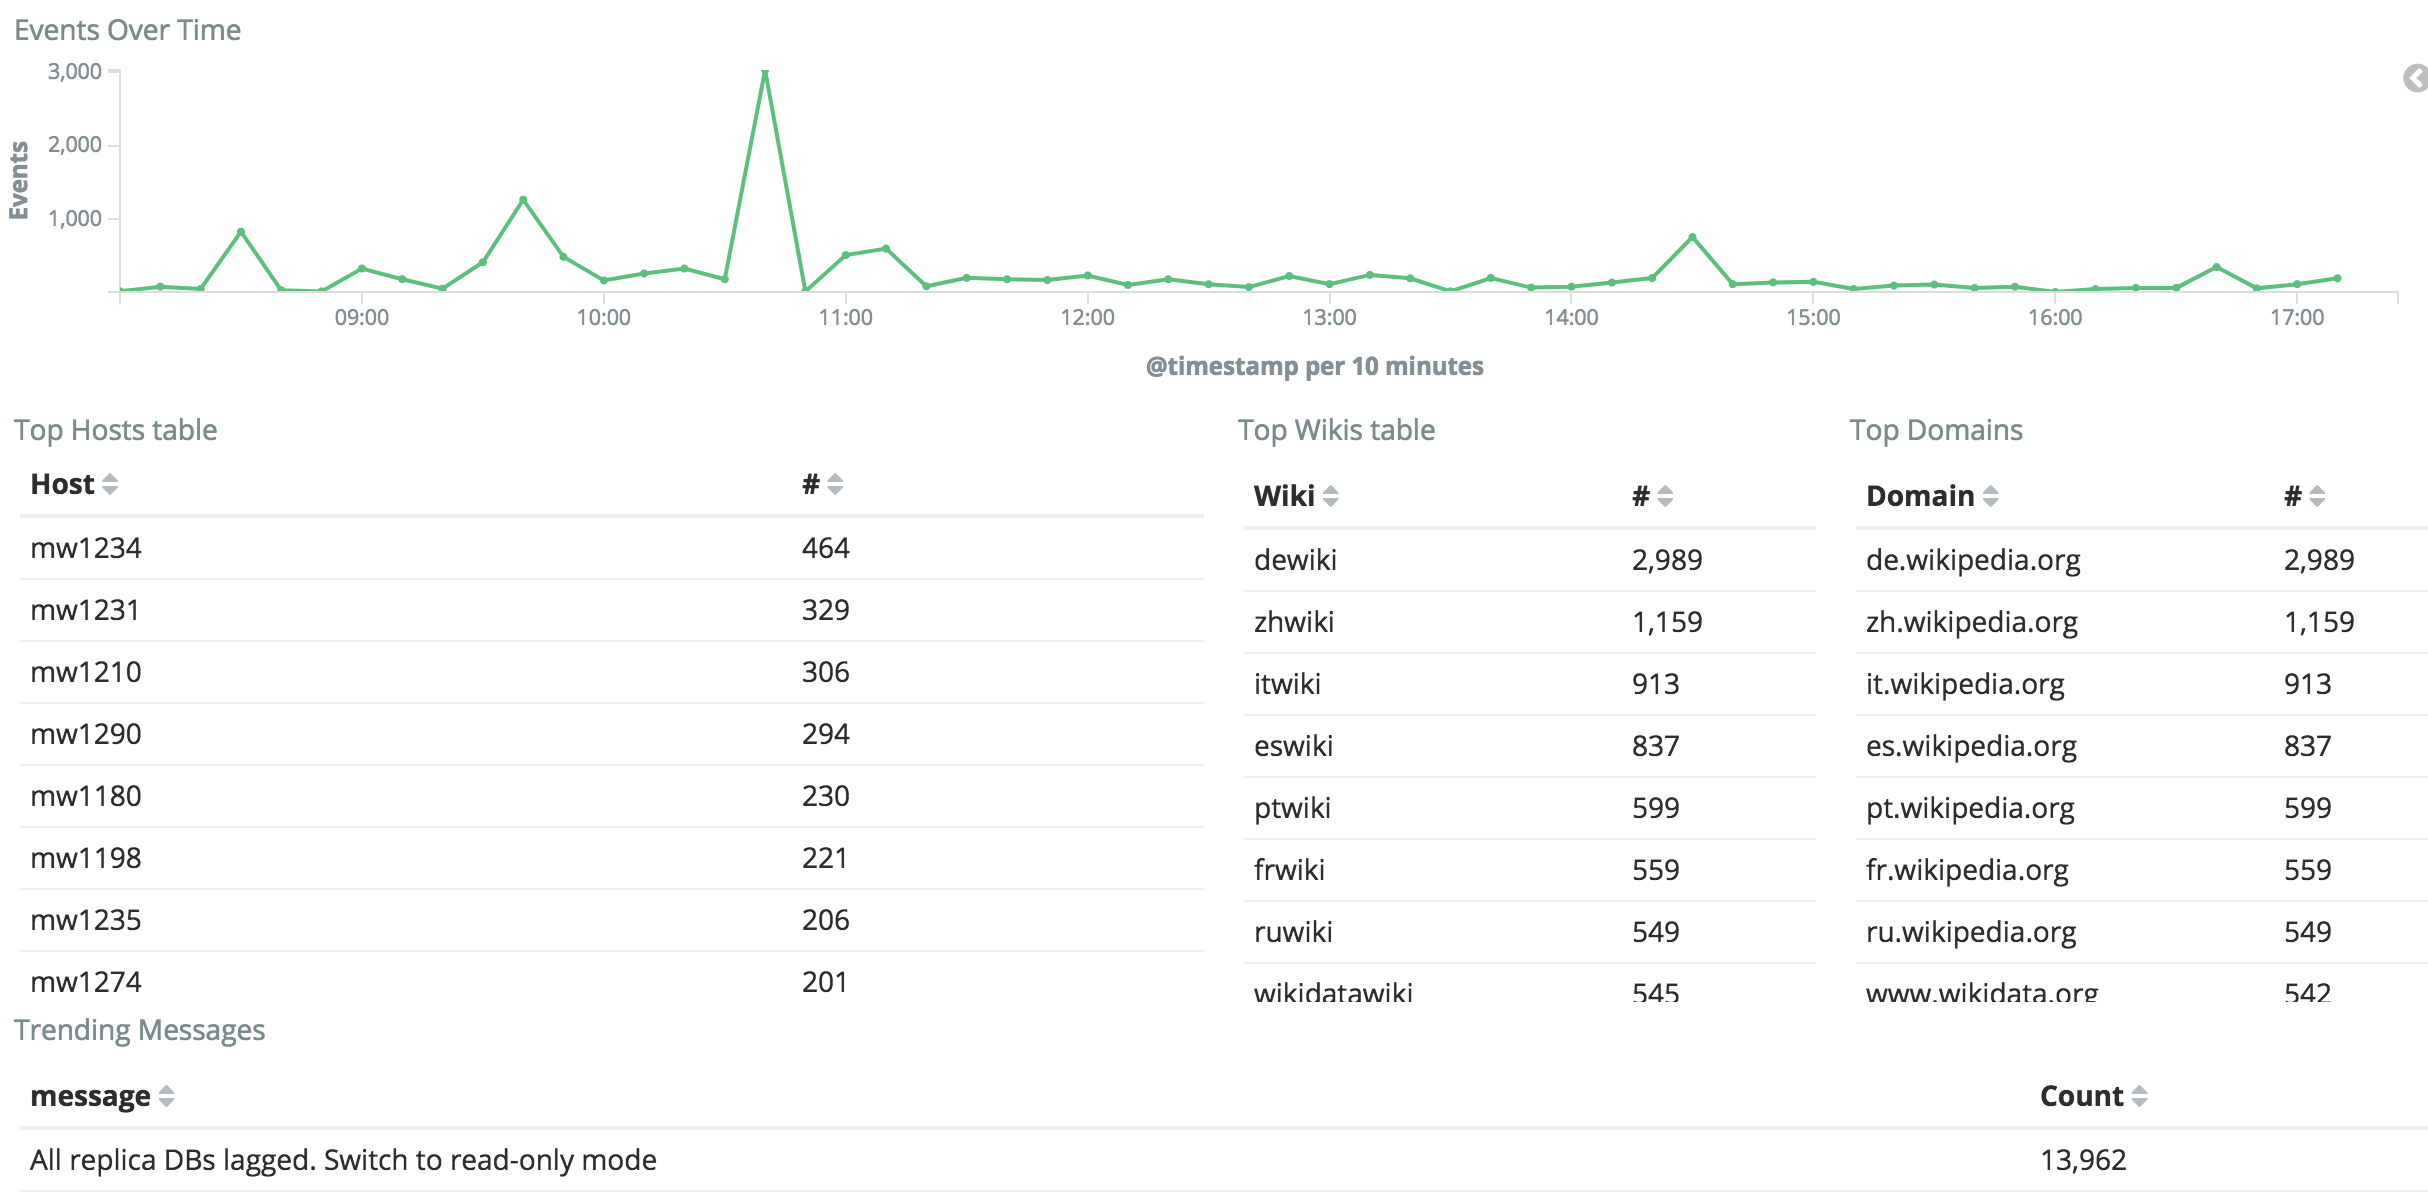
It seems none of these SAL entries really stand out as a particularly likely cause. Looking at the Logstash "mediawiki-errors" dashboard, I find a significant spike that shows hope to find the cause here:
https://logstash.wikimedia.org/app/kibana#/dashboard/mediawiki-errors (last 7 days)
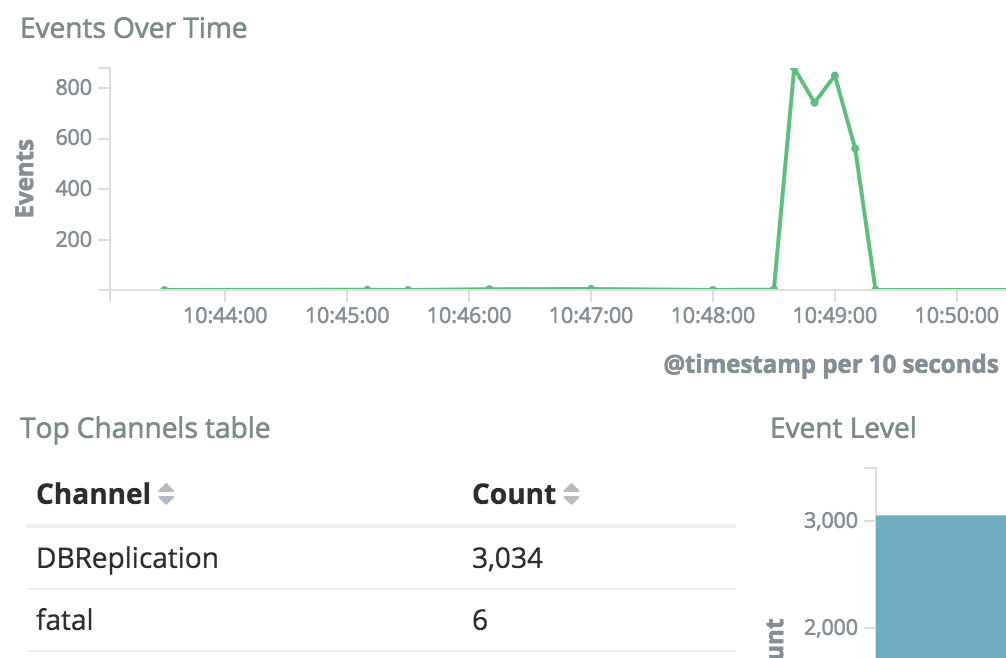
This error count graph roughly fits the Backend Save Timing graph:
The peak from the normal 75k/hour to 1M+/hour errors mostly happened in the DBReplication channel (31,000,000 entries in 2 days).
Trending messages:
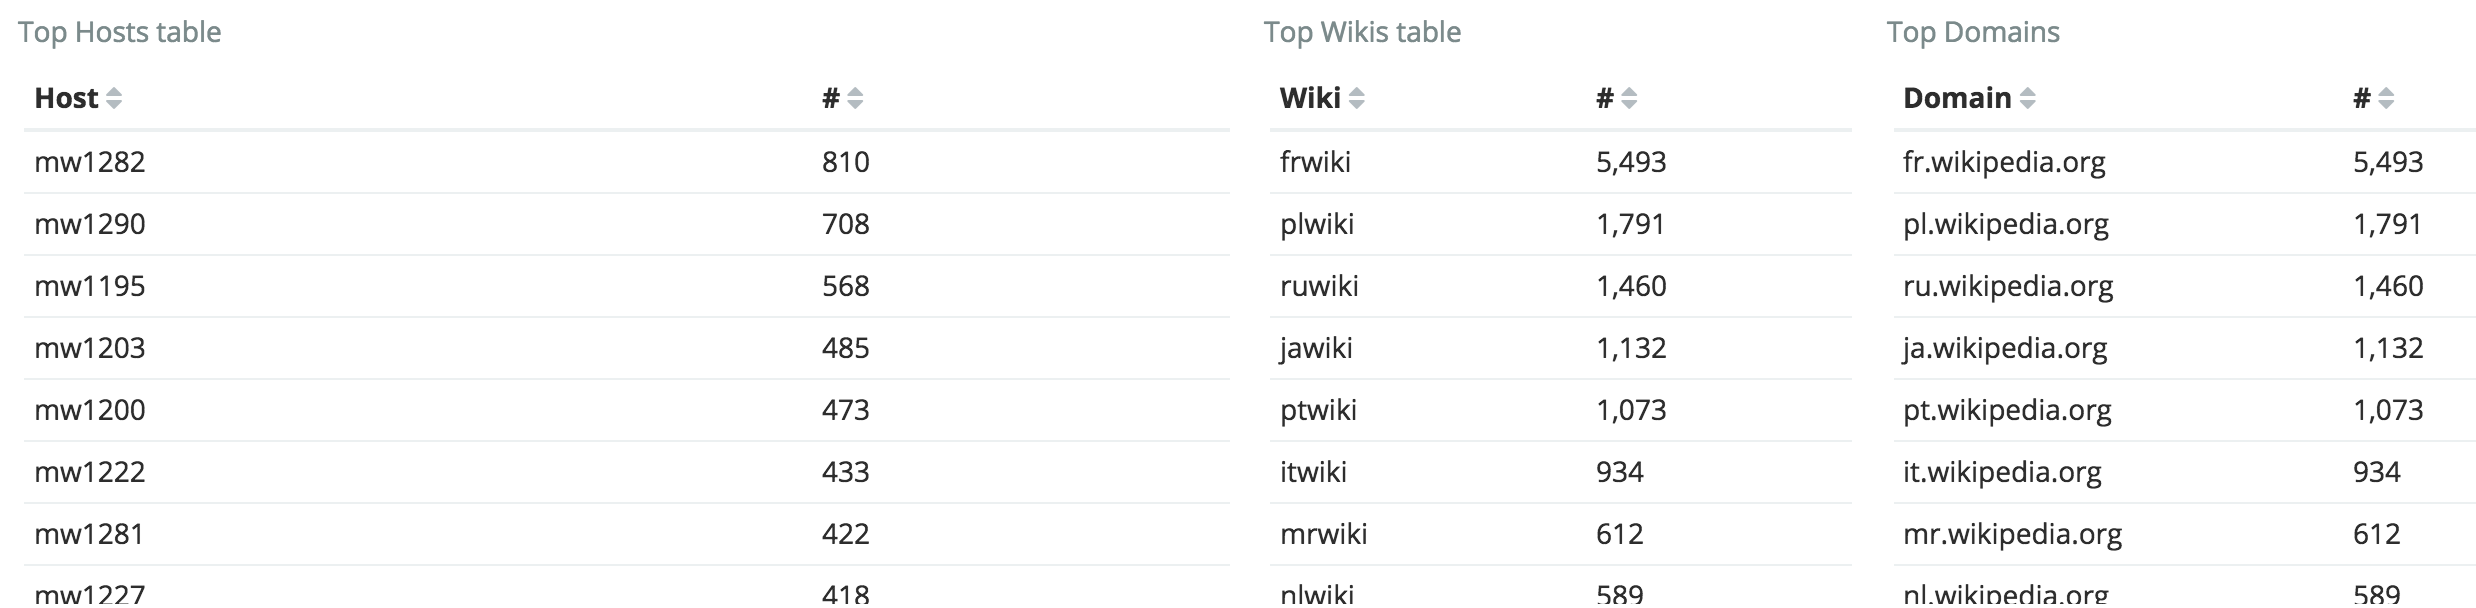
While these peaks do align with the save timing regression, the vast majority are from codfw due to the masters there undergoing database maintenance.
Same query without codfw:
https://logstash.wikimedia.org/goto/290e86c376f96c4ece5aa125986edac3
No longer 4 spikes, just one. Might still be worth investigating:
Taking a portion of the delayed logs: https://logstash.wikimedia.org/goto/1f62bc3a37a984e10a3ed065b71efe07
That shows codfw being delayed, which was real because we were running a big alter table there (T166204#3400068) but that shouldn't affect anything, no?
Does the backend save timing metric, as it is measured, also include post-response work? If some of the DB work is done after responding to the client and is subject to performance swings, that would explain why we're seeing spikes on the backend save time not reflected on the frontend metric.
If this helps, normally, when we depool the slaves we make sure nothing is running before starting the alters
We only measures up-to request shutdown.
Just happened again this UTC morning and still on-going:
https://grafana.wikimedia.org/dashboard/db/save-timing?from=1499319574565&to=1499362774565
| Last 12 hours | Last 7 days |
|---|---|
 |  |
| Read-only errors | Read-only errors (biggest spike) |
|---|---|
 |  |
| Server db1035 is not replicating? |
|---|
| https://logstash.wikimedia.org/goto/ae539706facedcdd56f534b3bda1b0fe |
 |
 |
ERROR DBReplication Server db1035 is not replicating? (peak: 200x per minute)
ERROR DBReplication Server db1035 is not replicating?
...
The aggregated graph for lag is: https://grafana.wikimedia.org/dashboard/db/mysql-aggregated?orgId=1&from=1499327621364&to=1499414021364&var-dc=eqiad%20prometheus%2Fops&var-group=core&var-shard=All&var-role=All
Checking some of the db servers which are supposed to be lagging behind I cannot see anything on the graphs (ie: db1026 and db1045)
https://grafana.wikimedia.org/dashboard/db/mysql?orgId=1&var-dc=eqiad%20prometheus%2Fops&var-server=db1026&from=1499241454200&to=1499414254200
https://grafana.wikimedia.org/dashboard/db/mysql?orgId=1&var-dc=eqiad%20prometheus%2Fops&var-server=db1045&from=1499241478591&to=1499414278592
Regarding that error about db1035, that is weird. I don't see any issues on its log (ie: replication broken, or any disconnection from its master).
On that server there is a spike on writes around 2:30AM: https://grafana.wikimedia.org/dashboard/db/mysql?orgId=1&var-dc=eqiad%20prometheus%2Fops&var-server=db1035&from=1499384970549&to=1499409131965
But it doesn't correlate with a spike or lag or load or anything similar: https://grafana.wikimedia.org/dashboard/db/mysql?panelId=6&fullscreen&orgId=1&var-dc=eqiad%20prometheus%2Fops&var-server=db1035&from=1499384970549&to=1499409131965
The writes spike happens on the master (expected to go to the slave then): https://grafana.wikimedia.org/dashboard/db/mysql?orgId=1&var-dc=eqiad%20prometheus%2Fops&var-server=db1075&from=1499384970549&to=1499409131965
We are having more traffic than usual: https://grafana.wikimedia.org/dashboard/file/varnish-http-errors.json?refresh=5m&orgId=1&from=1499241833077&to=1499414633077
Closing for now as the regression has recovered. Unfortunately we didn't find out what caused it. We did find various suspicious errors in the logs, that I hope will be further looked into. But perhaps better tracked in their own task (e.g. check if those read-only warnings happen more often, and if so what is causing those - having regular read-only periods for several periods of 30 minutes every day is obviously not good service). Could be that MediaWiki is activating read-only too soon, could also be that there are actual lag problems, or something in-between.
Read-only activates for bots sooner, which might lower the edit rate and change the distribution of edits (slower/faster, the ratio with navtiming going up, and such). I'm not sure that would make spikes itself. Actually replication lag adds on to save time, so that can certainly make spikes in navtiming due to ChronologyProtector.