Page MenuHomePhabricator

Investigate load spikes on the elasticsearch cluster in eqiad
Closed, ResolvedPublic

Assigned To
Authored By
dcausse
Jul 3 2017, 9:06 AM
Referenced Files
F8979355: el22.tar.gz
Aug 7 2017, 12:53 PM
F8979354: el26.tar.gz
Aug 7 2017, 12:53 PM
F8920378: cirrus alerts in july vs high volume ip's
Aug 1 2017, 5:43 AM
F8918880: heavy users of search, july 31 18:00-21:59
Jul 31 2017, 11:46 PM
F8641264: Sélection_014.png
Jul 7 2017, 8:16 AM
F8603222: Sélection_013.png
Jul 3 2017, 9:06 AM
Tokens
"The World Burns" token, awarded by hashar."Like" token, awarded by Smalyshev."Love" token, awarded by faidon."Party Time" token, awarded by debt.

Description

Since few days the cluster is showing performance issues causing a spike in percentiles.
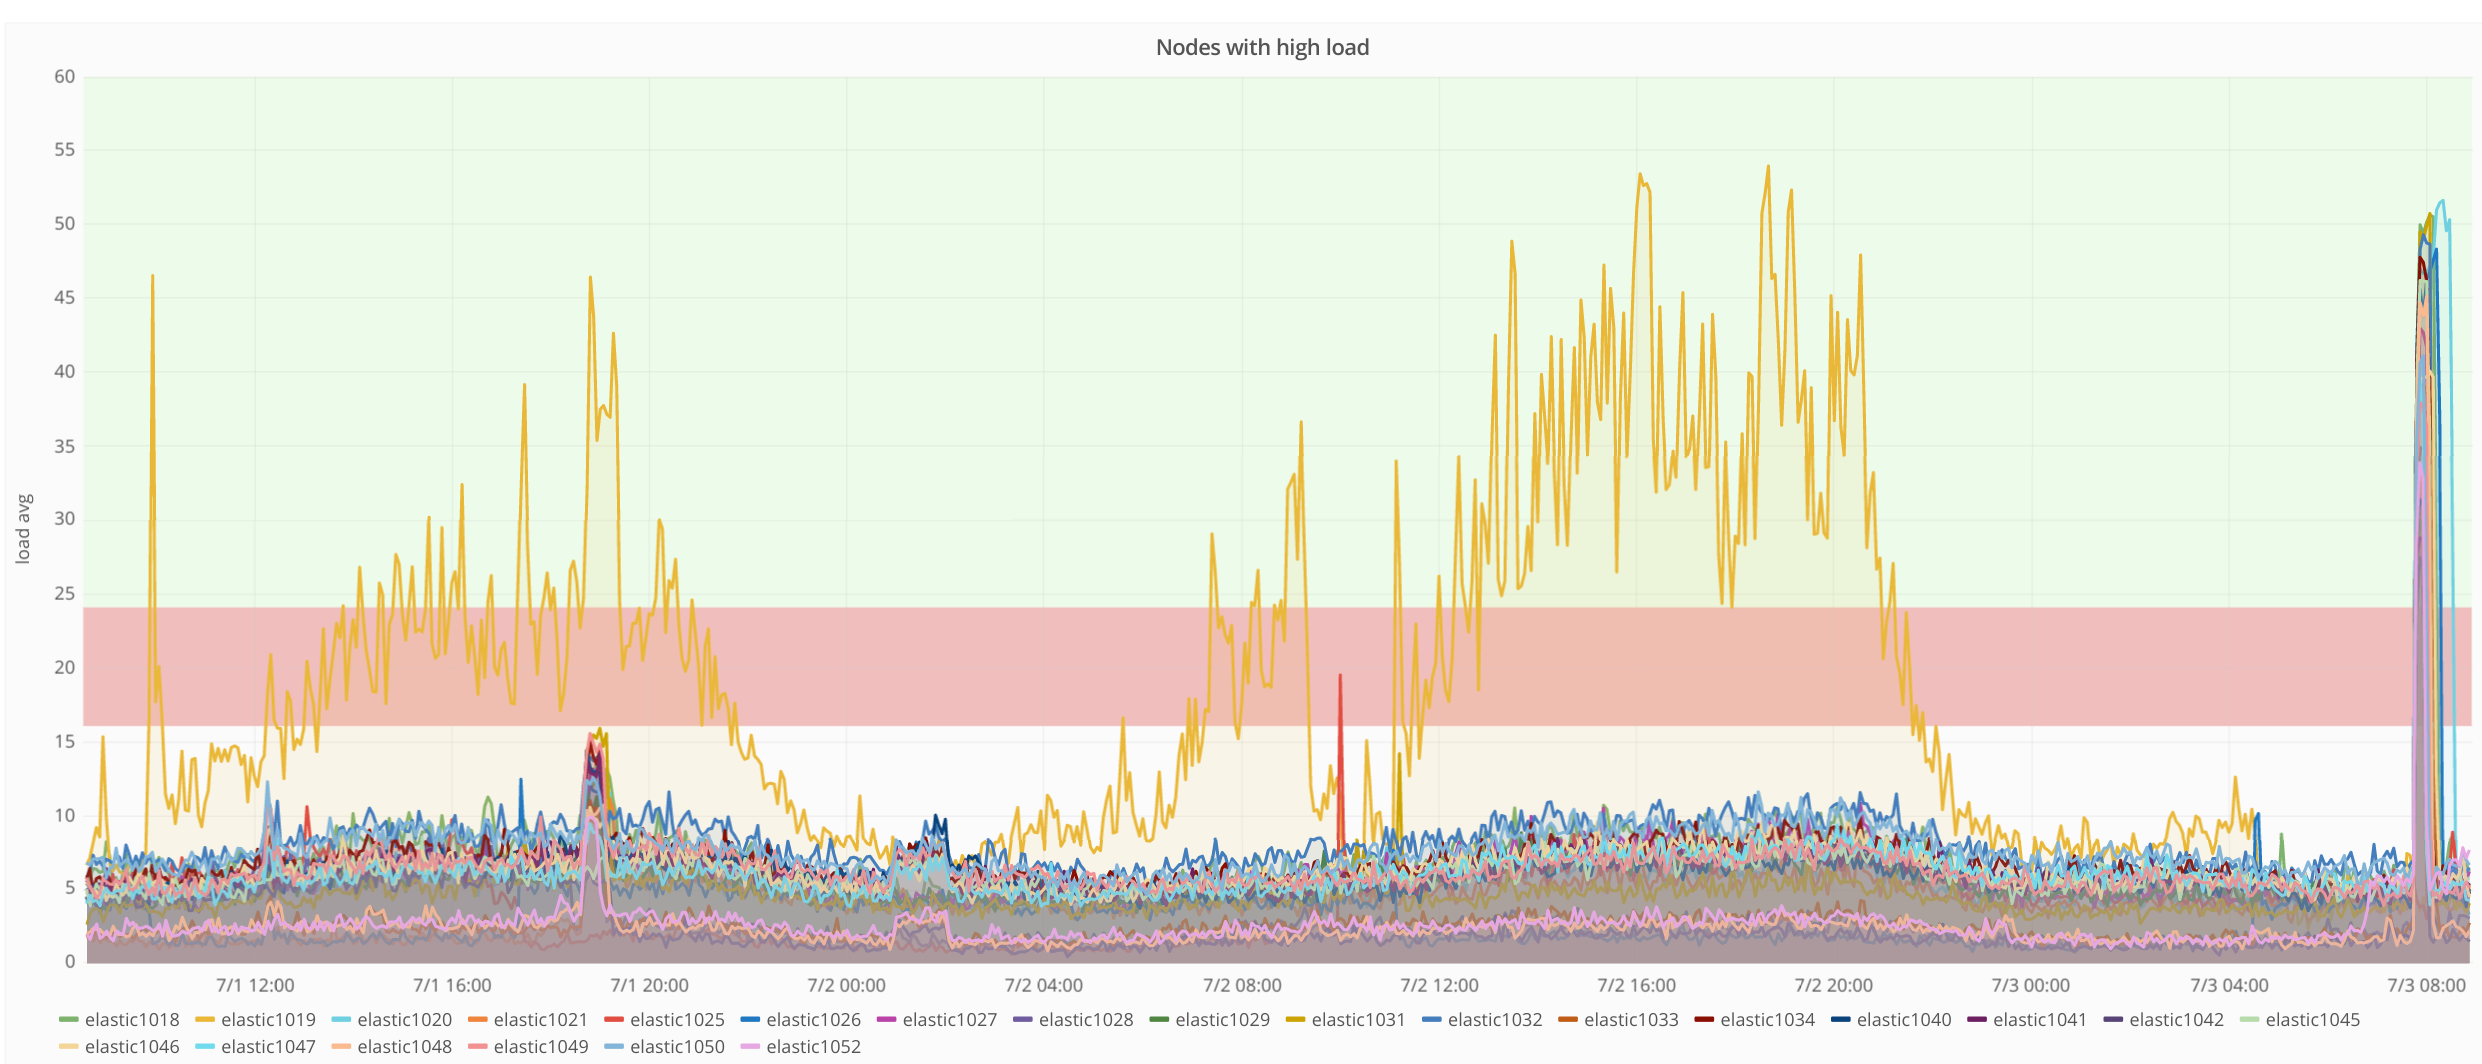
It happened several times with only one node affected (e.g. with elastic1019 in yellow):

Sélection_012.png (1×2 px, 580 KB)

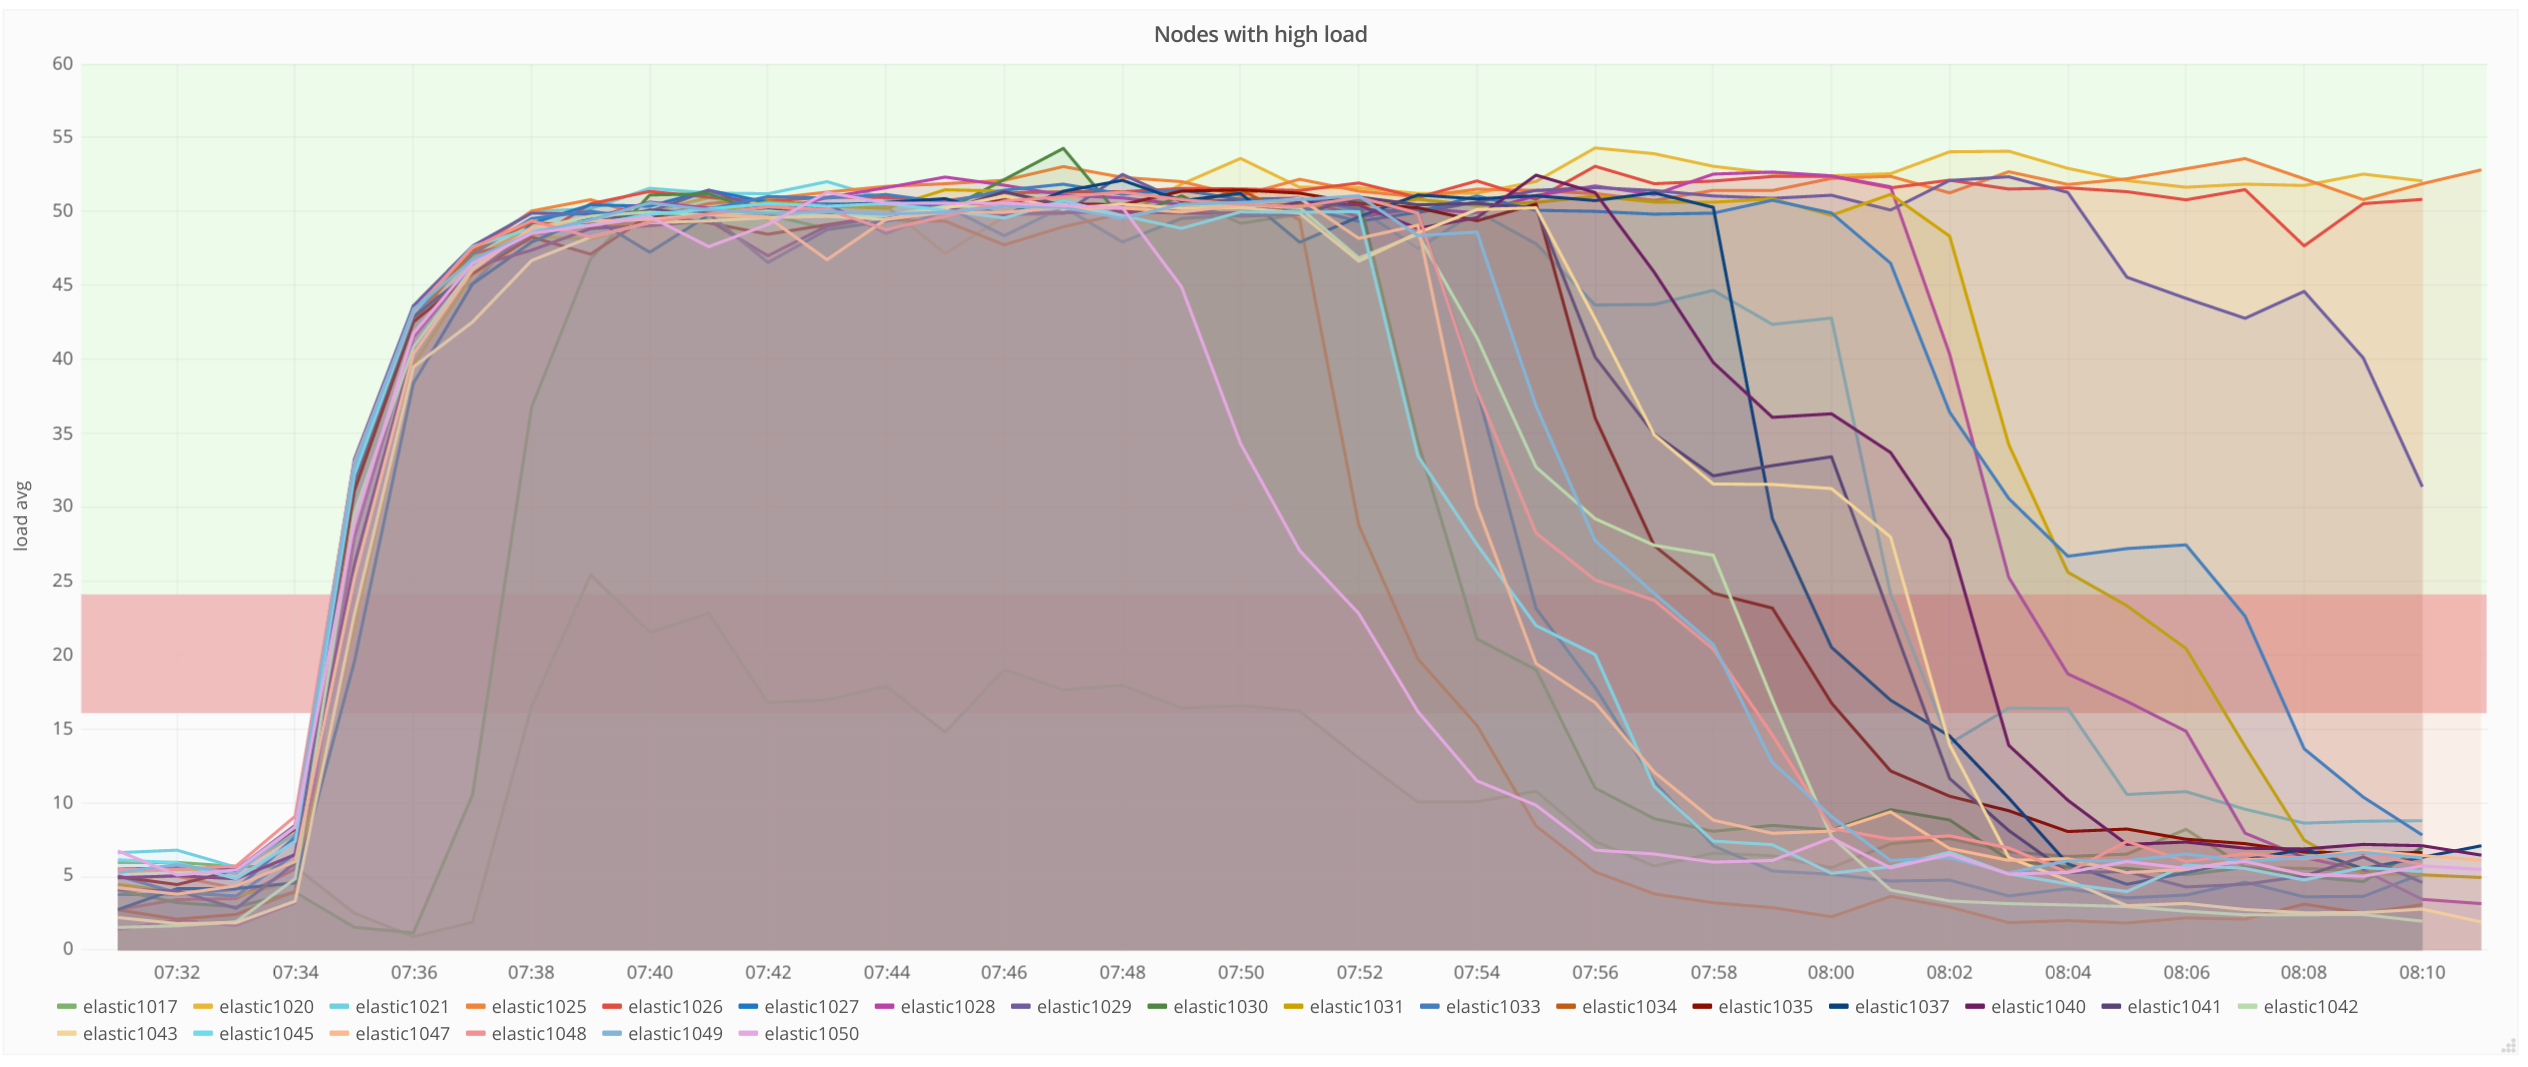
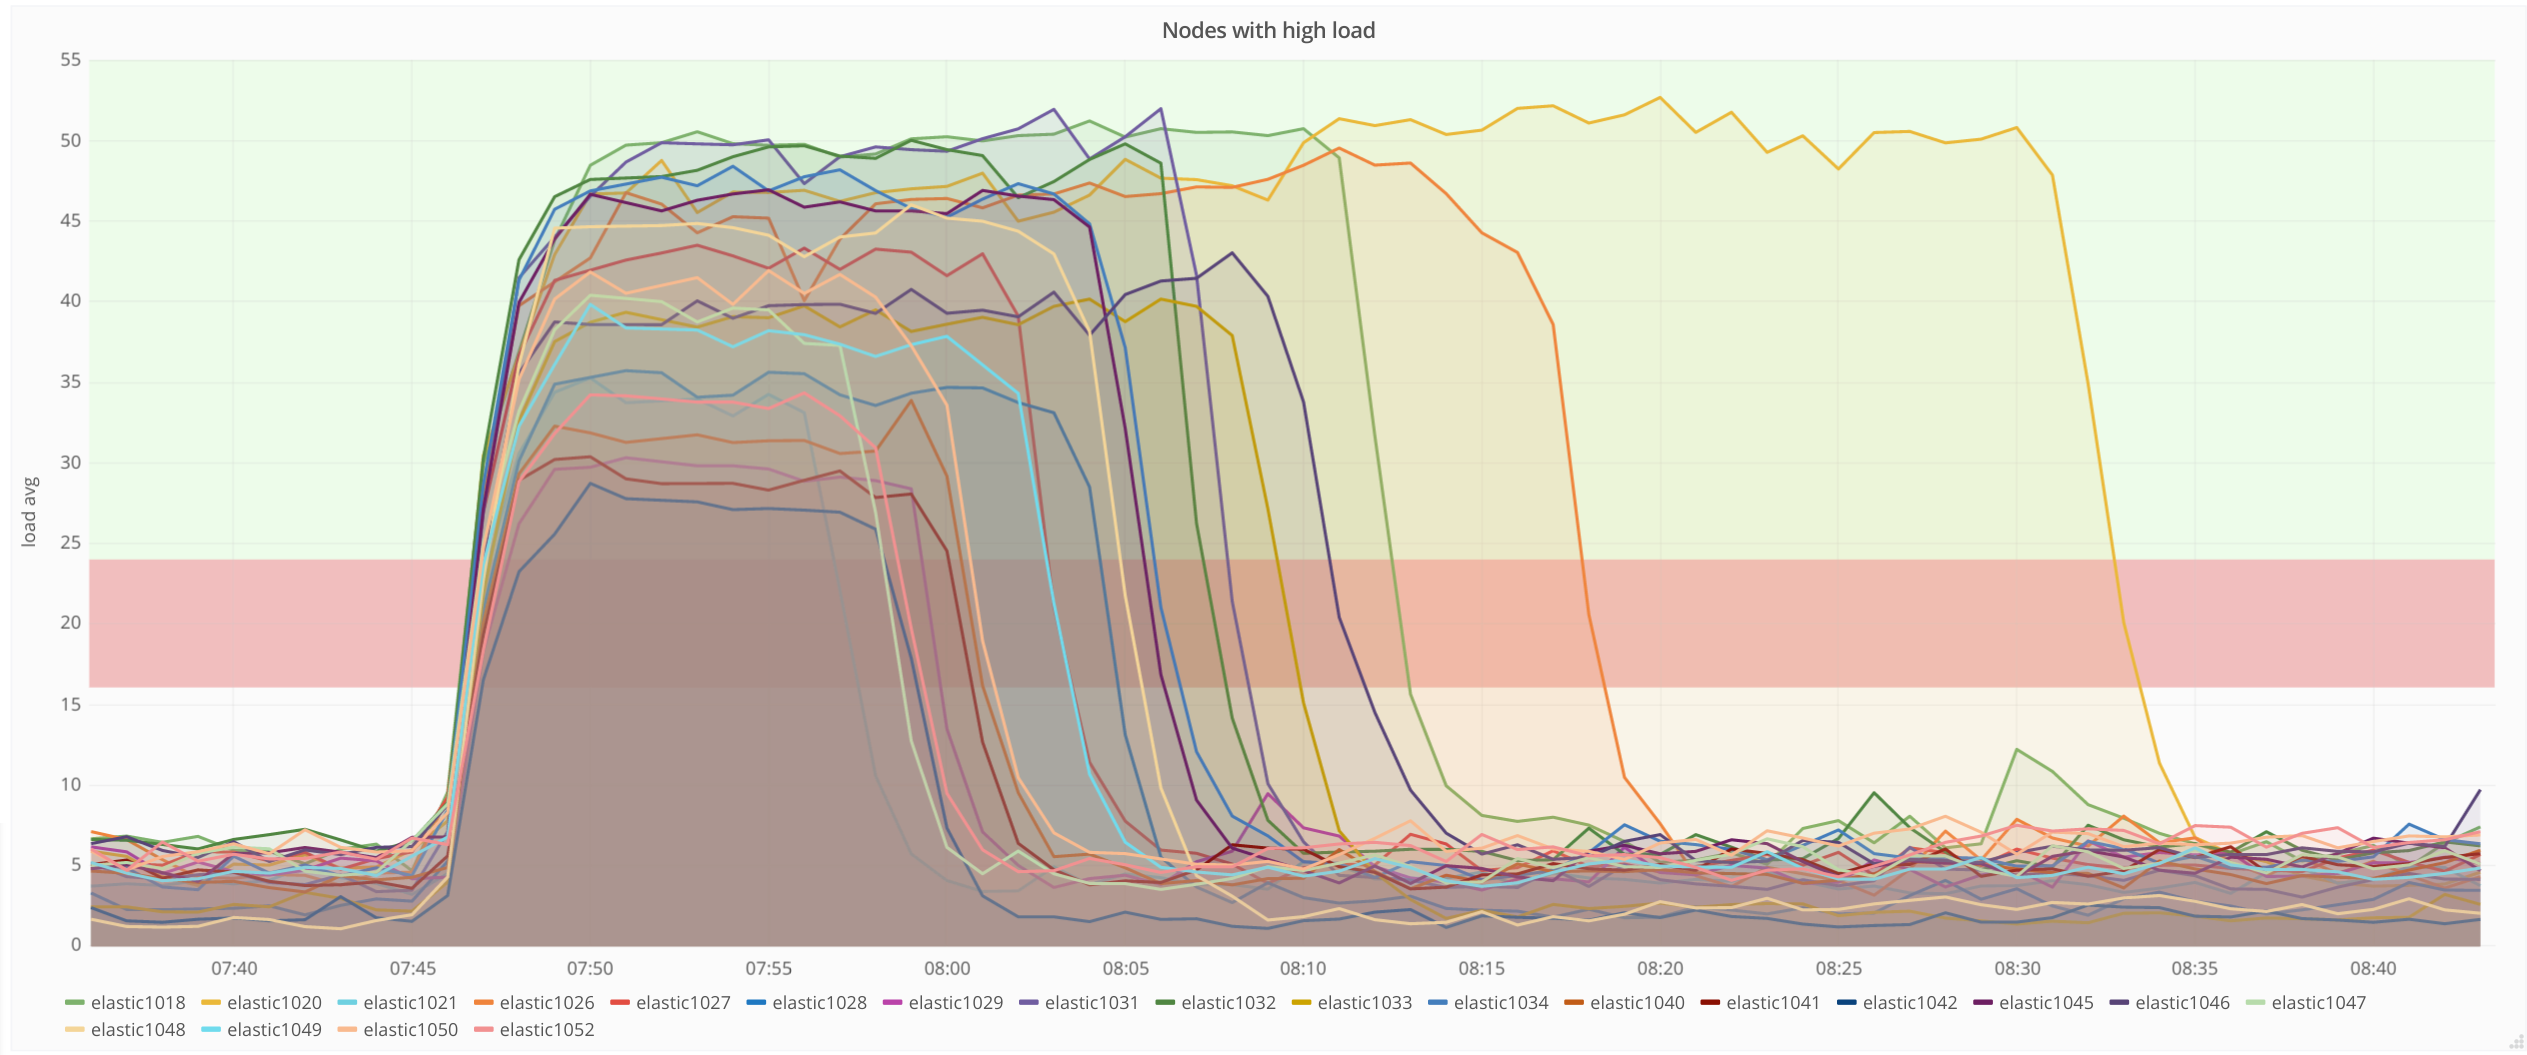
But this morning (jul 4 between 7:45 and 8:00 UTC) many nodes were affected:

Sélection_013.png (1×2 px, 539 KB)

Possible causes to investigate:

  • cluster not well balanced: when elastic1019 was misbehaving we noted that it served the most active shards (banning it seemed to have temporarily fixed the perf issues that tends to confirm the balance issues)
  • bot: when multiple nodes are affected we can suspect a bot hammering the search apis with complex queries
  • T152094: certainly caused much more queries to run the phrase rescore (costly)
  • A slight increase in load avg (+~4%) after june 7 for unknown reasons

Event Timeline

There are a very large number of changes, so older changes are hidden. Show Older Changes

Note that during the second slowdown (jul 4 between 7:45 and 8:00 UTC) the cluster recovered on its own, except for elastic1020. Banning elastic1020 from the cluster for a short while allowed it to recover.

debt triaged this task as Medium priority.Jul 6 2017, 5:10 PM
debt subscribed.

We'll look for someone to help with the thermal pasting on July 10 (or somewhere around that date).

Happened today again (jul 7 between 7:30AM and 8am)

Sélection_014.png (1×2 px, 519 KB)

Looking at the most recent crash on elastic1020:

  • CPU was high, but disk IO was low
  • Young GC was mostly idle
  • This indicates a CPU intensive operation that does no memory allocation and no IO, the symptoms are similar to an infinite loop
  • Most CPU consuming threads where in the SloppyPhraseScorer
  • According to @dcausse SloppyPhraseScorer can be expensive, especially for large documents:

a query like how.at.of.a.a.a will have to sort millions of position esp when it reaches very large articles

Change 364183 had a related patch set uploaded (by DCausse; owner: DCausse):
[operations/mediawiki-config@master] [cirrus] Enable the token_count_router only for chinese

https://gerrit.wikimedia.org/r/364183

Change 364183 merged by jenkins-bot:
[operations/mediawiki-config@master] [cirrus] Enable the token_count_router only for chinese

https://gerrit.wikimedia.org/r/364183

Mentioned in SAL (#wikimedia-operations) [2017-07-10T13:20:05Z] <zfilipin@tin> Synchronized wmf-config/CirrusSearch-common.php: SWAT: [[gerrit:364183|[cirrus] Enable the token_count_router only for chinese (T169498)]] (duration: 00m 43s)

Waiting for this issue to happen again.

Mentioned in SAL (#wikimedia-operations) [2017-07-11T18:28:10Z] <dcausse> T169498: elastic@eqiad huge but short load spike on 24+ nodes (despite the workaround on token_count_router deployed)

Happened again today. An interesting thing i noticed in the graphs is that, at least this time, the more like query cache miss rate went from 80 QPS, which is pretty normal, to a peak of 922 QPS which we pretty much know the cluster can't serve. The other metric we have for more like QPS is recorded as part of the standard search cycle. There QPS is also about 85 pre-problem, spiking to 350 and then keeping a steady 280 QPS for 25 minutes.

Two things:

  • This could be an effect of retrys by the recommendation api? Not sure
  • We should put an explicit pool counter around only more like queries to prevent floods from reaching the cluster, as that will cause problems. I believe today more like uses the standard search pool counter rather than something of its own. If we add a more like pool counter whatever we add to it should be subtracted from the full text search poolcounter.

@EBernhardson do you think we suddenly got a massive influx of searches for the same general topic at the time of the peak QPS? Is there a way to tell?

I'm trying to figure it out from the recorded logs, but they don't quite line up. Poking through the webrequest logs which come from the varnish edge caches, the request rate for requests including the string 'search=morelike:' which should cover api and standard search requests, did not show any increase in traffic. It has a steady decline from 4k req's per minute to 2.7k req's per minute. These numbers are very similar to the previous day, where no problem occured.

On the other cirrus logging recorded an increase from 6k requests per minute to 19k requests per minute. It's important to note this is only completed requests. If, for example, the request was rejected by elasticsearch because there was no room in the queue it wouldn't be included here. This leads to two basic questions:

  • why is the cirrus rate of morelike queries double that of the external requests?
  • why is the rate of requests logged by cirrus not correlated to the rate of incoming webrequest's during the most recent load spike?
  • Where did all these extra requests come from? Both before and after the issue hits+misses on the morelike cache were around 160-180. During the load spike the combined rate was 450-1000, with a much lower hit rate on the cache than normal (20% vs 50%)

Should we consider shrinking the thread pools used for search to help prevent complete overload of individual servers? Right now we use the elasticsearch defaults, which is ((# of available_processors * 3) / 2) + 1, or 49 shard searches run in parallel. When threads are stalled on IO it makes sense to allow this to increase beyond the number of cores, but in general we are very rarely stalled on IO and the problems we see are due to the unavailability of CPU resources. We could reduce the pool size to 32 which might help individual servers from becoming overloaded. The thread pool queue of 1000 will still fill up, but hopefully individual searches will not get stalled out as much? Additionally once the thread pool queue fills up the node will reject requests which re-issues them against other shards.

Sounds a good idea, 32 is a good value.

Change 367709 had a related patch set uploaded (by EBernhardson; owner: EBernhardson):
[operations/puppet@production] Decrease elasticsearch search threadp pool to 32 for cirrus servers

https://gerrit.wikimedia.org/r/367709

Change 367709 merged by Gehel:
[operations/puppet@production] Decrease elasticsearch search thread pool to 32 for cirrus servers

https://gerrit.wikimedia.org/r/367709

Happening again today. In grafana 1024 and 1027 both maxed out, with 1025 under heavy load but not quite 100%. Occured approximately 18:10 to 18:50 UTC on july 31.

Indices shared by these three servers during incident:

ebernhardson@elastic1040:~/tmp$ curl -s localhost:9200/_cat/shards | egrep 'elastic(1024|1026|1027)' | awk '{print $1}' | sort | uniq -c | grep  '      3'
      3 commonswiki_general_1487953501
      3 enwiki_content_1495640050
      3 fiwiki_general_1499743941
      3 jawiki_general_1499767705
      3 rowiki_content_1499812180

Of these, rowiki_content has 2 shards, jawiki_general has 6, fiwiki_general has 8, enwiki_content has 7, commonswiki_general has 8. Not sure this means much, but a theory i have is that some wiki is seeing increased load (over-zealous bot?) that is heavily loading a small number of servers serving that index. This idea is pushed back on though by me only seeing the older (elastic1017-1032) servers seem to max CPU during the incidents, in the times i have looked the newer servers have all had very consistent load. I don't think i've looked enough times to guarantee that though.

Incident is actually still ongoing. It looks like right as the incident started full text QPS rose from ~500 to ~600 QPS. If all 100 are for a single wiki that could be a source of our problem. I'll try to dig through the hive logs once the hours data is in to see if this increase can be attributed to anything in particular.

I can't prove it's directly related, but from digging through hive logs i can see that enwiki traffic is the source of the 100 QPS increase. Enwiki went from 200 to 300 qps, while the number of distinct ips per minute stayed flat. This does suggest a bot issuing queries. It will take more time to dig in and figure out what kinds of queries this bot it generating. At this point I can't say for sure this is the source of our problems, but it seems plausible.

IP's issuing > 1k requests per minute from july 31 17:00 to 22:59. This looks to line up pretty darn well with todays incident. Overall though this is an increase of less than 100 requests per second. While it is large, it shouldn't be enough to cause serious problems on our side. I took a look at a random sampling of requests and in general while they are very long, they don't seem to do anything particularly crazy.

heavy users of search, july 31 18:00-21:59 (265×393 px, 15 KB)

A few search examples that dont contain any PII:

increased their reserves (by expanding their money supplies) in amounts far greater than before Why was there a depreciation of the industrialized nations dollars ?
Where was the first solar thermal power plant built ?
the Institute for Policy Studies What Institute published findings in September 2012 regarding the Forbes richest 400 Americans ?

Here is all ips requesting more than 1k searches per minute (filtering all data below that, so these ips might also be requesting 500 docs/minute all month or some such). I havn't been able to figure out yet if these spikes all line up with incidents or not. x-axis labels are days of july (mostly).

ips requesting more than 1k searches per minute for july 2017 (578×1 px, 31 KB)

Checking for obvious spikes in latency shown in graphana of p95 we have:

july 25, 19:00-22:00 : Matches exactly a single ip issuing 4k to 5k reqs/minute
july 13 22:45-july 14 1:15 : No match
jult 11 18:15-19:45 : No match (moderate volume bot @ 1k/min 13:00-15:00 and 19:00-23:00)
july 10 9:30-11:15 and 13:30 -15:30: No match
july 3 23:00 - july 4 00:45
july 3 7:45 - 10:00

So, that last 2 line up with bot spikes, but prior incidents don't seem to. I'm having a hard time convincing icinga to give me alerting history, it seems to want to only handle one day at a time instead of giving me a full month...

Here is a zoomed in graph of the above for each incident i have reported by icinga to my gmail (from first CRITICAL to next OK, filtering incidents less than 10 minutes). You might need to open the image in a new tab to see in proper size:

cirrus alerts in july vs high volume ip's (5×1 px, 487 KB)

Mentioned in SAL (#wikimedia-operations) [2017-08-01T12:06:25Z] <dcausse> 100% cpu spike on elastic1023 caused percentiles to jump for a short period of time (T169498)

while pondering what is different between old and new servers, as it seems the overload tends to be on older servers, dcausse turned up wio which seems to only have increased on the older servers: https://ganglia.wikimedia.org/latest/?r=year&cs=&ce=&c=Elasticsearch+cluster+eqiad&h=&tab=m&vn=&hide-hf=false&m=cpu_wio&sh=1&z=small&hc=4&host_regex=&max_graphs=0&s=by+name

This may or may not be related though, as our problem seems to be 100% cpu usage, but high wait io might influence that?

I'm trying to figure it out from the recorded logs, but they don't quite line up. Poking through the webrequest logs which come from the varnish edge caches, the request rate for requests including the string 'search=morelike:' which should cover api and standard search requests, did not show any increase in traffic. It has a steady decline from 4k req's per minute to 2.7k req's per minute. These numbers are very similar to the previous day, where no problem occured.

On the other cirrus logging recorded an increase from 6k requests per minute to 19k requests per minute. It's important to note this is only completed requests. If, for example, the request was rejected by elasticsearch because there was no room in the queue it wouldn't be included here. This leads to two basic questions:

  • why is the cirrus rate of morelike queries double that of the external requests?
  • why is the rate of requests logged by cirrus not correlated to the rate of incoming webrequest's during the most recent load spike?
  • Where did all these extra requests come from? Both before and after the issue hits+misses on the morelike cache were around 160-180. During the load spike the combined rate was 450-1000, with a much lower hit rate on the cache than normal (20% vs 50%)

I see i forgot to follow up on this. This turned out to be a deployment issue, where a new version of the RelatedArticles extension didn't hit the existing varnish cache entries, and tried to recalculate everything. Fixing this was two fold: RelatedArticles was updated to use the same urls as before, and CirrusSearch added a new pool counter for MoreLike requests.

Another brief occurance today, Aug 4 21:25 - 21:35 UTC. CPU spiked to 100% on 12 servers, including some of the newer servers. They all recovered pretty quickly except 1032 and 1033. 1032 is still at 100% and has a full search thread pool (1k items) 20 minutes after the incident started. 1033 initially spiked to 100%, then dropped to ~60% when the other servers all recovered back to a more typical 30%.

Currently, while still at 100% cpu, jstack shows 32 threads (all threads available to the search thread pool) inside the SloppyPhraseRescorer with traces that look roughly like:

"elasticsearch[elastic1032][search][T#1]" #244 daemon prio=5 os_prio=0 tid=0x00007fafa4028000 nid=0x1237 runnable [0x00007facdf5f6000]
   java.lang.Thread.State: RUNNABLE
        at org.apache.lucene.util.PriorityQueue.upHeap(PriorityQueue.java:266)
        at org.apache.lucene.util.PriorityQueue.add(PriorityQueue.java:140)
        at org.apache.lucene.search.SloppyPhraseScorer.phraseFreq(SloppyPhraseScorer.java:116)
        at org.apache.lucene.search.SloppyPhraseScorer.access$100(SloppyPhraseScorer.java:32)
        at org.apache.lucene.search.SloppyPhraseScorer$2.matches(SloppyPhraseScorer.java:568)
        at org.apache.lucene.search.TwoPhaseIterator$TwoPhaseIteratorAsDocIdSetIterator.doNext(TwoPhaseIterator.java:89)
        at org.apache.lucene.search.TwoPhaseIterator$TwoPhaseIteratorAsDocIdSetIterator.advance(TwoPhaseIterator.java:82)
        at org.apache.lucene.search.QueryRescorer.rescore(QueryRescorer.java:92)
        at org.elasticsearch.search.rescore.QueryRescorer.rescore(QueryRescorer.java:72)
        at org.elasticsearch.search.rescore.RescorePhase.execute(RescorePhase.java:49)
        at org.elasticsearch.search.query.QueryPhase.execute(QueryPhase.java:111)
        at org.elasticsearch.search.SearchService.loadOrExecuteQueryPhase(SearchService.java:247)
        at org.elasticsearch.search.SearchService.executeQueryPhase(SearchService.java:261)
        at org.elasticsearch.action.search.SearchTransportService$6.messageReceived(SearchTransportService.java:331)
        at org.elasticsearch.action.search.SearchTransportService$6.messageReceived(SearchTransportService.java:328)
        at org.elasticsearch.transport.RequestHandlerRegistry.processMessageReceived(RequestHandlerRegistry.java:69)
        at org.elasticsearch.transport.TcpTransport$RequestHandler.doRun(TcpTransport.java:1488)
        at org.elasticsearch.common.util.concurrent.ThreadContext$ContextPreservingAbstractRunnable.doRun(ThreadContext.java:638)
        at org.elasticsearch.common.util.concurrent.AbstractRunnable.run(AbstractRunnable.java:37)
        at java.util.concurrent.ThreadPoolExecutor.runWorker(ThreadPoolExecutor.java:1149)
        at java.util.concurrent.ThreadPoolExecutor$Worker.run(ThreadPoolExecutor.java:624)
        at java.lang.Thread.run(Thread.java:748)

The top couple spots vary a little, but it looks like pretty much everything is inside SloppyPhraseScorer and calling either the PriorityQueue, or PhrasePositions.

This seemed more severe than other occurances, in that cluster QPS dropped from 1.8k/min to 0.8k/min. It looks like the pool counter kicked in to reject all those extra queries as the cluster struggled to return responses.

I'm not super familiar with the sloppy phrase score, but a quick investigation shows it allows a query like:

"President politician States and American 35th of the United"~15

To match the phrase:

American politician and 35th President of the United States

I'm not sure how common these are, or if this is that particular issue, but i can easily see how a query like this could be expensive if it matches quite a few documents.

Something else also seems odd. elastic1032 just recovered, its cpu dropping from 100% to something sane. Moments later we got an alert that p99 had jumped to 30s. It seems plausible as 1032 recovered it cleared out the 1k items in its search thread pool queue relatively quickly, and the average time they had been waiting was enough to kick up the cluster latency metrics.

I do see some huge variation in the number of phrase slop queries, ranging from 1 per hour to 15k per hour. I'm not sure that count is really the right number to look at here, as it seems suspiciously like a few expensive queries might be trumping total volume. Even so i compared hourly counts of full text queries containing "~ to times we've had alerts to see if anything funny was going on. At least in terms of volume of phrase slop queries there doesn't appear to be a correlation.

july 2 16:10 to 16:27 - no match
july 2 19:11 to 19:22 - no match
july 3 7:54 to 8:40 - no match
july 3 19:30 to 20:41 - no match
july 7 7:41 to 8:14 - no match
july 10 13:32 to 14:00 - no match
july 11 18:25 to 18:35 - no match
july 13 23:02 to july 14 00:01 - indecisive, increase from 1 per hour to 10000-15000 per hour from july 13 22:00 to july 16 5:00
july 24 19:14 to 21:59 - no match
july 31 12:52 to 13:23 - no match
july 31 18:21 to 21:37 - no match

Mentioned in SAL (#wikimedia-operations) [2017-08-06T06:18:34Z] <ebernhardson@tin> Synchronized wmf-config/PoolCounterSettings.php: T169498: Reduce cirrus search pool counter to 200 parallel requests cluster wide (duration: 02m 54s)

Another instance today, roughly 21 servers managed to max out cpu for 30 to 40 minutes.

I remembered this time the elasticsearch tasks api could have some information, so i collected running tasks on all the maxed out machines:

curl https://search.svc.eqiad.wmnet:9243/_tasks/?detaild=1&nodes=elastic1018,elastic1019,....' > tasks

Then parsed it with a quick python script to find the longest running tasks:

import json
from collections import defaultdict
with open('tasks') as f:
  data = json.loads(f.read())

queries = defaultdict(list)
for node, state in data['nodes'].items():
        for task in state['tasks'].values():
                if task['description'] == "":
                        continue
                queries[task['description']].append(task)

def max_runtime(tasks):
        return max([task['running_time_in_nanos'] for task in tasks])

queries = sorted(queries.values(), key=max_runtime, reverse=True)
for tasks in queries[:10]:
        for task in tasks:
                ms = task['running_time_in_nanos'] * 1e-6
                print 'Running time: %dms' % (int(ms))
        print tasks[0]['description']
        print '*' * 80
        print ''

This turned up one query in particular that had been running for 33 minutes. Note that each 'running time' there is a different execution of the same query, so that query was running ~24 times, on 6 servers for 166 different tasks currently executing. Note also this is 30 minutes into the incident, it could have run many more times. Will check other logs to correlate. Unfortunately i don't yet know *why* this particular query is so expensive.

Running time: 2052434ms
Running time: 2011042ms
Running time: 2134031ms
Running time: 2093137ms
Running time: 2052345ms
Running time: 2052077ms
Running time: 2010049ms
Running time: 2052155ms
Running time: 2009904ms
Running time: 2052253ms
Running time: 2011328ms
Running time: 2052170ms
Running time: 2093010ms
Running time: 2011348ms
Running time: 2093128ms
Running time: 2093113ms
Running time: 2093167ms
Running time: 2093084ms
Running time: 2093105ms
Running time: 2011251ms
Running time: 2052326ms
Running time: 2011312ms
Running time: 2093103ms
Running time: 2052123ms
indices[zhwiki_content], types[page], search_type[QUERY_THEN_FETCH], source[{"size":20,"query":{"bool":{"filter":[{"terms":{"namespace":[0],"boost":1.0}}],"should":[{"bool":{"filter":[{"bool":{"should":[{"match":{"all":{"query":"\\-\\-\\-\\-\\-\\-\\-\\-\\-\\-\\-\\-\\-\\-\\-\\-\\-\\-\\-\\-\\-\\-\\-\\-\\-\\-\\-\\-\\-\\-\\-\\-\\-\\-\\-\\-\\-\\-\\-\\-\\-\\-\\-\\-\\-\\-\\-\\-\\-\\-\\-\\-\\-\\-\\-\\-\\-\\-\\-\\-\\-\\-\\-\\-\\-\\-\\-\\-\\-\\-\\-\\-\\-\\-\\-\\-\\-\\-\\-\\-\\-\\-\\-\\-\\-\\-\\-\\-\\-\\-\\-\\-\\-\\-\\-\\-\\-\\-\\-\\-\\-\\-\\-\\-\\-","operator":"AND","prefix_length":0,"max_expansions":50,"fuzzy_transpositions":true,"lenient":false,"zero_terms_query":"NONE","boost":1.0}}},{"match":{"all.plain":{"query":"\\-\\-\\-\\-\\-\\-\\-\\-\\-\\-\\-\\-\\-\\-\\-\\-\\-\\-\\-\\-\\-\\-\\-\\-\\-\\-\\-\\-\\-\\-\\-\\-\\-\\-\\-\\-\\-\\-\\-\\-\\-\\-\\-\\-\\-\\-\\-\\-\\-\\-\\-\\-\\-\\-\\-\\-\\-\\-\\-\\-\\-\\-\\-\\-\\-\\-\\-\\-\\-\\-\\-\\-\\-\\-\\-\\-\\-\\-\\-\\-\\-\\-\\-\\-\\-\\-\\-\\-\\-\\-\\-\\-\\-\\-\\-\\-\\-\\-\\-\\-\\-\\-\\-\\-\\-","operator":"AND","prefix_length":0,"max_expansions":50,"fuzzy_transpositions":true,"lenient":false,"zero_terms_query":"NONE","boost":1.0}}}],"disable_coord":false,"adjust_pure_negative":true,"boost":1.0}}],"should":[{"multi_match":{"query":"\\-\\-\\-\\-\\-\\-\\-\\-\\-\\-\\-\\-\\-\\-\\-\\-\\-\\-\\-\\-\\-\\-\\-\\-\\-\\-\\-\\-\\-\\-\\-\\-\\-\\-\\-\\-\\-\\-\\-\\-\\-\\-\\-\\-\\-\\-\\-\\-\\-\\-\\-\\-\\-\\-\\-\\-\\-\\-\\-\\-\\-\\-\\-\\-\\-\\-\\-\\-\\-\\-\\-\\-\\-\\-\\-\\-\\-\\-\\-\\-\\-\\-\\-\\-\\-\\-\\-\\-\\-\\-\\-\\-\\-\\-\\-\\-\\-\\-\\-\\-\\-\\-\\-\\-\\-","fields":["title^3.0","title.plain^1.0"],"type":"most_fields","operator":"OR","slop":0,"prefix_length":0,"max_expansions":50,"minimum_should_match":"1","lenient":false,"zero_terms_query":"NONE","boost":0.3}},{"multi_match":{"query":"\\-\\-\\-\\-\\-\\-\\-\\-\\-\\-\\-\\-\\-\\-\\-\\-\\-\\-\\-\\-\\-\\-\\-\\-\\-\\-\\-\\-\\-\\-\\-\\-\\-\\-\\-\\-\\-\\-\\-\\-\\-\\-\\-\\-\\-\\-\\-\\-\\-\\-\\-\\-\\-\\-\\-\\-\\-\\-\\-\\-\\-\\-\\-\\-\\-\\-\\-\\-\\-\\-\\-\\-\\-\\-\\-\\-\\-\\-\\-\\-\\-\\-\\-\\-\\-\\-\\-\\-\\-\\-\\-\\-\\-\\-\\-\\-\\-\\-\\-\\-\\-\\-\\-\\-\\-","fields":["category^3.0","category.plain^1.0"],"type":"most_fields","operator":"OR","slop":0,"prefix_length":0,"max_expansions":50,"minimum_should_match":"1","lenient":false,"zero_terms_query":"NONE","boost":0.05}},{"multi_match":{"query":"\\-\\-\\-\\-\\-\\-\\-\\-\\-\\-\\-\\-\\-\\-\\-\\-\\-\\-\\-\\-\\-\\-\\-\\-\\-\\-\\-\\-\\-\\-\\-\\-\\-\\-\\-\\-\\-\\-\\-\\-\\-\\-\\-\\-\\-\\-\\-\\-\\-\\-\\-\\-\\-\\-\\-\\-\\-\\-\\-\\-\\-\\-\\-\\-\\-\\-\\-\\-\\-\\-\\-\\-\\-\\-\\-\\-\\-\\-\\-\\-\\-\\-\\-\\-\\-\\-\\-\\-\\-\\-\\-\\-\\-\\-\\-\\-\\-\\-\\-\\-\\-\\-\\-\\-\\-","fields":["heading^3.0","heading.plain^1.0"],"type":"most_fields","operator":"OR","slop":0,"prefix_length":0,"max_expansions":50,"minimum_should_match":"1","lenient":false,"zero_terms_query":"NONE","boost":0.05}},{"multi_match":{"query":"\\-\\-\\-\\-\\-\\-\\-\\-\\-\\-\\-\\-\\-\\-\\-\\-\\-\\-\\-\\-\\-\\-\\-\\-\\-\\-\\-\\-\\-\\-\\-\\-\\-\\-\\-\\-\\-\\-\\-\\-\\-\\-\\-\\-\\-\\-\\-\\-\\-\\-\\-\\-\\-\\-\\-\\-\\-\\-\\-\\-\\-\\-\\-\\-\\-\\-\\-\\-\\-\\-\\-\\-\\-\\-\\-\\-\\-\\-\\-\\-\\-\\-\\-\\-\\-\\-\\-\\-\\-\\-\\-\\-\\-\\-\\-\\-\\-\\-\\-\\-\\-\\-\\-\\-\\-","fields":["auxiliary_text^3.0","auxiliary_text.plain^1.0"],"type":"most_fields","operator":"OR","slop":0,"prefix_length":0,"max_expansions":50,"minimum_should_match":"1","lenient":false,"zero_terms_query":"NONE","boost":0.05}},{"multi_match":{"query":"\\-\\-\\-\\-\\-\\-\\-\\-\\-\\-\\-\\-\\-\\-\\-\\-\\-\\-\\-\\-\\-\\-\\-\\-\\-\\-\\-\\-\\-\\-\\-\\-\\-\\-\\-\\-\\-\\-\\-\\-\\-\\-\\-\\-\\-\\-\\-\\-\\-\\-\\-\\-\\-\\-\\-\\-\\-\\-\\-\\-\\-\\-\\-\\-\\-\\-\\-\\-\\-\\-\\-\\-\\-\\-\\-\\-\\-\\-\\-\\-\\-\\-\\-\\-\\-\\-\\-\\-\\-\\-\\-\\-\\-\\-\\-\\-\\-\\-\\-\\-\\-\\-\\-\\-\\-","fields":["file_text^3.0","file_text.plain^1.0"],"type":"most_fields","operator":"OR","slop":0,"prefix_length":0,"max_expansions":50,"minimum_should_match":"1","lenient":false,"zero_terms_query":"NONE","boost":0.5}},{"dis_max":{"tie_breaker":0.0,"queries":[{"multi_match":{"query":"\\-\\-\\-\\-\\-\\-\\-\\-\\-\\-\\-\\-\\-\\-\\-\\-\\-\\-\\-\\-\\-\\-\\-\\-\\-\\-\\-\\-\\-\\-\\-\\-\\-\\-\\-\\-\\-\\-\\-\\-\\-\\-\\-\\-\\-\\-\\-\\-\\-\\-\\-\\-\\-\\-\\-\\-\\-\\-\\-\\-\\-\\-\\-\\-\\-\\-\\-\\-\\-\\-\\-\\-\\-\\-\\-\\-\\-\\-\\-\\-\\-\\-\\-\\-\\-\\-\\-\\-\\-\\-\\-\\-\\-\\-\\-\\-\\-\\-\\-\\-\\-\\-\\-\\-\\-","fields":["redirect.title^3.0","redirect.title.plain^1.0"],"type":"most_fields","operator":"OR","slop":0,"prefix_length":0,"max_expansions":50,"minimum_should_match":"1","lenient":false,"zero_terms_query":"NONE","boost":0.27}},{"multi_match":{"query":"\\-\\-\\-\\-\\-\\-\\-\\-\\-\\-\\-\\-\\-\\-\\-\\-\\-\\-\\-\\-\\-\\-\\-\\-\\-\\-\\-\\-\\-\\-\\-\\-\\-\\-\\-\\-\\-\\-\\-\\-\\-\\-\\-\\-\\-\\-\\-\\-\\-\\-\\-\\-\\-\\-\\-\\-\\-\\-\\-\\-\\-\\-\\-\\-\\-\\-\\-\\-\\-\\-\\-\\-\\-\\-\\-\\-\\-\\-\\-\\-\\-\\-\\-\\-\\-\\-\\-\\-\\-\\-\\-\\-\\-\\-\\-\\-\\-\\-\\-\\-\\-\\-\\-\\-\\-","fields":["suggest^1.0"],"type":"most_fields","operator":"OR","slop":0,"prefix_length":0,"max_expansions":50,"minimum_should_match":"1","lenient":false,"zero_terms_query":"NONE","boost":0.2}}],"boost":1.0}},{"dis_max":{"tie_breaker":0.0,"queries":[{"multi_match":{"query":"\\-\\-\\-\\-\\-\\-\\-\\-\\-\\-\\-\\-\\-\\-\\-\\-\\-\\-\\-\\-\\-\\-\\-\\-\\-\\-\\-\\-\\-\\-\\-\\-\\-\\-\\-\\-\\-\\-\\-\\-\\-\\-\\-\\-\\-\\-\\-\\-\\-\\-\\-\\-\\-\\-\\-\\-\\-\\-\\-\\-\\-\\-\\-\\-\\-\\-\\-\\-\\-\\-\\-\\-\\-\\-\\-\\-\\-\\-\\-\\-\\-\\-\\-\\-\\-\\-\\-\\-\\-\\-\\-\\-\\-\\-\\-\\-\\-\\-\\-\\-\\-\\-\\-\\-\\-","fields":["text^3.0","text.plain^1.0"],"type":"most_fields","operator":"OR","slop":0,"prefix_length":0,"max_expansions":50,"minimum_should_match":"1","lenient":false,"zero_terms_query":"NONE","boost":0.6}},{"multi_match":{"query":"\\-\\-\\-\\-\\-\\-\\-\\-\\-\\-\\-\\-\\-\\-\\-\\-\\-\\-\\-\\-\\-\\-\\-\\-\\-\\-\\-\\-\\-\\-\\-\\-\\-\\-\\-\\-\\-\\-\\-\\-\\-\\-\\-\\-\\-\\-\\-\\-\\-\\-\\-\\-\\-\\-\\-\\-\\-\\-\\-\\-\\-\\-\\-\\-\\-\\-\\-\\-\\-\\-\\-\\-\\-\\-\\-\\-\\-\\-\\-\\-\\-\\-\\-\\-\\-\\-\\-\\-\\-\\-\\-\\-\\-\\-\\-\\-\\-\\-\\-\\-\\-\\-\\-\\-\\-","fields":["opening_text^3.0","opening_text.plain^1.0"],"type":"most_fields","operator":"OR","slop":0,"prefix_length":0,"max_expansions":50,"minimum_should_match":"1","lenient":false,"zero_terms_query":"NONE","boost":0.5}}],"boost":1.0}}],"disable_coord":true,"adjust_pure_negative":true,"boost":1.0}},{"multi_match":{"query":"---------------------------------------------------------------------------------------------------------","fields":["all_near_match^2.0"],"type":"best_fields","operator":"OR","slop":0,"prefix_length":0,"max_expansions":50,"lenient":false,"zero_terms_query":"NONE","boost":1.0}}],"disable_coord":false,"adjust_pure_negative":true,"minimum_should_match":"1","boost":1.0}},"_source":{"includes":["namespace","title","namespace_text","wiki","redirect.*","timestamp","text_bytes"],"excludes":[]},"stored_fields":"text.word_count","highlight":{"pre_tags":["<span class=\"searchmatch\">"],"post_tags":["</span>"],"highlight_query":{"query_string":{"query":"\\-\\-\\-\\-\\-\\-\\-\\-\\-\\-\\-\\-\\-\\-\\-\\-\\-\\-\\-\\-\\-\\-\\-\\-\\-\\-\\-\\-\\-\\-\\-\\-\\-\\-\\-\\-\\-\\-\\-\\-\\-\\-\\-\\-\\-\\-\\-\\-\\-\\-\\-\\-\\-\\-\\-\\-\\-\\-\\-\\-\\-\\-\\-\\-\\-\\-\\-\\-\\-\\-\\-\\-\\-\\-\\-\\-\\-\\-\\-\\-\\-\\-\\-\\-\\-\\-\\-\\-\\-\\-\\-\\-\\-\\-\\-\\-\\-\\-\\-\\-\\-\\-\\-\\-\\-","fields":["auxiliary_text^0.25","auxiliary_text.plain^0.5","category^4.0","category.plain^8.0","heading^2.5","heading.plain^5.0","opening_text^1.5","opening_text.plain^3.0","redirect.title^7.5","redirect.title.plain^15.0","text^0.5","text.plain^1.0","title^10.0","title.plain^20.0"],"use_dis_max":true,"tie_breaker":0.0,"default_operator":"or","auto_generate_phrase_queries":true,"max_determinized_states":500,"allow_leading_wildcard":false,"enable_position_increments":true,"fuzziness":"AUTO","fuzzy_prefix_length":2,"fuzzy_max_expansions":50,"phrase_slop":1,"rewrite":"top_terms_blended_freqs_1024","escape":false,"split_on_whitespace":true,"boost":1.0}},"fields":{"title":{"number_of_fragments":1,"type":"experimental","fragmenter":"none","matched_fields":["title","title.plain"]},"redirect.title":{"number_of_fragments":1,"type":"experimental","fragmenter":"none","order":"score","options":{"skip_if_last_matched":true},"matched_fields":["redirect.title","redirect.title.plain"]},"category":{"number_of_fragments":1,"type":"experimental","fragmenter":"none","order":"score","options":{"skip_if_last_matched":true},"matched_fields":["category","category.plain"]},"heading":{"number_of_fragments":1,"type":"experimental","fragmenter":"none","order":"score","options":{"skip_if_last_matched":true},"matched_fields":["heading","heading.plain"]},"text":{"fragment_size":150,"number_of_fragments":1,"type":"experimental","fragmenter":"scan","options":{"top_scoring":true,"boost_before":{"200":1.5,"1000":1.2,"50":1.8,"20":2},"max_fragments_scored":5000},"no_match_size":150,"matched_fields":["text","text.plain"]},"auxiliary_text":{"fragment_size":150,"number_of_fragments":1,"type":"experimental","fragmenter":"scan","options":{"top_scoring":true,"boost_before":{"200":1.5,"1000":1.2,"50":1.8,"20":2},"max_fragments_scored":5000,"skip_if_last_matched":true},"matched_fields":["auxiliary_text","auxiliary_text.plain"]}}},"suggest":{"text":"---------------------------------------------------------------------------------------------------------","suggest":{"phrase":{"field":"suggest","size":1,"real_word_error_likelihood":0.95,"confidence":2.0,"separator":" ","max_errors":2.0,"force_unigrams":true,"token_limit":10,"direct_generator":[{"field":"suggest","max_term_freq":0.5,"min_doc_freq":0.0,"prefix_length":2,"suggest_mode":"always"}],"smoothing":{"stupid_backoff":{"discount":0.4}},"highlight":{"pre_tag":"<em>","post_tag":"</em>"}}}},"rescore":[{"window_size":512,"query":{"rescore_query":{"token_count_router":{"analyzer":"text_search","text":"\\-\\-\\-\\-\\-\\-\\-\\-\\-\\-\\-\\-\\-\\-\\-\\-\\-\\-\\-\\-\\-\\-\\-\\-\\-\\-\\-\\-\\-\\-\\-\\-\\-\\-\\-\\-\\-\\-\\-\\-\\-\\-\\-\\-\\-\\-\\-\\-\\-\\-\\-\\-\\-\\-\\-\\-\\-\\-\\-\\-\\-\\-\\-\\-\\-\\-\\-\\-\\-\\-\\-\\-\\-\\-\\-\\-\\-\\-\\-\\-\\-\\-\\-\\-\\-\\-\\-\\-\\-\\-\\-\\-\\-\\-\\-\\-\\-\\-\\-\\-\\-\\-\\-\\-\\-","fallback":{"match_none":{"boost":1.0}},"conditions":[{"gt":1,"query":{"multi_match":{"query":"\\-\\-\\-\\-\\-\\-\\-\\-\\-\\-\\-\\-\\-\\-\\-\\-\\-\\-\\-\\-\\-\\-\\-\\-\\-\\-\\-\\-\\-\\-\\-\\-\\-\\-\\-\\-\\-\\-\\-\\-\\-\\-\\-\\-\\-\\-\\-\\-\\-\\-\\-\\-\\-\\-\\-\\-\\-\\-\\-\\-\\-\\-\\-\\-\\-\\-\\-\\-\\-\\-\\-\\-\\-\\-\\-\\-\\-\\-\\-\\-\\-\\-\\-\\-\\-\\-\\-\\-\\-\\-\\-\\-\\-\\-\\-\\-\\-\\-\\-\\-\\-\\-\\-\\-\\-","fields":["all^0.06","all.plain^0.1"],"type":"phrase","operator":"OR","slop":1,"prefix_length":0,"max_expansions":50,"lenient":false,"zero_terms_query":"NONE","boost":1.0}}}],"boost":1.0}},"query_weight":1.0,"rescore_query_weight":10.0,"score_mode":"total"}},{"window_size":8192,"query":{"rescore_query":{"function_score":{"query":{"match_all":{"boost":1.0}},"functions":[{"filter":{"match_all":{"boost":1.0}},"weight":13.0,"script_score":{"script":{"inline":"pow(doc['incoming_links'].value , 0.7) / ( pow(doc['incoming_links'].value, 0.7) + pow(30,0.7))","lang":"expression"}}}],"score_mode":"multiply","max_boost":3.4028235E38,"boost":1.0}},"query_weight":1.0,"rescore_query_weight":1.0,"score_mode":"total"}}],"stats":["suggest","full_text","full_text_simple_match"]}]

Looks like to generate this query, search for - 94 times. Manually running it against codfw confirms its a very expensive query. Interestingly running it against relforge errors out in the suggest field. The tasks claim to be cancelable, but canceling via the task api doesn't seem to do anything useful. Tried canceling both the per-shard queries and the parent query, neither did anything. I enabled query profiling on the one i ran, so will take a look over it whenever that finishes and see if it has anything useful to say.

Profiling output is, frankly, quite amazing. Each - turns into > 1 underlying query, per field, that each take a few ms to run. Our worst offender though is the phrase rescore query at the end. it took 858 seconds against codfw in my one test. Removing the phrase rescore brought the total runtime down from 950s to 41s.

Checking in hive against searches in august, queries with at least 10 - in a row are surprisingly common, on the order of 10 to 100 per hour, with one hour (aug 5 10:00 UTC) containing the most with 1537.

I can add in a bit of a hack to the phrase rescore to basically collapse a bunch of sequential -, but i would like to find a solution that fixes it more generally instead of this one single use case (which may not be the only way to trigger the pathological behaviour)

Interesting stuff. There's got to be something weird going on with the dashes. Also, make sure that any deduping doesn't prevent matching on actual mutli-hyphen tokens. 1, 2, 3, and 4 dashes all have title matches on enwiki.

Slowdown again this morning. Looking at the servers with the highest load, I see elastic1022 and elastic1026. Thread dumps attached below. The thread dumps show that most active threads are related to SloppyPhraseScorer. CPU temperature on both nodes is stable, so we can't blame that this time.

Change 370496 had a related patch set uploaded (by EBernhardson; owner: EBernhardson):
[mediawiki/extensions/CirrusSearch@master] Limit the number of tokens in a phrase rescore query

https://gerrit.wikimedia.org/r/370496

Change 370497 had a related patch set uploaded (by EBernhardson; owner: EBernhardson):
[operations/mediawiki-config@master] Enable max token count for phrase rescore on zh lang wikis

https://gerrit.wikimedia.org/r/370497

Change 370507 had a related patch set uploaded (by EBernhardson; owner: EBernhardson):
[mediawiki/extensions/CirrusSearch@wmf/1.30.0-wmf.12] Limit the number of tokens in a phrase rescore query

https://gerrit.wikimedia.org/r/370507

Change 370496 merged by jenkins-bot:
[mediawiki/extensions/CirrusSearch@master] Limit the number of tokens in a phrase rescore query

https://gerrit.wikimedia.org/r/370496

Change 370507 merged by jenkins-bot:
[mediawiki/extensions/CirrusSearch@wmf/1.30.0-wmf.12] Limit the number of tokens in a phrase rescore query

https://gerrit.wikimedia.org/r/370507

Mentioned in SAL (#wikimedia-operations) [2017-08-07T18:23:27Z] <ebernhardson@tin> Synchronized php-1.30.0-wmf.12/extensions/CirrusSearch/: T169498 limit phrase token count, T172464 constant boost ltr queries (duration: 00m 58s)

Change 370497 merged by jenkins-bot:
[operations/mediawiki-config@master] Enable max token count for phrase rescore on zh lang wikis

https://gerrit.wikimedia.org/r/370497

Mentioned in SAL (#wikimedia-operations) [2017-08-07T18:59:17Z] <ebernhardson@tin> Synchronized wmf-config/InitialiseSettings.php: T169498 - Enable max token count for phrase rescore on zh lang wikis (step 1) (duration: 00m 46s)

Mentioned in SAL (#wikimedia-operations) [2017-08-07T19:00:24Z] <ebernhardson@tin> Synchronized wmf-config/CirrusSearch-common.php: T169498 - Enable max token count for phrase rescore on zh lang wikis (step 2) (duration: 00m 46s)

After more investigation, i think the zh language analysis chain is a good candidate for this task. We deployed the new analysis chain in late june, and created this task at the very beginning of july. Testing the problematic query above with 90 - chars against all content indices with a rescore window of 1 on the phrase rescore.

I've deployed the bandaid fix that prevents phrase rescore on these queries, the search for 90 - now returns in 40 seconds. Obviously not fixed, but simply finishing instead of running for 20 minutes should be a large improvement.

I'm trying to take a few samples of the task API each time an alerts pops up in Graphite. Those are available on elastic1020:/home/gehel/tasks-<date>.

Mentioned in SAL (#wikimedia-operations) [2017-08-08T13:56:13Z] <gehel> dump of task API for elasticsearch eqiad - T169498

The other problem we seem to be having is related to IO on elastic1017-1031. These machines are consistently doing much more IO than the other machines. See: https://grafana.wikimedia.org/dashboard/db/elasticsearch-io-investigation?orgId=1

One suspicious thing i've tracked down is the amount of memory mapped into the elasticsearch process. This should account for all the mmap'd files that are present within the page cache. There is a stark difference between the troubled servers and the rest. To collect the data below i collected cat /proc/$(pgrep java)/numa_maps from all the servers onto my local machine, ran numa-maps-summary.pl against them, and then summed up N0 and N1 (the two numa zones) to get the total memory assigned to the process. Numbers are in GB.

serverN0 + N1N0 + N1 - JVM Heap
elastic101770.0938.09
elastic101873.9241.92
elastic101970.9238.92
elastic102076.6444.64
elastic102174.4742.47
elastic102277.4545.45
elastic102372.9140.91
elastic102474.8142.81
elastic102572.0540.05
elastic102665.2333.23
elastic102766.9634.96
elastic102880.3848.38
elastic102983.6651.66
elastic103071.1939.19
elastic103171.0639.06
elastic1032111.879.8
elastic1033111.5879.58
elastic1034108.3776.37
elastic1035110.4578.45
elastic1036104.3472.34
elastic1037109.8577.85
elastic1038108.9676.96
elastic1039110.9878.98
elastic1040107.3375.33
elastic1041110.4378.43
elastic1042110.9378.93
elastic1043109.3577.35
elastic1044111.6179.61
elastic1045109.1277.12
elastic1046110.5878.58
elastic1047111.3279.32
elastic1048112.6380.63
elastic1049109.1877.18
elastic1050110.7578.75
elastic1051111.5979.59
elastic1052109.977.9

This may just be another symptom, but I'm hopeful if we can collect enough measures of the difference between servers something will turn up as a possible solution.

I decided what could it hurt, and changed elastic1017 from the mmapfs to niofs. mapped memory reported in numa dropped to almost 0. Disk IO on 1017 is down significantly, to the < 10MB/s we see on the other servers. Will have to watch it over some time to make sure it's really a fix. Might be worth updating a few more servers to use niofs as well so we don't have a single data point?

Change 370834 had a related patch set uploaded (by EBernhardson; owner: EBernhardson):
[operations/puppet@production] Switch elastic1017-1031 to niofs

https://gerrit.wikimedia.org/r/370834

I don't have any proof yet, but i have a sneaky suspicion that each disk block is cachide twice, once for the underlying disk and once for the combined raid0 on md2.

EDIT: I spent some time investigating this and can't see how it would be the case. As far as i can tell when mmap'ing something the page table will refer to an inode, and it doesn't look like unmounted disks can have inodes. Probably ?

Looking at 1017 after about a full day the switch to niofs did dramatically reduce io. But now the io usage has been replaced by system usage, seeing the machine struggle a bit there with system cpu % peaking around 18%. In a way this makes sense, the swap to niofs now uses syscalls for most things instead of the mmap. It seems to be spending most of the time in epoll_wait now. Maybe that's expected? i don't know ...

Some quick info from strace, each was run for 10 seconds.

sudo timeout 10 strace -c -f -p $(pgrep java)

elastic1017:

% time     seconds  usecs/call     calls    errors syscall                                                                                                                     [11/1225]
------ ----------- ----------- --------- --------- ----------------
 72.79  438.520824      261491      1677           epoll_wait
 26.21  157.884666      126510      1248        79 futex
  0.53    3.201233        3154      1015           read
  0.17    1.047508           5    221494           pread
  0.15    0.933792         913      1023           write

elastic1018

% time     seconds  usecs/call     calls    errors syscall
------ ----------- ----------- --------- --------- ----------------
 63.29  115.878545       14467      8010           epoll_wait
 34.46   63.083399        9565      6595       548 futex
  2.21    4.048000       92000        44         5 restart_syscall
  0.02    0.035629           5      6743           read
  0.02    0.030021           5      6615           write

Change 370834 merged by Gehel:
[operations/puppet@production] Switch elastic1017-1031 to niofs

https://gerrit.wikimedia.org/r/370834

To further confirm the suspicion that ~something~ else is being given disk cache i ran a small test. elastic1026 and 1027 were showing similar disk usage, around 200-250MB/s in grafana, basically exactly the same. Linux has an ability to drop currently unused pages from the buffer cache, so utilizing that i set a loop running on 1027:

while true; do echo 3 | sudo tee /proc/sys/vm/drop_caches; sleep 90; done

After about an hour of this running (linux really wanted to give that buffer to something else) buffer cache mapped into elasticsearch rose from 48G to 85G. The difference in read rate between 1026 and 1027 increase from ~0 at the beginning to a 100MB/s difference by the time the buffer cache mapped into elasticsearch filled up to 85G. Note though that this is still not what the well behaving servers are showing, as their average memory usage is around 10MB/s. I'm still looking into that ...

In addition i spent some time digging into linux kernel debug event tracing, to see if i could figure out where this other buffer cache is being used, or what exactly is being cached. Linux has one event in particular, '/sys/kernel/debug/tracing/events/filemap/mm_filemap_add_to_page_cache' . The patch that added this claims 'This patch aims at tracing the eviction reload cycle of executable and shared libraries pages in a memory constrained environment.' If i'm understanding it correctly that means this traces events of memory being loaded into (and a second event for evicting) the page buffer cache.

This script turns on tracing for 10s, and then prints out the block device the cached data was loaded from, and the number of events (each event is for a 4kB page)

echo 1 | sudo tee /sys/kernel/debug/tracing/events/filemap/mm_filemap_add_to_page_cache/enable
sleep 10
echo 0 | sudo tee /sys/kernel/debug/tracing/events/filemap/mm_filemap_add_to_page_cache/enable
sudo cat /sys/kernel/debug/tracing/trace | awk '/: dev / {print $7}' | sort | uniq -c

Results

  2470 0:2
  1383 9:0
188812 9:2

For reference, 0:2 is ???, 9:0 is /dev/md0 (root) and 9:2 is /dev/md2 (/srv, holding elastic data). This seems to negate the theory that somehow data from the disks underlying raid (/dev/sda3 and /dev/sdb3 at 8:3 and 8:19 respectively) are being cached. Will investigate further.

It's not a solution .. but for the moment i've setup a tmux session on elastic1017-1031 running echo 1 | sudo tee /proc/sys/vm/drop_caches every 30 seconds. IO briefly spiked, then climbed down below previous days. Will see what the grafana graphs look like tomorrow. Again I don't think this is any kind of solution, just continued debugging and hopefully minor mitigation until we can figure out whats actually going on.

View on when i first kicked it off (the big spike): https://grafana.wikimedia.org/dashboard/db/elasticsearch-io-investigation?orgId=1&from=1502366760505&to=1502402666763

We can see the large variance in IO between servers dropped considerably. On the server i previously tested this on though this does not bring IO down to expected levels, but it did cut in approximately in half.

Change 371210 had a related patch set uploaded (by EBernhardson; owner: EBernhardson):
[operations/puppet@production] Switch elastic1017 to LVM

https://gerrit.wikimedia.org/r/371210

While its probably too early to say for sure, it looks like aggregate IO on 1017-1031 has dropped from 2.1GB/s last week at this time to 500MB/s. p95 latency is also down across the board compared to last week, Full text p95 is down from 248ms to 170ms.

@Gehel How crazy would it be to switch over one of the older servers to LVM like all the newer stuff? I have exactly 0 proof this will change anything. But its a difference between the servers that jumps out at me while digging into the IO. There is a good chance nothing useful would come of it, other than eliminating another variable. See attached patch for plausible method.

Story time! For the short answer jump to end. Note that this isn't exactly in order, and is probably jumped/hard to follow. sorry :P

As mentioned before drop_caches only drops pages that are not marked mmap. After some investigation i found that when an mmap'd page triggers read ahead only the pages actually accessed have the mmap flag set. Other read ahead pages are simply loaded into the page cache and left to either be used at which point they will have their counter related to mmap usage incrememented, or they will eventually be evicted by the pseudo-LRU policy the kernel uses.

We can use the page-types tool from the kernel tools directory to see what flags are actually set on all our pages. Here are page types from a well behaving server:

             flags      page-count       MB  symbolic-flags                     long-symbolic-flags
0x0000000000000828          257715     1006  ___U_l_____M______________________________ uptodate,lru,mmap
0x0000000000000080          259789     1014  _______S__________________________________ slab
0x000000000000006c          279344     1091  __RU_lA___________________________________ referenced,uptodate,lru,active
0x0000000000000268          305744     1194  ___U_lA__I________________________________ uptodate,lru,active,reclaim
0x0000000000100000          524288     2048  ____________________n_____________________ nopage
0x000000000000082c          632704     2471  __RU_l_____M______________________________ referenced,uptodate,lru,mmap
0x0000000000000000          763312     2981  __________________________________________
0x0000000000000068         2108618     8236  ___U_lA___________________________________ uptodate,lru,active
0x000000000000086c         6987343    27294  __RU_lA____M______________________________ referenced,uptodate,lru,active,mmap
0x0000000000005868         8589411    33552  ___U_lA____Ma_b___________________________ uptodate,lru,active,mmap,anonymous,swapbacked
0x0000000000000868        12513737    48881  ___U_lA____M______________________________ uptodate,lru,active,mmap
             total        34078720   133120

And here are the page types for a mis-behaving server:

             flags      page-count       MB  symbolic-flags                     long-symbolic-flags
0x0000000000100000          262144     1024  ____________________n_____________________ nopage
0x0000000000000828          340276     1329  ___U_l_____M______________________________ uptodate,lru,mmap
0x000000000000086c          515691     2014  __RU_lA____M______________________________ referenced,uptodate,lru,active,mmap
0x0000000000000028          687263     2684  ___U_l____________________________________ uptodate,lru
0x0000000000000000          785662     3068  __________________________________________
0x0000000000000868         7946840    31042  ___U_lA____M______________________________ uptodate,lru,active,mmap
0x0000000000005868         8588629    33549  ___U_lA____Ma_b___________________________ uptodate,lru,active,mmap,anonymous,swapbacked
0x0000000000000068        14133541    55209  ___U_lA___________________________________ uptodate,lru,active
             total        33816576   132096

The drop_caches basically drops all those pages marked uptodate,lru,active every 30 seconds so it never grows large enough to evict the mmap pages that are actually being used.

So, look into the readahead settings?

ebernhardson@elastic1018:~$ sudo blockdev --report /dev/md2
RO    RA   SSZ   BSZ   StartSec            Size   Device
rw  4096   512  4096          0    537869156352   /dev/md2
ebernhardson@elastic1050:/sys$ sudo blockdev --report /dev/md2
RO    RA   SSZ   BSZ   StartSec            Size   Device
rw   256   512  4096          0    749030342656   /dev/md2

readahead is set to 4096 on the misbehaving servers, but only 256 on the poorly performing servers! So we just adjust this setting: sudo blockdev --setra 256 /dev/md2 and...no change :(

Lets verify we really are getting insane readaheads. After many hours of poking around and digging through docs and code, i figure out how to inspect page table readahead in real time:

sudo perf probe --add '__do_page_cache_readahead nr_to_read:u32'
sudo perf record probe:__do_page_cache_readahead -a -- sleep 1
sudo perf script | grep ^java | sed 's/.*nr_to_read/nr_to_read/ | sort | uniq -c

I don't have the output handy anymore, but the results were basically that the 1050, for the 1 second i recorded, was doing all readaheads at 32 pages. elastic1017 on the other hand was doing half its readaheads at 32 pages, and the other half at 512 pages.

It seems that the reason IO usage stayed relatively high event with the drop_ccaches hack was because every page fault was still pulling in 512 pages (=2MB) instead of the 32 pages (=128kB) that the other servers were. This 16x increase in readahead size roughly correlates to the difference in IO between well behaving servers, and mis-behaving servers with the drop_caches hack applied.

It really does look like readahead is our problem. So lets hack ourselves into the elasticsearch process and use the madvise syscall to set all the files to MADV_RANDOM which will disable readahead. I wrote a little C program to do this, for posterity kept at P5883. Running this program resulted in a drop in IO usage from 200MB/s to less than 5 MB/s for elastic1017.

Armed with this new knowledge i poked our ops team about how to fix this without some evil hacks. Digging through the linux source @mark identified that memory mapped readahead is only synced with the block device when the map is first created. To loop back to earlier, most likely the reason elastic1017 readahead measured with perf was split was that old files still used the full readahead but newly mapped files were using the new readahead. Armed with this new info i ensured the new readahead settings were stlil active on 1017 and restarted elastic1017. Currently elastic1017 is still picking up the pieces from it's restart, but with ~70 shards loaded IO usage seems to be staying low. In a few hours we should know more conclusively if the readahead settings have fixed things.

TL/DR: readahead settings on elastic1017-31 were causing page faults to read in 2MB of data it didn't need. In retrospect this should have been checked much earlier, and in fact i did notice a couple days ago the readahead was off, but without the knowledge that readahead settings are copied from the blockdevice to the mmap only on creation it appeared the readahead was not the culprit.

6 hours later, 1017 is looking quite happy. It looks like adjusting readahead and restarting elasticesarch should do the trick.

Change 371210 abandoned by EBernhardson:
Switch elastic1017 to LVM

Reason:
root cause has been traced to readahead, this is unnecessary to test now.

https://gerrit.wikimedia.org/r/371210

Change 371962 had a related patch set uploaded (by EBernhardson; owner: EBernhardson):
[operations/puppet@production] Revert "Switch elastic1017-1031 to niofs"

https://gerrit.wikimedia.org/r/371962

Change 371963 had a related patch set uploaded (by EBernhardson; owner: EBernhardson):
[operations/puppet@production] Set elasticsearch servers to use 128kB readahead

https://gerrit.wikimedia.org/r/371963

Change 371962 merged by Gehel:
[operations/puppet@production] Revert "Switch elastic1017-1031 to niofs"

https://gerrit.wikimedia.org/r/371962

@EBernhardson this is all incredibly impressive, kudos!

One question only: do you have any idea (or suspicion) why the readahead settings were different between the two groups of servers? Is there any follow-up we should be doing in order for this to not happen again?

@faidon My current suspicion, based on looking at a couple other servers, is that the varied read ahead comes from the different defaults between linux software raid and LVM. I haven't found exactly where those are choosing their read aheads, but it seems to be the main difference between ones with large read ahead (software raid) and small read ahead (LVM). For elasticsearch servers we are going to explicitly set the readahead. More generally it seems like for servers that mmap all their data watching the ratio between Mapped and Cached in /proc/meminfo is a reasonable indicator of how much cache is actually used for the server, as opposed to over zealous readahead or other running processes.

Change 371963 merged by Gehel:
[operations/puppet@production] Set elasticsearch servers to use 128kB readahead

https://gerrit.wikimedia.org/r/371963

puppet patch to set read ahead is merged. @EBernhardson you can probably kill your tmux sessions...

have all the elasticsearch instances been restarted since updating readahead? Annoyingly readahead on mmaped files only updates when they are opened.

oh actually nevermind, the tmux session is actually disabling the readahead on all newly opened files. I'll go ahead and kill all the tmux sessions.

After some exhaustive research, I think we can call this one done! :) Thanks, @Gehel, @faidon and @EBernhardson