Page MenuHomePhabricator

Collect feedback on the Wikimedia Technical areas diagram
Closed, ResolvedPublic

Description

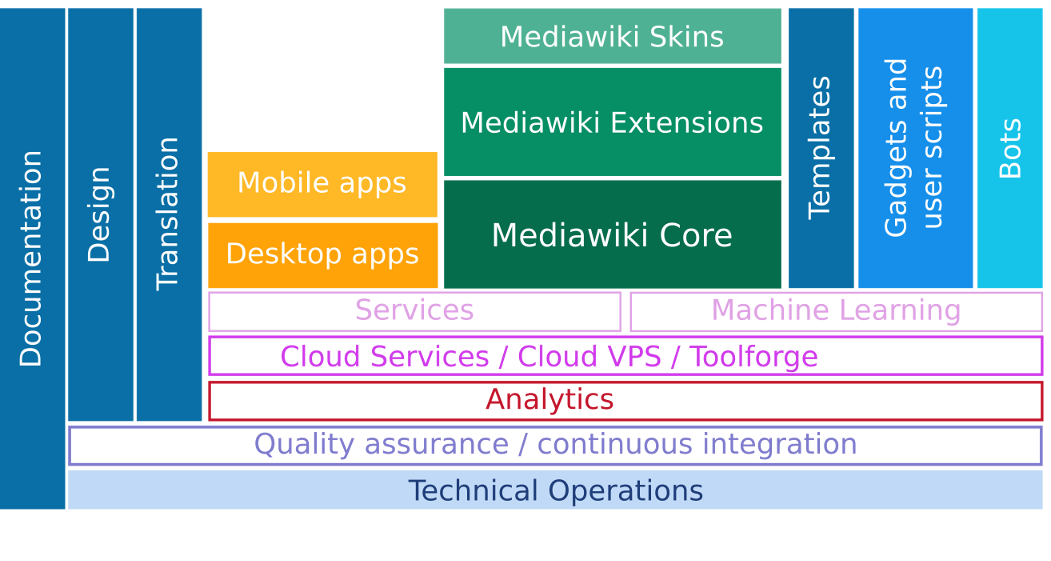
This task is about collecting feedback on the Wikimedia technical areas diagram that we show while introducing Wikimedia technical areas at hackathons and developer events. This session is usually organized to give newcomers an overview before they dive into the projects and to help them get started.

See https://commons.wikimedia.org/wiki/File:Wm_technical_areas.svg

I am hoping to meet with 1 or 2 experienced developers and gather feedback on:

  1. Our (my) understanding of the technical areas diagram
  2. Improve the diagram and ensure it is correct
  3. Figure out a way to separate technical & non-technical pieces
  4. Prioritize what to showcase first from onboarding newcomers perspective
  5. Figure out where projects like Wikidata, ORES, Huggle, WikiEd dashboard, Bots, Notifications that we often promote at our events fit in these blocks

Event Timeline

Really minor, but in the next iteration of the diagram "Labs and Tools" should change to "Cloud Services, Cloud VPS, & Toolforge" or something similar to align with T168480: Perform core Cloud Services rebranding.

[replaced the link to some page in some PDf file by the link https://commons.wikimedia.org/wiki/File:Wm_technical_areas.svg in the task desc]

Notes from meeting with Matt/Roan:

  • Try to have two versions of the diagram, one that lists programming languages
  • Explain the relationship between templates and Lua
  • There could be a “Services” block in the diagram referring to services like citoid, parsoid, etc.
  • Design and translation blocks missing. With both, there can be tech/non-tech ways to contribute
  • Wikimedia contributions areas over technical areas (title)
  • Machine Learning / Bots be separate as they are. ORES to refer with the ML block
  • Difficult to read the blocks that have vertical text on them
  • Order to explain the areas from newcomers perspective -> extensions, templates, gadgets, mobile apps, cloud services, QA...
  • About Wikidata - As an example under extensions, a complicated one though. It in itself comprises a group of extensions

My question: "Where to put ORES in Services or in Machine Learning, where ORES be the only one. With services, I am referring to tools like Citoid, Parsoid, Mathoid, etc. that powers Wikimedia projects, and by definition, ORES falls in this category too"

Aaron's answer:

So, I'm not sure I see what's common from a technical contributor point of view to Citoid, Parsoid, or Mathoid. From a contributor point of view, "Services" is less important than "Machine Learning" to ORES. In the same way, I'd imagine that "Programming Languages" is more important to "Parsoid" than the fact that it is a "Service". In the Scoring Platform project, we maintain a lot more than just services like ORES (e.g. we are looking for someone to help us with mobile dev for "Wiki labels" -- the thing that helps us gather training data for our models).

Note for self: I assume the same as below, need to get clarity on this at some point:

Also one other note. What does size suggest in these areas? E.g. why is MediaWiki Core the biggest box? Seems to me that Bots and Gadgets/user scripts represent vastly more lines of code and functionality than MediaWiki Core. If we're measuring by budget, the Mobile Apps and Site Operations should dominate the space.

About that diagram: Why is "bots" so far away from "user scripts"? That implies that there's no connection between a bot running AWB in fully automatic mode and a human running AWB in semi-manual mode.

srishakatux lowered the priority of this task from High to Medium.Aug 21 2017, 8:07 PM

Really minor, but in the next iteration of the diagram "Labs and Tools" should change to "Cloud Services, Cloud VPS, & Toolforge"

{{done}}

(And if there's agreement what to do how here, I'd be happy to help with editing the SVG.)

Been seriously wondering whether to use randomly placed disconnected bubbles for each item. Because layers imply hierarchies. This diagram does not show correct hierarchies. I believe it never will. Because things are complex, blurry. And this diagram is 2D.

Anyway. Quick and dirty draft (ignoring colors, exact alignments, hierarchy, etc) trying to square the circle that I just made while lurking at this conference:

Wm_technical_areas.svg.png (561×1 px, 123 KB)
Eh?

Sweet! :)

I forgot to add an update on this task earlier about the feedback I incorporated in the diagram for Wikimania presentation. Not sure if you have seen it https://commons.wikimedia.org/w/index.php?title=File:Wikimedia_Technical_Areas_An_Overview.pdf&page=2.

In any case, the open-ended questions still left were pretty much what you've mentioned: reasoning for the hierarchy of blocks and why some blocks are bigger than others (e.g. MW Core).

Two questions on the diagram:

  • Does documentation, design and translation placement the way it is right now mean anything?
  • Analytics - in general, is it an area that one could contribute to, if so where do we point people to who are willing to help?

Rest looks good to me!

I forgot to add an update on this task earlier about the feedback I incorporated in the diagram for Wikimania presentation. Not sure if you have seen it https://commons.wikimedia.org/w/index.php?title=File:Wikimedia_Technical_Areas_An_Overview.pdf&page=2.

Oh, hadn't seen that one! Nice, might also totally work!

In any case, the open-ended questions still left were pretty much what you've mentioned: reasoning for the hierarchy of blocks and why some blocks are bigger than others (e.g. MW Core).

Probably should have the same width in the link that you provided, indeed. Or height in my quick drawing above.

Two questions on the diagram:

  • Does documentation, design and translation placement the way it is right now mean anything?

In theory - I thought that the areas left of these columns rely on docs, design, translation. But as the rest of the element positions are no clear hierarchy I'm not too convinced either...

  • Analytics - in general, is it an area that one could contribute to, if so where do we point people to who are willing to help?

There are some smaller tasks but not a specific area in Analytics to point to, no.

I like your diagram more than the one I've in the slides, atleast the former questions hierarchy less and is consistent with the previous design which is on-wiki :)

  • Analytics - in general, is it an area that one could contribute to, if so where do we point people to who are willing to help?

There are some smaller tasks but not a specific area in Analytics to point to, no.

Same applies for "Services" (not many projects/tasks to point to). Or QA/CI. Or MediaWiki core...

@Aklapper very very nice <3 Only very very minor thing that the machine learning is getting cut out a bit on the right, rest it looks great :)

Argh, page setup... Let's try again (works as expected in rsvg-view-3):

Thanks a lot, Andre for working on my task :P