Page MenuHomePhabricator

mediawiki-core-phpcs-docker jobs running on integration-slave-docker-1001 are running significantly slower than other slaves
Closed, ResolvedPublic

Event Timeline

Mentioned in SAL (#wikimedia-releng) [2017-09-29T05:59:03Z] <legoktm> marking integration-slave-docker-1001 as offline - T177039

While not nearly as obvious, you can sometimes see operations-puppet jobs running for ~2 min on 1001: https://integration.wikimedia.org/ci/job/operations-puppet-tests-docker/buildTimeTrend

So before I look into this too much I'll say that I ran into my lintr job timing out when running on 1001.
Investigating that caused m to file T176623 and T176747.
I'll have another look at that host now

So, as far as I can tell this is probably due to more memory being used on 1001 and 1002 than the other machines. output of "free -m" below:

#1001
             total       used       free     shared    buffers     cached
Mem:          2004       1823        181          3          0         34
-/+ buffers/cache:       1788        215
Swap:          510        133        377

#1002
             total       used       free     shared    buffers     cached
Mem:          2004       1794        209         14         15        283
-/+ buffers/cache:       1495        508
Swap:          510        106        404

#1003
             total       used       free     shared    buffers     cached
Mem:          2004       1137        866         41         52        374
-/+ buffers/cache:        711       1293
Swap:          510          0        510

#1004
             total       used       free     shared    buffers     cached
Mem:          2004       1192        811         41         88        522
-/+ buffers/cache:        582       1421
Swap:          510          0        510

Looking at the timings for the phpcs job 1002 also seems to have been talking 4-5 minutes from some runs recently..

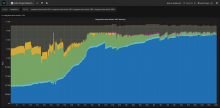
Both 1001 and 1002 are the older machines and it looks like 1001 has just slowly been eating away all of its memory, see here for the last 3 months:

image.png (945×1 px, 190 KB)

and it looks like 1002 is also going this way.

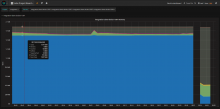
After a reboot of 1001:

addshore@integration-slave-docker-1001:~$ free -m
             total       used       free     shared    buffers     cached
Mem:          2004        587       1417          5         23        311
-/+ buffers/cache:        252       1751
Swap:          510          0        510

image.png (952×1 px, 115 KB)

I'm going to turn it back on and see how it performs, but we should probably leave this ticket open to find the root of the problem....

Mentioned in SAL (#wikimedia-releng) [2017-09-29T09:40:53Z] <addshore> marking integration-slave-docker-1001 as online - T177039

My rebuild of a job on 1001 that did that 25 mins yesterday (apparnetly) now only takes 2.something mins again (as to be expected) https://integration.wikimedia.org/ci/job/mediawiki-core-phpcs-docker/52
So it looks like the low running is indeed from lack of memory.

On integration-slave-docker=1002

free -m
             total       used       free     shared    buffers     cached
Mem:          2004       1819        184         14         17        284
-/+ buffers/cache:       1516        487
Swap:          510        106        404
CommandVIRTRES
java -jar slave.jar2028M73384
dockerd918M26684
diamond840M1620
nslcd423M5300

I have disconnected/reconnected the Jenkins slave and restarted docker. That has shred some of the memory. I have no idea what is using the 1.5G that is still reportedly being used :]

slabtop --sort c --once|head -n 15
 Active / Total Objects (% used)    : 5549543 / 5577705 (99.5%)
 Active / Total Slabs (% used)      : 346081 / 346081 (100.0%)
 Active / Total Caches (% used)     : 76 / 140 (54.3%)
 Active / Total Size (% used)       : 1380697.02K / 1384041.01K (99.8%)
 Minimum / Average / Maximum Object : 0.02K / 0.25K / 4096.00K

  OBJS ACTIVE  USE OBJ SIZE  SLABS OBJ/SLAB CACHE SIZE NAME                   
5294320 5293902  99%    0.25K 330895       16   1323580K kmalloc-256            
130473 130069  99%    0.19K   6213       21     24852K dentry                 
 11963  11911  99%    0.57K   1709        7      6836K inode_cache            
  4602   4587  99%    1.05K   1534        3      6136K ext4_inode_cache       
 37245  36342  97%    0.10K    955       39      3820K buffer_head            
  4151   3083  74%    0.56K    593        7      2372K radix_tree_node        
   549    549 100%    4.00K    549        1      2196K kmalloc-4096           
  2544   2314  90%    0.62K    424        6      1696K proc_inode_cache

My guess is some memory leak / cache not being reclaimed.

Found via /proc/meminfo and the slab allocation:

Slab:            1386436 kB
SReclaimable:      45988 kB
SUnreclaim:      1340448 kB

Something fills kmalloc-256 and they blocks are never reclaimed / are not reclaimable.

Mentioned in SAL (#wikimedia-releng) [2017-10-02T12:16:06Z] <addshore> marking integration-slave-docker-1002 as offline T177039

jenkins is defnitely using a huge chunk of memory:

thcipriani@integration-slave-docker-1002:~$ ps ax -o vsz,rsz,nlwp,user,pid,cmd | sort -rn | head                                                                         
2075716 90388  16 jenkins+ 18576 java -jar slave.jar                                                                                                                     
871724 30652   14 root     32016 /usr/bin/dockerd -H fd://                                                                                                               
860172  1864   12 root     31866 /usr/bin/python /usr/bin/diamond --foreground                                                                                                                                                                    
...

But that doesn't seem inconsistent with other hosts really:

thcipriani@integration-slave-jessie-1001:~$ ps ax -o vsz,rsz,user,pid,cmd | sort -rn | head                                                                               
2425792 237704 jenkins+ 24613 java -jar slave.jar                                                                                                                        
1180488 71772 root    21883 /usr/sbin/nscd                                                                                                                               
1021256 305808 mysql   3015 /usr/sbin/mysqld --basedir=/usr --datadir=/var/lib/mysql --plugin-dir=/usr/lib/mysql/plugin --user=mysql --log-error=/var/log/mysql/error.log --pid-file=/var/run/mysqld/mysqld.pid --socket=/var/run/mysqld/mysqld.sock --port=3306
...

It could just be that the node pool instances have more memory to start with and or get thrown away rapidly so we dont see this issue with them?

It could just be that the node pool instances have more memory to start with and or get thrown away rapidly so we dont see this issue with them?

for nodepool, yeah, we throw them away after first use.

FWIW, the other integration project jenkins-agents are all m1.mediums with 4GB of memory whereas all the integration-docker instances are ci1.mediums with 2GB of memory.

I created 1 4GB instance at the end of last week so that I could continue working towards some sort of phan extension job.
T177031#3650377
I wonder if the same memory usage increase will end up happening on this instance given time.

Please keep integration-slave-docker-1002 around. I guess we can try to investigate :]

Since I suspect a kernel leak, Tyler pointed out that the 1001 and 1002 instances have different kernels.

10014.9.30-2+deb9u2~bpo8+1Got rebooted 6 days ago
10024.9.25-1~bpo8+3Uptime 106 days

I am rebooting 1002 so it catches the latest kernel.

Mentioned in SAL (#wikimedia-releng) [2017-10-05T19:11:33Z] <hasharAway> rebooting integration-slave-jessie-1002 to catch with kernel upgrade and pooling it back in Jenkins - T177039

Mentioned in SAL (#wikimedia-releng) [2017-10-05T19:15:00Z] <hasharAway> rebooting integration-slave-docker-1002 to catch with kernel upgrade and pooling it back in Jenkins - T177039

hashar triaged this task as Medium priority.Oct 6 2017, 8:27 AM
hashar moved this task from Backlog to In-progress on the Release-Engineering-Team (Kanban) board.

Lets monitor the instances for memory usage (and specially slabtop). If the kmalloc-256 slab has not raised after a week or so, I guess we can confidently mark this task as resolved (via the kernel upgrade).

Looked at slabtop on both instances. kmalloc-256 is at minimum level (4k objects). So that was definitely a bug in the Linux kernel