Contributions by:
- individuals
- mass-tools/institutions
- number of contributions as of present time
- compare to what it looked like 30 days ago
| debt | |
| Oct 3 2017, 11:38 PM |
| F10169827: nfile_bot_month_prop.png | |
| Oct 13 2017, 12:53 AM |
| F10169825: nfile_bot_month.png | |
| Oct 13 2017, 12:53 AM |
| Status | Subtype | Assigned | Task | ||
|---|---|---|---|---|---|
| Resolved | None | T174072 [Q1 2017-18 Objective] Extend Commons search to support media via structured data | |||
| Resolved | • chelsyx | T174519 [epic] SDoC: Determine baseline for metrics | |||
| Resolved | • chelsyx | T177354 Metrics for SDoC: look at contributions |
The number of files uploaded by bots is 9,390,408 (22.04%), and the number of files uploaded by users is 33,222,838 (77.96%). The following table break down the counts by major mime:
| img_major_mime | user_group | n_files |
| application | user | 927448 |
| application | bot | 273617 |
| audio | user | 12479 |
| audio | bot | 2206 |
| image | user | 32242778 |
| image | bot | 9113650 |
| video | user | 40133 |
| video | bot | 935 |
Query:
SELECT img_major_mime, user_group, COUNT(*) AS n_files
FROM (
-- Get active/inactive bots
SELECT ug_user AS user_id, ug_group AS user_group
FROM user_groups
WHERE ug_group = 'bot'
UNION
SELECT ufg_user AS user_id, ufg_group AS user_group
FROM user_former_groups
WHERE ufg_group = 'bot'
UNION
-- Get user ids with bot categories in their user pages
SELECT user.user_id, 'bot' AS user_group
FROM user INNER JOIN (
  -- all user page names with bot category
  SELECT REPLACE(page.page_title, '_', ' ') AS user_name
  FROM page INNER JOIN (
    -- page ids with bot categories
    SELECT DISTINCT cl_from AS page_id
    FROM categorylinks
    WHERE cl_to REGEXP '_(bot_flag|bots)(_|$)'
      AND cl_type = 'page'
  ) AS bot_cat ON page.page_id=bot_cat.page_id
  WHERE page_namespace = 2
) AS bot_name ON user.user_name=bot_name.user_name
) AS bots RIGHT JOIN image ON bots.user_id = image.img_user
GROUP BY img_major_mime, user_group;
Hey @chelsyx - what time frame does this cover?
Can we also get a count of how this has changed over the last week and compare that to the last 30 days? It'd be interesting to see if the numbers are fairly consistent (individual vs institution) or if they have changed quite a bit when extending the time scope.
Jumping in to say this looks like it's from launch of Commons to now.
Can we also get a count of how this has changed over the last week and compare that to the last 30 days? It'd be interesting to see if the numbers are fairly consistent (individual vs institution) or if they have changed quite a bit when extending the time scope.
@chelsyx this may be useful: https://wikitech.wikimedia.org/wiki/Analytics/Data_Lake/Edits as it contains monthly snapshots of the page & user tables as of April 2017
Hey @chelsyx - what time frame does this cover?
Jumping in to say this looks like it's from launch of Commons to now.
Thanks @mpopov ! Yes, this is the file counts on Oct 10.
Can we also get a count of how this has changed over the last week and compare that to the last 30 days? It'd be interesting to see if the numbers are fairly consistent (individual vs institution) or if they have changed quite a bit when extending the time scope.
@chelsyx this may be useful: https://wikitech.wikimedia.org/wiki/Analytics/Data_Lake/Edits as it contains monthly snapshots of the page & user tables as of April 2017
Unfortunately, the mediawiki snapshot doesn't has the image table which describes images and other uploaded files.
Ah, yeah. I missed the reference to image in your query. But looks like we can use img_timestamp, although those queries will take some time.
Also something to note is that img_major_mime shows up as "application" for .ogg files (which are audio files) and .pdf files:
SELECT DISTINCT img_major_mime, img_minor_mime
FROM commonswiki.image;
| img_major_mime | img_minor_mime |
|---|---|
| image | gif |
| image | jpeg |
| image | png |
| image | tiff |
| image | vnd.djvu |
| image | webp |
| image | x-xcf |
| image | svg+xml |
| application | ogg |
| audio | midi |
| audio | wav |
| audio | webm |
| audio | x-flac |
| video | webm |
| application | |
I recommend adding a CASE that returns "audio" for ogg files and "document" (for example) for PDFs.
@mpopov Looks like the file type categorization on commons is messier than we thought...
For example, File:Krazy_Kat_Bugolist_1916_silent.ogv is an ogv file, but its img_minor_mime is ogg, img_major_mime is application, and img_media_type is video. This is the same for other ogv files. While for ogg files like File:Whitenoisesound.ogg, its img_minor_mime is ogg, img_major_mime is application, and img_media_type is audio.
But I'm not sure if the field img_media_type is more reliable:
| img_media_type | img_major_mime | img_minor_mime |
| BITMAP | image | gif |
| BITMAP | image | jpeg |
| AUDIO | audio | midi |
| AUDIO | application | ogg |
| VIDEO | application | ogg |
| MULTIMEDIA | application | ogg |
| OFFICE | application | |
| BITMAP | image | png |
| DRAWING | image | svg+xml |
| BITMAP | image | tiff |
| BITMAP | image | vnd.djvu |
| AUDIO | audio | wav |
| AUDIO | audio | webm |
| VIDEO | video | webm |
| BITMAP | image | webp |
| AUDIO | audio | x-flac |
| BITMAP | image | x-xcf |
Updated: On Oct 12, 2017, the number of files uploaded by bots is 9,390,721 (22.03%), and the number of files uploaded by users is 33,241,541 (77.97%). The following table break down the counts by media type:
| Media Type | User Group | Number of Files | Proportion |
|---|---|---|---|
| bitmap | user | 31355343 | 73.55% |
| bitmap | bot | 8843447 | 20.74% |
| drawing | user | 905964 | 2.13% |
| drawing | bot | 270516 | 0.63% |
| audio | user | 698566 | 1.64% |
| audio | bot | 95646 | 0.22% |
| video | user | 71738 | 0.17% |
| video | bot | 36329 | 0.09% |
| multimedia | user | 4 | 0% |
| office | user | 209926 | 0.49% |
| office | bot | 144783 | 0.34% |
Please note that some bots are operated by institution, and some are tools like Flickr upload bot.
The following two graphs breakdown the number by month:
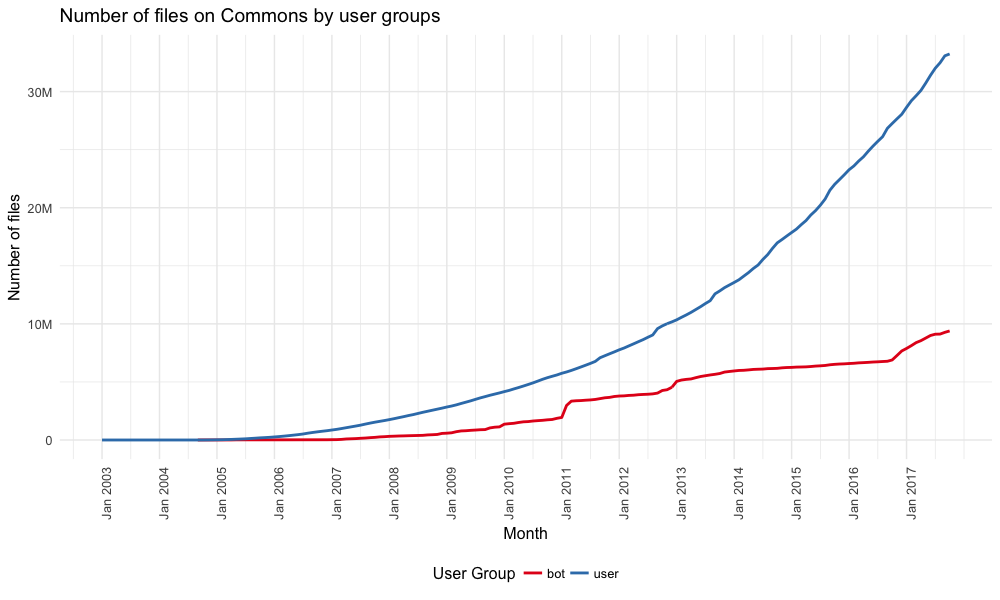
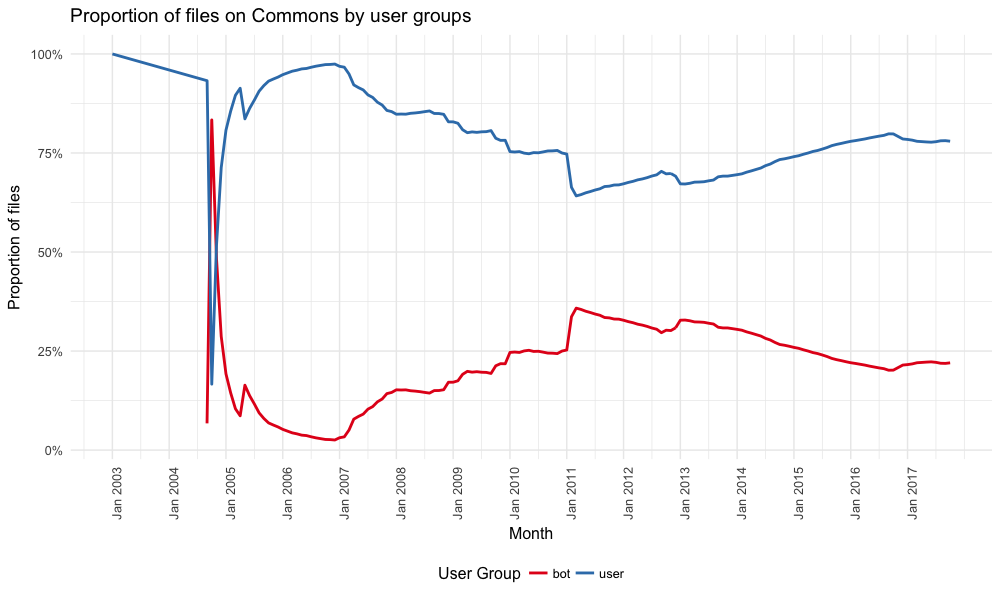
At the end of September, 9270420 (21.89%) files are uploaded by bot, and 33081547 (78.11%) are by user. At the end of August, the number is 9120168 (21.92%) vs 32483351 (78.08%).
@chelsyx do you wanna add your stuff to https://github.com/wikimedia-research/SDoC-Initial-Metrics ?
Is the user versus bot percentage overall? I am not sure that is of value to quantify usage as of 2017, right? See timeseries of uploads by bots/users at https://stats.wikimedia.org/wikispecial/EN/TablesWikipediaCOMMONS.htm (scroll down)
Most recent monthly numbers (for December 2016) differ quite a bit from the percentages @chelsyx lists above , they are more like 50/50 so it will be worth checking if the select above can repro those numbers and maybe look at data monthly?
Dec 2016 total=806,459 bots=392,565 user=413,894
Hi @Nuria , the numbers I showed above are cumulative sum at the end of each month, while the numbers you talked about are newly uploads for each month. From my query, for Dec 2016, the number of newly uploaded files by bots are 392,566, by users = 392,786. This is closed to what is shown on https://stats.wikimedia.org/wikispecial/EN/TablesWikipediaCOMMONS.htm.
I think the differences came from two sources:
1, I assume the numbers on https://stats.wikimedia.org/wikispecial/EN/TablesWikipediaCOMMONS.htm are computed at the end of each month and files could be deleted afterwards. For the numbers above, I used the image table and only counts the files that are still there on Oct 12, 2017.
2, According to commons bots, not all accounts being operated as bots has a bot flag, so I also include accounts with the keywords "bot_flag" or "bots" (see the query below).
Query for counting newly uploaded files on commons:
SELECT LEFT(img_timestamp, 6) AS yr_month, user_group, COUNT(*) AS n_files
FROM (
-- Get active/inactive bots
SELECT ug_user AS user_id, ug_group AS user_group
FROM user_groups
WHERE ug_group = 'bot'
UNION
SELECT ufg_user AS user_id, ufg_group AS user_group
FROM user_former_groups
WHERE ufg_group = 'bot'
UNION
-- Get user ids with bot categories in their user pages
SELECT user.user_id, 'bot' AS user_group
FROM user INNER JOIN (
  -- all user page names with bot category
  SELECT REPLACE(page.page_title, '_', ' ') AS user_name
  FROM page INNER JOIN (
    -- page ids with bot categories
    SELECT DISTINCT cl_from AS page_id
    FROM categorylinks
    WHERE cl_to REGEXP '_(bot_flag|bots)(_|$)'
      AND cl_type = 'page'
  ) AS bot_cat ON page.page_id=bot_cat.page_id
  WHERE page_namespace = 2
) AS bot_name ON user.user_name=bot_name.user_name
) AS bots RIGHT JOIN image ON bots.user_id = image.img_user
GROUP BY LEFT(img_timestamp, 6), user_group;
@chelsyx That makes sense, thank you.
I was also trying to make a meta point though: since prior work and statistics exist for commons it will be worth documenting ( on meta?) these numbers and why/how they differ with other numbers community might have access to. I know some of your discovery work has been going to github but i doubt it is looked by our community there, findings should probably be documented here: https://meta.wikimedia.org/wiki/Structured_Data_on_Commons (even if your more technical work remains on github)