Page MenuHomePhabricator

Graph visualization not working in query service UI installed via wikibase-docker
Closed, ResolvedPublic

Description

I successfully installed and populated a local Wikibase instance via Docker, following @Addshore's instructions. Everything seems to work smoothly, except that the graph plugin doesn't render results. It is greyed out as a visualization option in the menu when I run a query that returns graph-compatible results.

I created several items in my local instance connected via property P5 ("child"). The following query returns several results, formatted according to the Graph specs:

# #defaultView:Graph
SELECT ?parent ?parentLabel ?child ?childLabel  WHERE {
  ?parent wdt:P2 wd:Q3. #parents should be an instance of humans
  ?parent wdt:P5 ?child. #parents link to children via P5 ("child") property
  SERVICE wikibase:label { bd:serviceParam wikibase:language "[AUTO_LANGUAGE],en". }
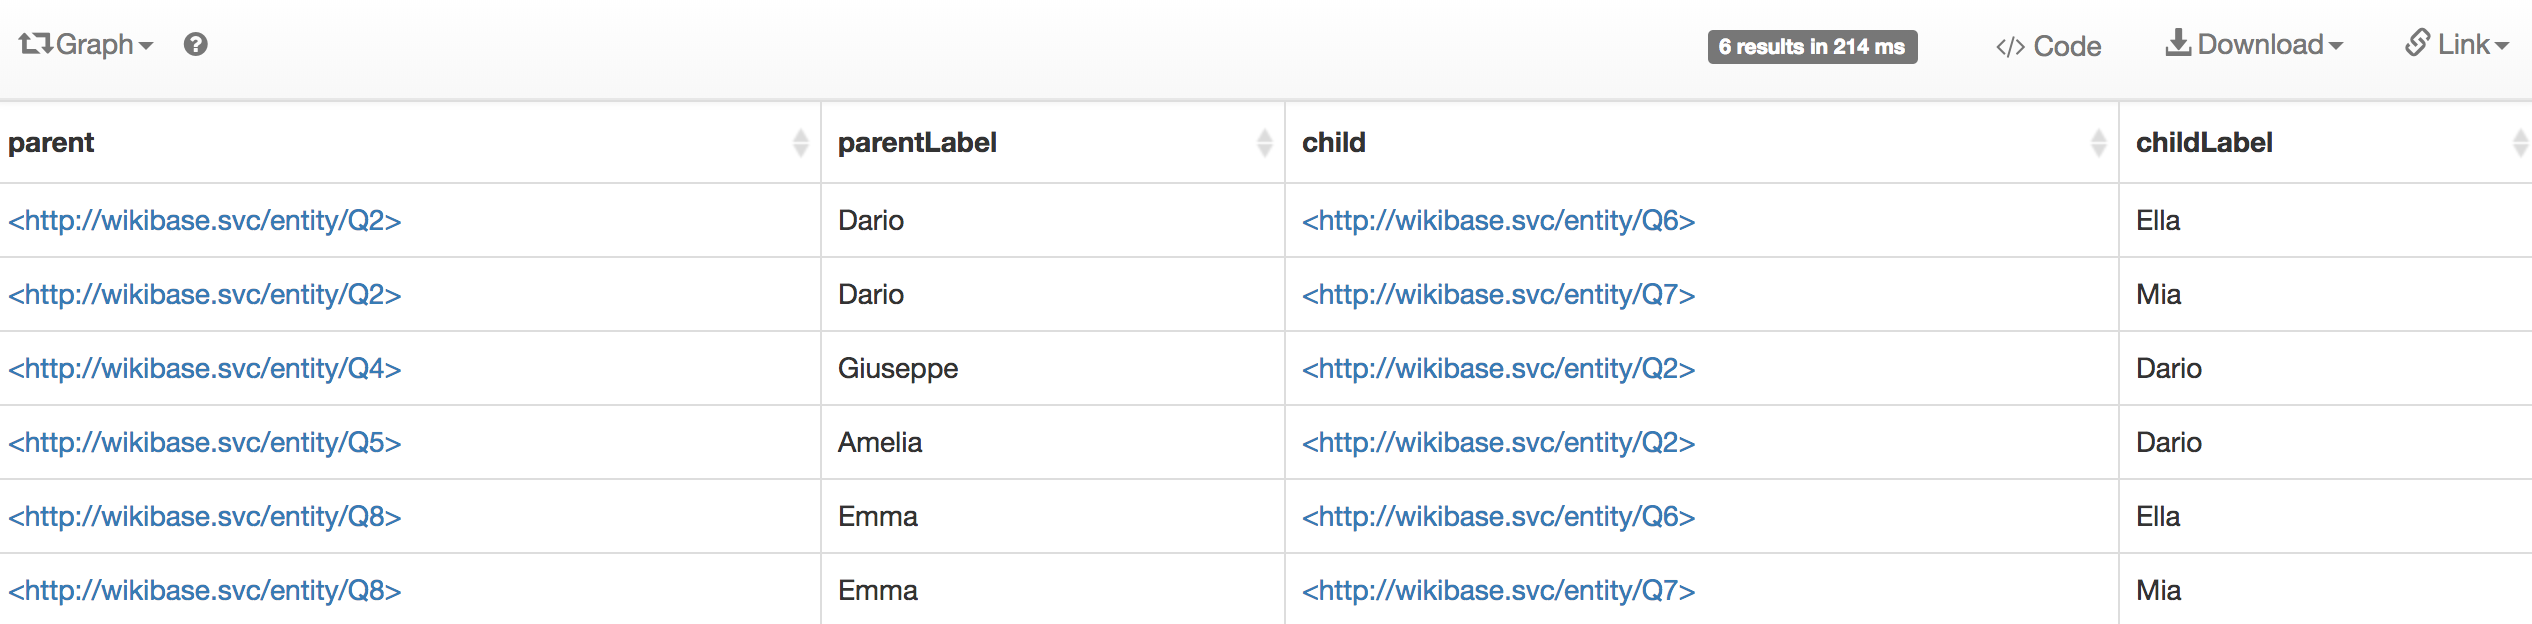
}

These are the results in table view:

Screen Shot 2018-02-04 at 10.58.39 AM.png (624×2 px, 155 KB)

The Graph option is greyed out and I don't understand why. If I try and force a Graph layout I get an empty screen. Other visualization options seem to work fine.

I am on Mac OS High Sierra and this doesn't see to be a browser specific issue. cc @Jonas

Event Timeline

Oops, looks like we have a hard-coded reference to Wikidata in FormatterHelper.isEntityUri… probably needs to be configurable. (This actually affects other result browsers as well – for instance, notice how you see the full URI in the table instead of “🔍 wd:Q2”.)

DarTar renamed this task from Graph visualization not working in query service UI to Graph visualization not working in query service UI installed via wikibase-docker.Feb 4 2018, 7:19 PM

Oops, looks like we have a hard-coded reference to Wikidata in FormatterHelper.isEntityUri… probably needs to be configurable. (This actually affects other result browsers as well – for instance, notice how you see the full URI in the table instead of “🔍 wd:Q2”.)

noticed that, although it doesn't seem to affect the rendering of results using other visualization modes.

If I try and force a Graph layout I get an empty screen

to be precise, the Graph layout controls appear, suggesting that the module is loaded, but there's nothing to be seen.

@Jonas any clue as to why this may be happening?

Seems like we need to make more stuff configurable or more generic.

Oops, looks like we have a hard-coded reference to Wikidata in FormatterHelper.isEntityUri… probably needs to be configurable. (This actually affects other result browsers as well – for instance, notice how you see the full URI in the table instead of “🔍 wd:Q2”.)

It is not much work, but we will need to find time for it...
Sadly, I will not be on the Hackathon.

Change 415076 had a related patch set uploaded (by Jonas Kress (WMDE); owner: Jonas Kress (WMDE)):
[wikidata/query/gui@master] Relax entity matching pattern to allow other hosts

https://gerrit.wikimedia.org/r/415076

Change 415076 merged by jenkins-bot:
[wikidata/query/gui@master] Relax entity matching pattern to allow other hosts

https://gerrit.wikimedia.org/r/415076

It might need a version bump/rebuild @Addshore .

@DarTar can you check if it’s working now?

it is not, I tried a full rebuild with docker-compose up --build -d but the problem persists.

@DarTar can you check if it’s working now?

! In T186467#4042886, @Jonas wrote:

It might need a version bump/rebuild @Addshore .

The image will indeed need a rebuild.

@DarTar can you check if it’s working now?

it is not, I tried a full rebuild with docker-compose up --build -d but the problem persists.

Interesting.
I guess this needs some more investigation.

I am wondering if the fact that the results use the full URI for the entity (as opposed to the QID) is somehow breaking the Graph visualization plugin.

I don't know what fixed it, but in the latest docker build, the graph plugin is working fine!