Page MenuHomePhabricator

Make it possible to see retention over time (graph maybe)
Open, Needs TriagePublic

Description

(From the user feedback interview.)

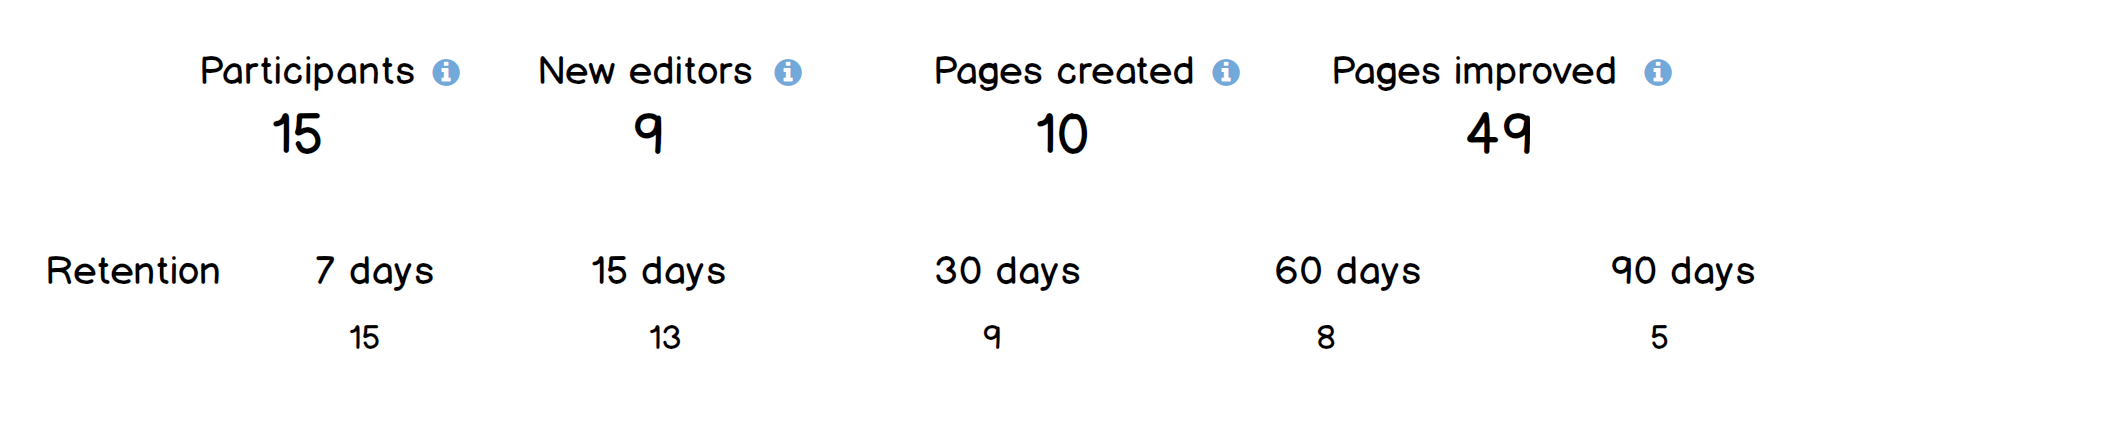
Being able to see retention over 7 days, 30 days, 6 months, a year etc. would be nice.
Technically, I think that this wouldn't be very hard to do. We are already fetching data for all time, we just need to break it down more. But Leon knows way more than me.

Something like -

image.png (1×2 px, 429 KB)

Tooltips to show my thinking.

@MusikAnimal I'm interested in your thoughts on this.

Event Timeline

It's doable, I think!

Do we want the chart to show retention between the dates, or leading up to the those dates? So if Bob is the only participant, and he didn't make an edit between 0 and 29 days, but he did at 30-60 days, we'd keep the value for 7 and 15 days at zero? Or maybe that's too confusing. If we count only leading up to the dates, the chart would only have a flat or downward trend.

As far as coding goes, I don't this would necessarily be hard, but it's a lot of work.

Yeah, I don't think we'd show retention between the dates, that would be confusing. The flat/downward trend makes sense according to the definition of retention being followed right now.

We could skip the chart altogether and compute retention for 7, 15, 30, 60, 90 days, something like -

image.png (424×2 px, 88 KB)

The reason I thought this would be easy is because we can just feed the same function the different numbers and it'd spit out all the data we need? Since we made retention configurable.

The Chart.js part I don't think will be that bad. And actually, the current EventStat model might work for this, since it has a property for the "offset" which represents the number of days since the event ended. Still going to be a fair amount of work, but at least we won't have to make any major database changes.