Page MenuHomePhabricator

Design main single-event data screen
Closed, ResolvedPublic

Description

What are we designing

As a user, I want to get summary information at a glance about my event. There are three pages in the system which share a similar (though not identical) design: The multiple programs, single program and single event screens. The Event screen has the most data of the three, so we'll start with that.

For more details see wiki posts Proposed metrics features—what do you think? and New data and reports in detail.

Design challenges / ideas

  • We should probably move the participant setup and editing functionality to the Event Setup screen. But...
  • We could still present a list of usernames, with links to each user's Talk page, Contributions and Sandbox (if that wiki has sandbox). That way this screen could also become an useful tool during events to help the organizer and helpers monitor contributions.
  • How do the data screens relate to the reporting functions? Are the reports available from the screens, or is there a separate report-setup page users will go through before downloading that will contain the filtering interface for Worklist, Categories, Participants, Wiki and Namespace filters?
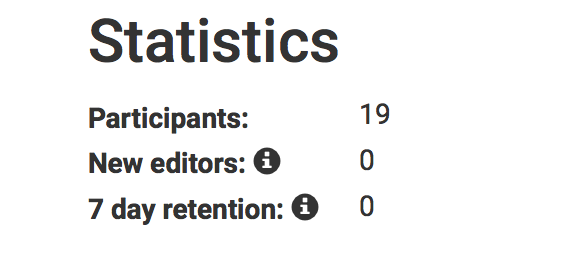
  • Many or most of the metrics listed will require definition information to, for example, explain what is meant by "7-day retention." This information is currently contained in little panels popped by "info" icons, but whether that scales is unclear.
  • The need for info about metrics is complicated by the new filter settings we're adding. For any display of metrics, users will need to know what filters are active. E.g., is that # of pages in all namespaces or just main? Is this # of edits to only the worklist? Etc.
  • It may be useful to divide the metrics into logical groupings, to improve readability. Two main groupings that occur are "Contributions" (pages created, uploads, bytes added, etc.) vs "Impact" (pageviews, mostly, but also # of articles in which images are placed).
  • Remember that some events and programs encompass multiple wikis. It appears to be a design principle now that different wikis are separated out at the Event level @Niharika, can you explain why that was done? And do you think the fact that we are offering a wiki filter will change the need to do that?

Data for the Event Screen

Below is an edited list of Event Screen data, including both data that exists in the system now and data we propose to add. I've broken this list into three parts: "descriptive information" about the event, which will be displayed at page top to identify and describe the event; "event data", which lists the main metrics; and "Participants", which is a re-thinking of the participants list now on this page.

Descriptive event information

  • Event name
  • Wikis involved
  • Start time/date (with timezone)
  • End time/date
  • Length of the event (in days / hours) [Is this needed here?]
  • Date/time of last data update [place near update button]
  • Event type [editathon, content drive, training session, etc.]
  • Event partners [GLAMs etc.]
  • Event venue
  • Location [City/state/province?]
  • Short description

Metrics

  • Most figures are for "# of" unless otherwise specified. E.g., [# of] participants, [# of] pages created, [# of] Commons uploads, etc.
  • I've broken the event data into three categories, which may aid users in understanding the page.

Participants

  • Participants
  • New editors [better as a number or a %?]
  • 7-days retention [better as a number or a %?]
  • Est. % women Users ask that this not be a prominent metric

Contributions

  • Pages created
  • Pages improved
  • Edits
  • Bytes changed
  • Words added
  • Files uploaded
  • Wikidata items created
  • Wikidata claims added

Impact

  • Views to pages created
  • Views to pages improved
  • Views to uploaded files
  • Pages with uploaded files
  • New page survival rate
  • Plays to uploaded audio/video

Design

Screenshot_2018-10-25 Name of Event - Grant Metrics.png (1×1 px, 168 KB)

Browser demo
https://prtksxna.github.io/wmf-prototype-gm/event.html

Code
https://github.com/prtksxna/wmf-prototype-gm

Event Timeline

Remember that some events and programs encompass multiple wikis. It appears to be a design principle now that different wikis are separated out at the Event level @Niharika, can you explain why that was done? And do you think the fact that we are offering a wiki filter will change the need to do that?

There are multiple programs that happen on a global scale - like Wiki Loves Monuments 2018 program may have events like:

  • Wiki Loves Monument 2018 - India which includes Indic wikis
  • Wiki Loves Monument 2018 - North America which includes English wp

etc.
An example I could find was a program like Women in Red may have events like Women in the CEE Countries Online Editathon.

One thing we don't know for sure is that whether the event organization happens in a way that this can work. That is if the core "Women in Red" program organizers are involved in the coordination of local events like "Women in CEE countries online editathon" and would be adding those organizers to the program.

This comment is assuming #event_tools is the same as Grant-Metrics, which I think we've more or less confirmed?

Participants

  • Participant username/link and for each
  • User talk page
  • Contributions

It'd be great to show these now. It would mean doing away with the input boxes for existing usernames, similar to what Sam was proposing at T201710#4497543. The "Categories" form follows the same design, and we have the same issue (need to do away with input boxes) because we want to link to the on-wiki category page so that the organizer can view all subcategories and pages within the categories.

  • Sandbox

"Sandbox" will differ wiki to wiki. I'm not sure how we'd know where to link to?

[My idea in including Contributions and User Talk and Sandbox is that organizers could use this page during the event to monitor activity, to an extent. We could possibly even go further with that idea if we want to... ]

It needs some performance improvements (T201377) but you can use the "revision browser" to monitor event activity. We might offer per-user filtering there, so that we can see the relevant edits only (within configured categories, etc.).

... There are multiple programs that happen on a global scale - like Wiki Loves Monuments 2018 program may have events like:

  • Wiki Loves Monument 2018 - India which includes Indic wikis
  • Wiki Loves Monument 2018 - North America which includes English wp

Thanks for the info but apparently I wasn't clear about what I was asking. Yes, it's clear there are events that encompass multiple wikis. But what isn't obvious is why the Event stats need to be separated by wiki. E.g., # of participants, bytes added, words added, etc.— i think now there are metrics presented on a per-wiki basis. But why not show just one set of sums for all the wikis added together—especially now that we're adding the ability to filter by wiki. (If I'm wrong about how the stats are presented now please tell me.)

We also show sum total across wikis. Look at this example program.

image.png (452×1 px, 54 KB)

It is more useful to show per-wiki breakdowns so organizers can gauge impact across wikis. Like which wikis got a lot of participation and which ones didn't get as much. This was a quite popular feature in our testing with users. Most users asked for more information in addition to this - like being able to see which participants made the most edits or created most articles on each wiki.
There are certain metrics which make more sense across all wikis and we show those on top.

image.png (270×572 px, 27 KB)

This is amazing! I'm awed by your browser prototypes. You've basically done all the frontend coding! ;)

Instead of listing things here I'm going to comment on your todo items on GitHub.

For some of the modules a small non-interactive visualization might be helpful

We do not have backend support for statistics over time, which you probably guessed. This is on the radar for retention (T189917), and if we do this we might as well make it possible to store any stat over time. Anyway, I think it's a great idea, and the static charts look really cool! Just wanted to note this would be a separate large-ish task. Everything else in the designs should be possible to implement as-is.

@Prtksxna, in response to user requests, I added to new data types to the Event Screen.

  • Plays to video and audio uploads
  • Gender breakdown

(I added them to the list in the Description above, for your convenience.)

One thing I overlooked:

% created page survival rate (main namespace only)

This is a fun idea! We can go by participant name to check the archive table along with page, and accurately give a raw survival rate. However we won't be able to limit to specific categories since the deleted pages won't be in the categorymembers table anymore. I would recommend showing a disclaimer ("survival rate represents all pages created by the participants, and not those within the configured categories"), or omit this metric altogether when the event has categories.

@Prtksxna, I went over event data list. It was in fact basically correct. I organized the list the way we've talked about (in categories), to make it easier to understand. Other than that, I made a very few changes in actual content and one or two to nomenclature (use the terminology listed here now). Here are the changes I made:

  • I separated "Venue" (the hall or whatever) from "Location" (city/state/province)
  • I think we can drop "bytes removed" from this report, as it would be ambiguous at best. We'll have to figure out what this means at some point.
  • "Created page survival rate" has been renamed "New page survivial rate" (it will be obvious from the data that it's %)

I also pulled out the info below from the description. I think it does not feel like part of this report, as it has an entirely different purpose I think. We can talk about it and whether it should possibly be a separate page. Add that to your list of issues to solve. :-)

Participants

  • Participant username/link and for each
  • User talk page
  • Sandbox
  • Contributions

[My idea in including Contributions and User Talk and Sandbox is that organizers could use this page during the event to monitor activity, to an extent. We could possibly even go further with that idea if we want to... ]

"Bytes added" is a fairly meaningless figure and I'm not that happy about including it here, but I suppose Wikipedians are used to it so we will.

This number, for the record, is actually "net bytes added," which technically means it could be negative (though that is unlikely for a whole event). We can explain that and a few other things in the gloss that will accompany all the figures. E.g., this doesn't include images or other uploads but does include wikitext code.

In the past we've had a request from a couple users to see bytes added and bytes removed both. The net is probably not that useful. You might want to ask users about this.

jmatazzoni renamed this task from Design main Event Tool data screens to Design main single-event data screen.Sep 25 2018, 8:10 PM
jmatazzoni updated the task description. (Show Details)

In T204009#4616741, @Niharika wrote:

In the past we've had a request from a couple users to see bytes added and bytes removed both. The net is probably not that useful. You might want to ask users about this.

Thanks N. I agree about net bytes being a misleading figure. But @Mooeypoo indicated that net is the figure we actually get (in the API, was it?). It's the figure that is reported on Recent Changes, for example. She suggested that reporting bytes added and bytes removed would be hard.

At this point, we're looking at summary data for the whole event. So maybe it's easier to calculate for that than for some of the breakout reports? What do you guys think? Can we can but added/removed back in?

@MusikAnimal can offer more details here but my impression is that we can know for each edit whether the net byte change was positive or negative, like:

13:18  Fusible alloy‎ (diff | hist) . . (+4)‎ . . John85 (talk | contribs) (→‎Other alloys: link gold)
13:18  Ōsama Game‎ (diff | hist) . . (+374)‎ . . 191.179.124.28 (talk)
13:18  Wikipedia:Requests for adminship/Justlettersandnumbers‎‎ (2 changes | history) . . (+1,638)‎ . . [Justlettersandnumbers‎; HandsomeBoy‎]
13:18  Canadian political blogosphere‎‎ (5 changes | history) . . (-64)‎ . . [John B123‎ (5×)]

So on the whole for an event, it's fairly easy to say how many total bytes were added (4+374+1638 for this example) and total bytes removed (64 for this example). That number is not 100% accurate because that's a net for each edit but it's still a good metric to gauge edit contributions.

Of course, as Moriel pointed out, knowing the actual exact numbers is very challenging.

Yes we can get net added bytes, and optionally only count content added by the participants, within the categories, etc. We do the same such calculations at https://xtools.wmflabs.org/articleinfo. I'm pretty sure we can do it all with one query. Note however this really only tells us attempted added content. So for instance, a participant adds a whole paragraph, but because it's unsourced a patroller removes it immediately. Total added bytes is still useful to know, I think, but it may be misleading.

There is a thing called content persistence (authorship attribition), which can tell us how much content was retained. This is perhaps more useful, but not really feasible to compute on-the-fly. The WikiWho service (what we had in mind for the blame tool) already has done the work for us, but only a handful of Wikipedias are supported, and it probably would be too slow to query for events with hundreds/thousands of pages.

[My idea in including ... Sandbox is that organizers could use this page during the event to monitor activity, to an extent. We could possibly even go further with that idea if we want to... ]

Just wanted to reiterate that I'm not sure how we would know where the sandbox is, outside English Wikipedia. If the organizer needs to monitor activity, they can use the revision browser. We might offer filtering options there too (user, namespace, etc.).

One thing I overlooked:

% created page survival rate (main namespace only)

This is a fun idea! We can go by participant name to check the archive table along with page, and accurately give a raw survival rate. However we won't be able to limit to specific categories since the deleted pages won't be in the categorymembers table anymore. I would recommend showing a disclaimer ("survival rate represents all pages created by the participants, and not those within the configured categories"), or omit this metric altogether when the event has categories.

An interesting point Leon. Thanks. I'll make a note to add that to the spec.

@jmatazzoni, I've updated the mocks after our last conversation. Should we list down the things that are left to be done before we mark this task as complete?

For example — Is the filter dialog/panel design part of this task itself?

In T204009#4596874, @MusikAnimal wrote:

One thing I overlooked:

% created page survival rate (main namespace only)

This is a fun idea! We can go by participant name to check the archive table along with page, and accurately give a raw survival rate. However we won't be able to limit to specific categories since the deleted pages won't be in the categorymembers table anymore. I would recommend showing a disclaimer ("survival rate represents all pages created by the participants, and not those within the configured categories"), or omit this metric altogether when the event has categories.

Leon, we have to know the URLs of the created pages, since we are reporting on that. So if we know those, then why can't we know how many of those remain extant? Can you explain the limitation you're identifying here a little more please? Not in terms of technically why, but in terms of just how you see it playing out for the user. What is and isn't possible, in your view.

@jmatazzoni, I've updated the mocks after our last conversation. Should we list down the things that are left to be done before we mark this task as complete?

For example — Is the filter dialog/panel design part of this task itself?

No, the paanel isn't part of this. But please make the changes from out 10/1 meeting. Thanks.

% created page survival rate (main namespace only)

This is a fun idea! We can go by participant name to check the archive table along with page, and accurately give a raw survival rate. However we won't be able to limit to specific categories since the deleted pages won't be in the categorymembers table anymore. I would recommend showing a disclaimer ("survival rate represents all pages created by the participants, and not those within the configured categories"), or omit this metric altogether when the event has categories.

Leon, we have to know the URLs of the created pages, since we are reporting on that. So if we know those, then why can't we know how many of those remain extant? Can you explain the limitation you're identifying here a little more please? Not in terms of technically why, but in terms of just how you see it playing out for the user. What is and isn't possible, in your view.

The issue is only if the event is configured to be within a category (or categories).

Say, the event starts at 12:00 and it's within Category:Insects. I generate stats for the first time at 12:30. During those 30 minutes, someone created an article in Category:Insects, and it was deleted. If I have the participant name, I can easily see in the archive table that they created a now-deleted article (and I can get the title of article). But I can't tell what categories it was in, because that information lives in the categorymembers table which only stores information about live pages. As far as I know there's no way around this.

jmatazzoni changed the task status from Open to Stalled.Oct 9 2018, 7:09 PM
Prtksxna updated the task description. (Show Details)
Prtksxna subscribed.