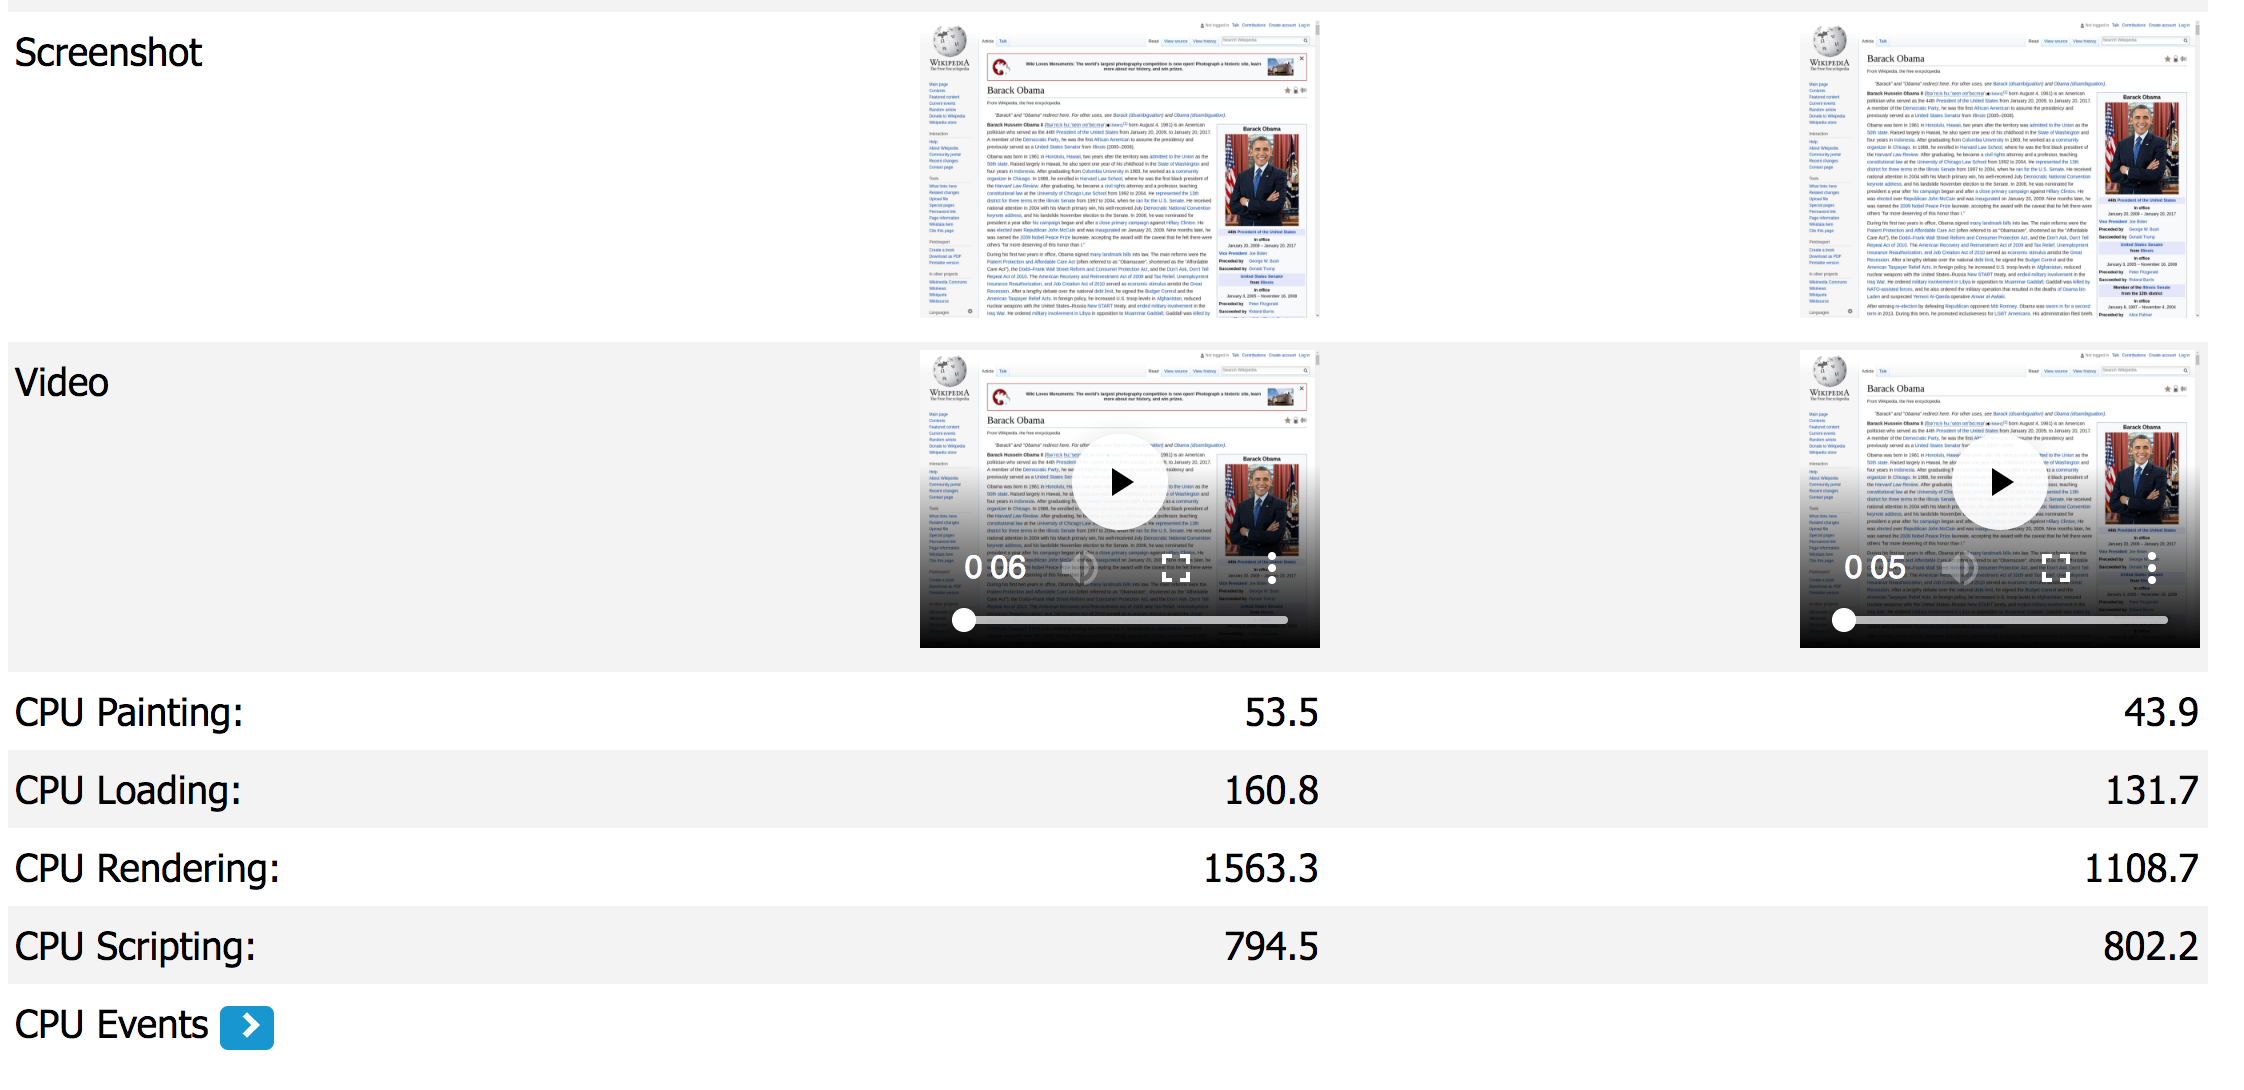
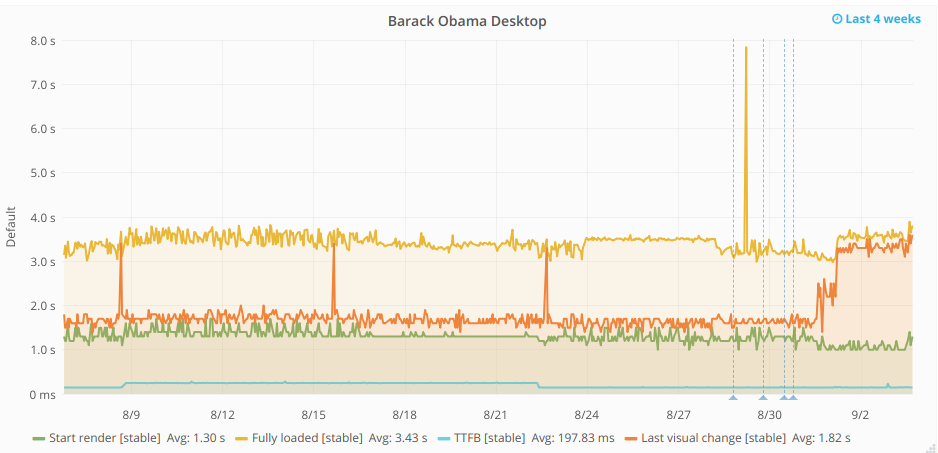
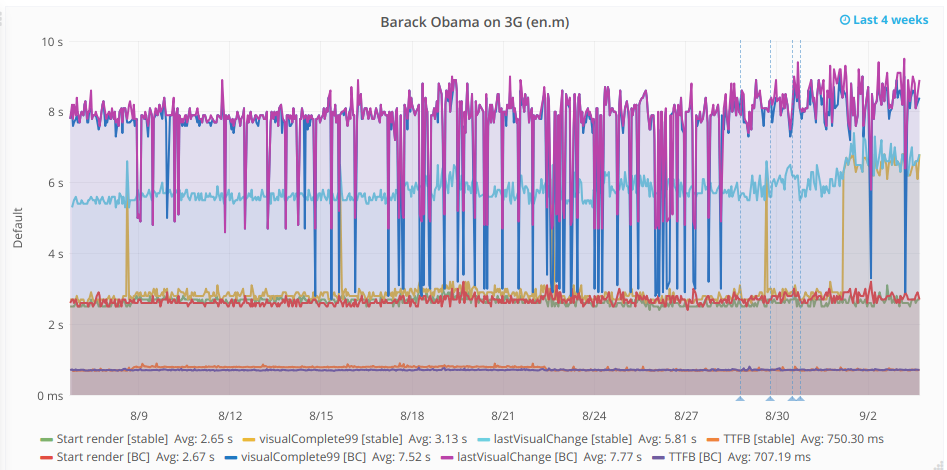
The LastVisualChange for Barrack Obama on desktop increased (for desktop it doubled) on August 31/September 1st. For 3G connection lastVisualChange jumped from 6s to ~7s and for the desktop graph jumped from ~1.6s to ~3.2s
Also, SpeedIndexes3G increased, both for Barrack Obama and Facebook articles.
There was a small jump for JS shipped to the browser (4kb more on September 1st) - this matches the change in SpeedIndexes3G graph, but the Last Visual Change graph started to raise day before (on August 31).
Graphs: https://grafana.wikimedia.org/dashboard/db/mobile-2g?orgId=1

This happened on Friday/Saturday, most probably it's not related to the deployment (maybe because of cache we didn't see any spikes during deployment windows). Any way we can work out what caused this?