Page MenuHomePhabricator

Conduct basic load-test experiments for RESTRouter in k8s
Closed, ResolvedPublic0 Estimated Story Points

Description

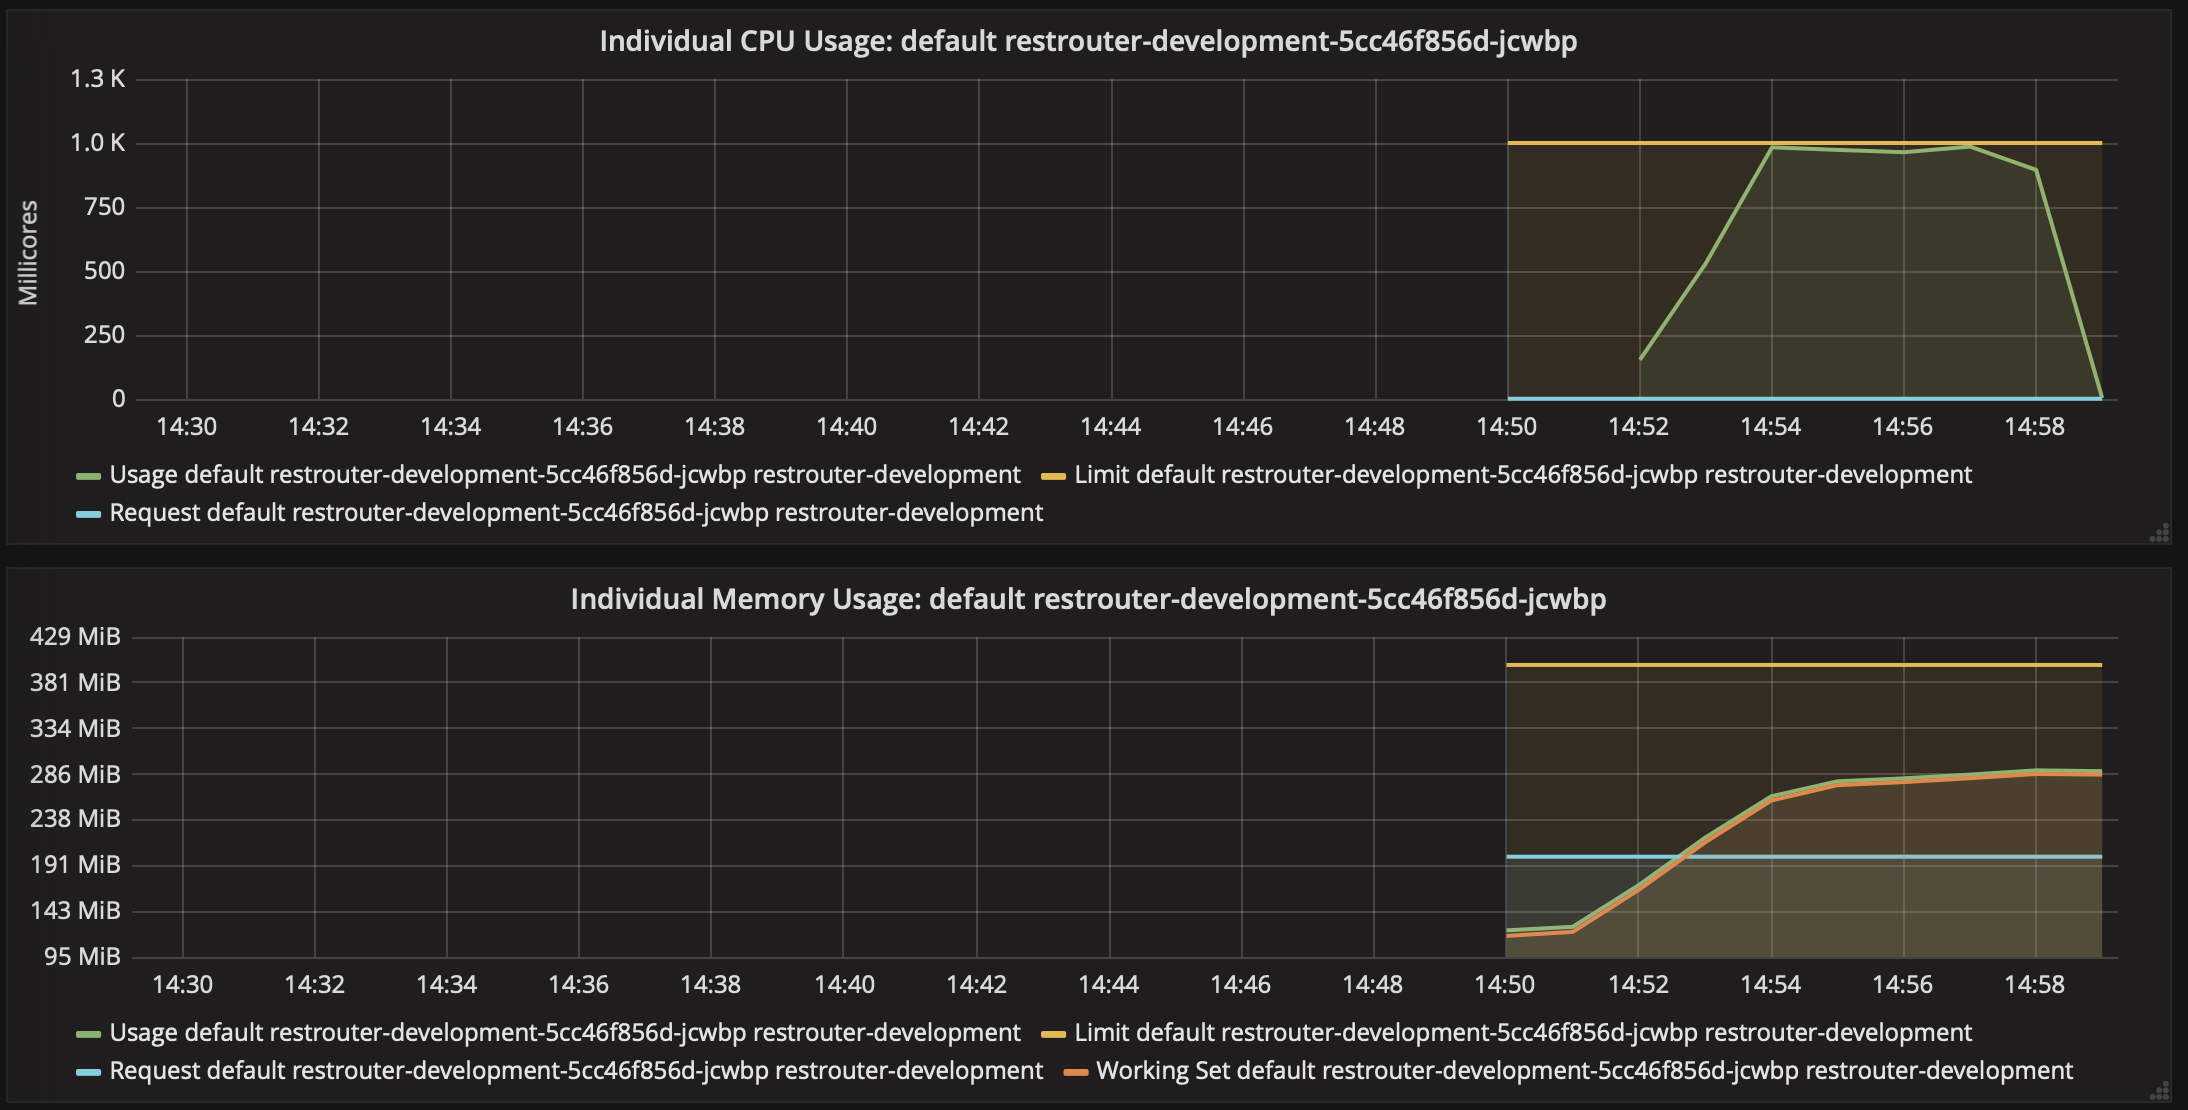
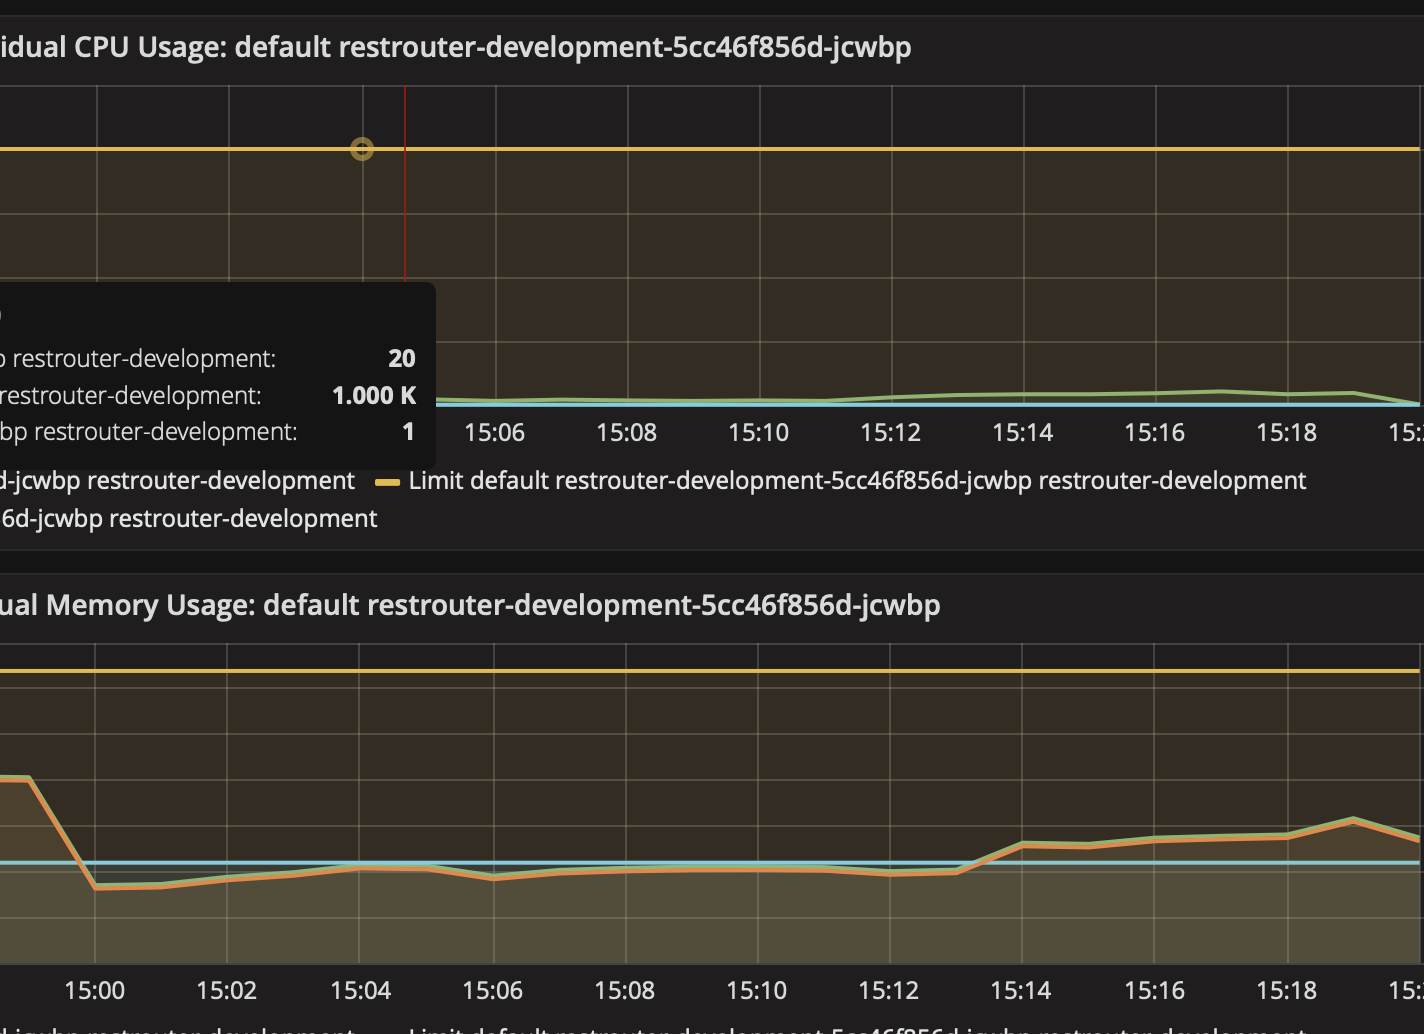
Before we can start the deployment of RESTRouter, we need to determine the CPU and memory constraints to impose on each instance pod. This can be done by using the image that gets build as part of the pipeline job (cf. T226536) and the initial Helm chart locally in minikube. To have a proper set-up to conduct the experiments, see the benchmark wiki page as well as the P8425 script.

Because RESTRouter contacts a considerable amount of back-end services, the challenge here is to have a realistic experiment set up. To do that, I propose to set the local RESTRouter instance in such a way as to issue requests to back-end services located in Beta. This will give us a pathological worst-case scenario when it comes to memory pressure. However, an open question is whether the back-end RESTBase service in Beta should be also used. If so, then it would need to be modified (locally, in-place) to allow external requests to reach the /{domain}/v1/key_value/ hierarchy for the duration of the experiments. Alternatively, a local RESTBase back-end instance can be used for this purpose.

Once the experiments gave us some data, we should incorporate the findings into the Helm chart}(https://gerrit.wikimedia.org/r/#/c/operations/deployment-charts/+/512923/) by adjusting the resources needed for [requests and the respective pod limits.

Event Timeline

mobrovac created this task.

I think that for RESTBase simply going through all the endpoints is a wrong approach. We need to test up different behaviours/codepaths of RESTRouter, not the same exact codepath with different data. So, instead I'm going to go through the following behaviours:

  1. Fetching HTML and Summary from storage - the most common codepath
  2. Fetching HTML and Summary from storage with no-cache - most common update codepath
  3. Fetching math formulae - very common read path
  4. Fetching PDF - extra long backend response time
  5. Fetching HTML and Summary with non-standard language variant - multi-step codepath with many backend services contacted
  6. Fetching some PCS content - simple proxy with no storage and reasonably quick backend response time
  7. Transform endpoint

I believe that these tests should be more than enough to figure out the initial limits. We can adjust as we go.

Fetching HTML from storage. C1-30, n1000

Screen Shot 2019-07-08 at 2.38.03 PM.png (1×1 px, 265 KB)

Fetching summary from storage, C1-30, n1000

Screen Shot 2019-07-08 at 2.59.40 PM.png (1×2 px, 269 KB)

Fetching HTML with no-cache, C1-5-30, n100

Screen Shot 2019-07-08 at 3.20.47 PM.png (1×1 px, 162 KB)

Fetching summary with no-cache, C1-5-30, n500

Screen Shot 2019-07-08 at 3.28.16 PM.png (972×298 px, 34 KB)

These suggest quite a strong and obvious pattern, the more we wait for backends to generate the content, the less memory/cpu we require.

These also agree quite well with what we're seeing in production with the real traffic. I will continue the experiments, but I think that 1CPU per worker and 750M per worker should be reasonable limits, to begin with judging from what production sees.

After more load testing here's the numbers I propose with explanation:

num_workers: 2

Starting up RESTRouter takes time. Quite a long time. So, we want to lower the probability of having a dangling master, thus 2 workers.

requests.cpu=1600m

According to load testing, we have 2 fundamentally different kinds of requests - those that hit storage and those that just proxy to backend services and both have completely different CPU requirements. When we serve requests from storage, we can max out CPU (1 CPU per worker) given appropriate , while requests that are just a proxy use hardly any CPU since we're mostly waiting for IO. In production 80% of requests are served from storage, thus if we had a minimum viable number of pods (having 0 capacity over) we would've run under 80% CPU. The hard limit on possible CPU per pod is 2000m since node is single-threaded and we have 2 workers per pod. Thus, 2000*0.8=1600

requests.memory=800Mi

Currently in production the mean memory consumption is 400Mi per worker. Thus 2 workers per pod = 800Mi

limits.cpu=2

The hard limit for CPU consumption of a node worker is 1, thus 2 workers = 2.

limits.memory=1500Mi

service-runner kills RESTBase worker when 700Mi is per worker is reached. We're running 2 workers, plus a little room for master.

Pchelolo claimed this task.

I did a bunch more experiments with various different endpoints from T226538#5314652 and as I thought the results are pretty much the same. I think there's no longer any value in doing even more endpoints. Let's try going with the numbers from T226538#5318448