Page MenuHomePhabricator

Logstash down for MediaWiki
Closed, ResolvedPublic

Description

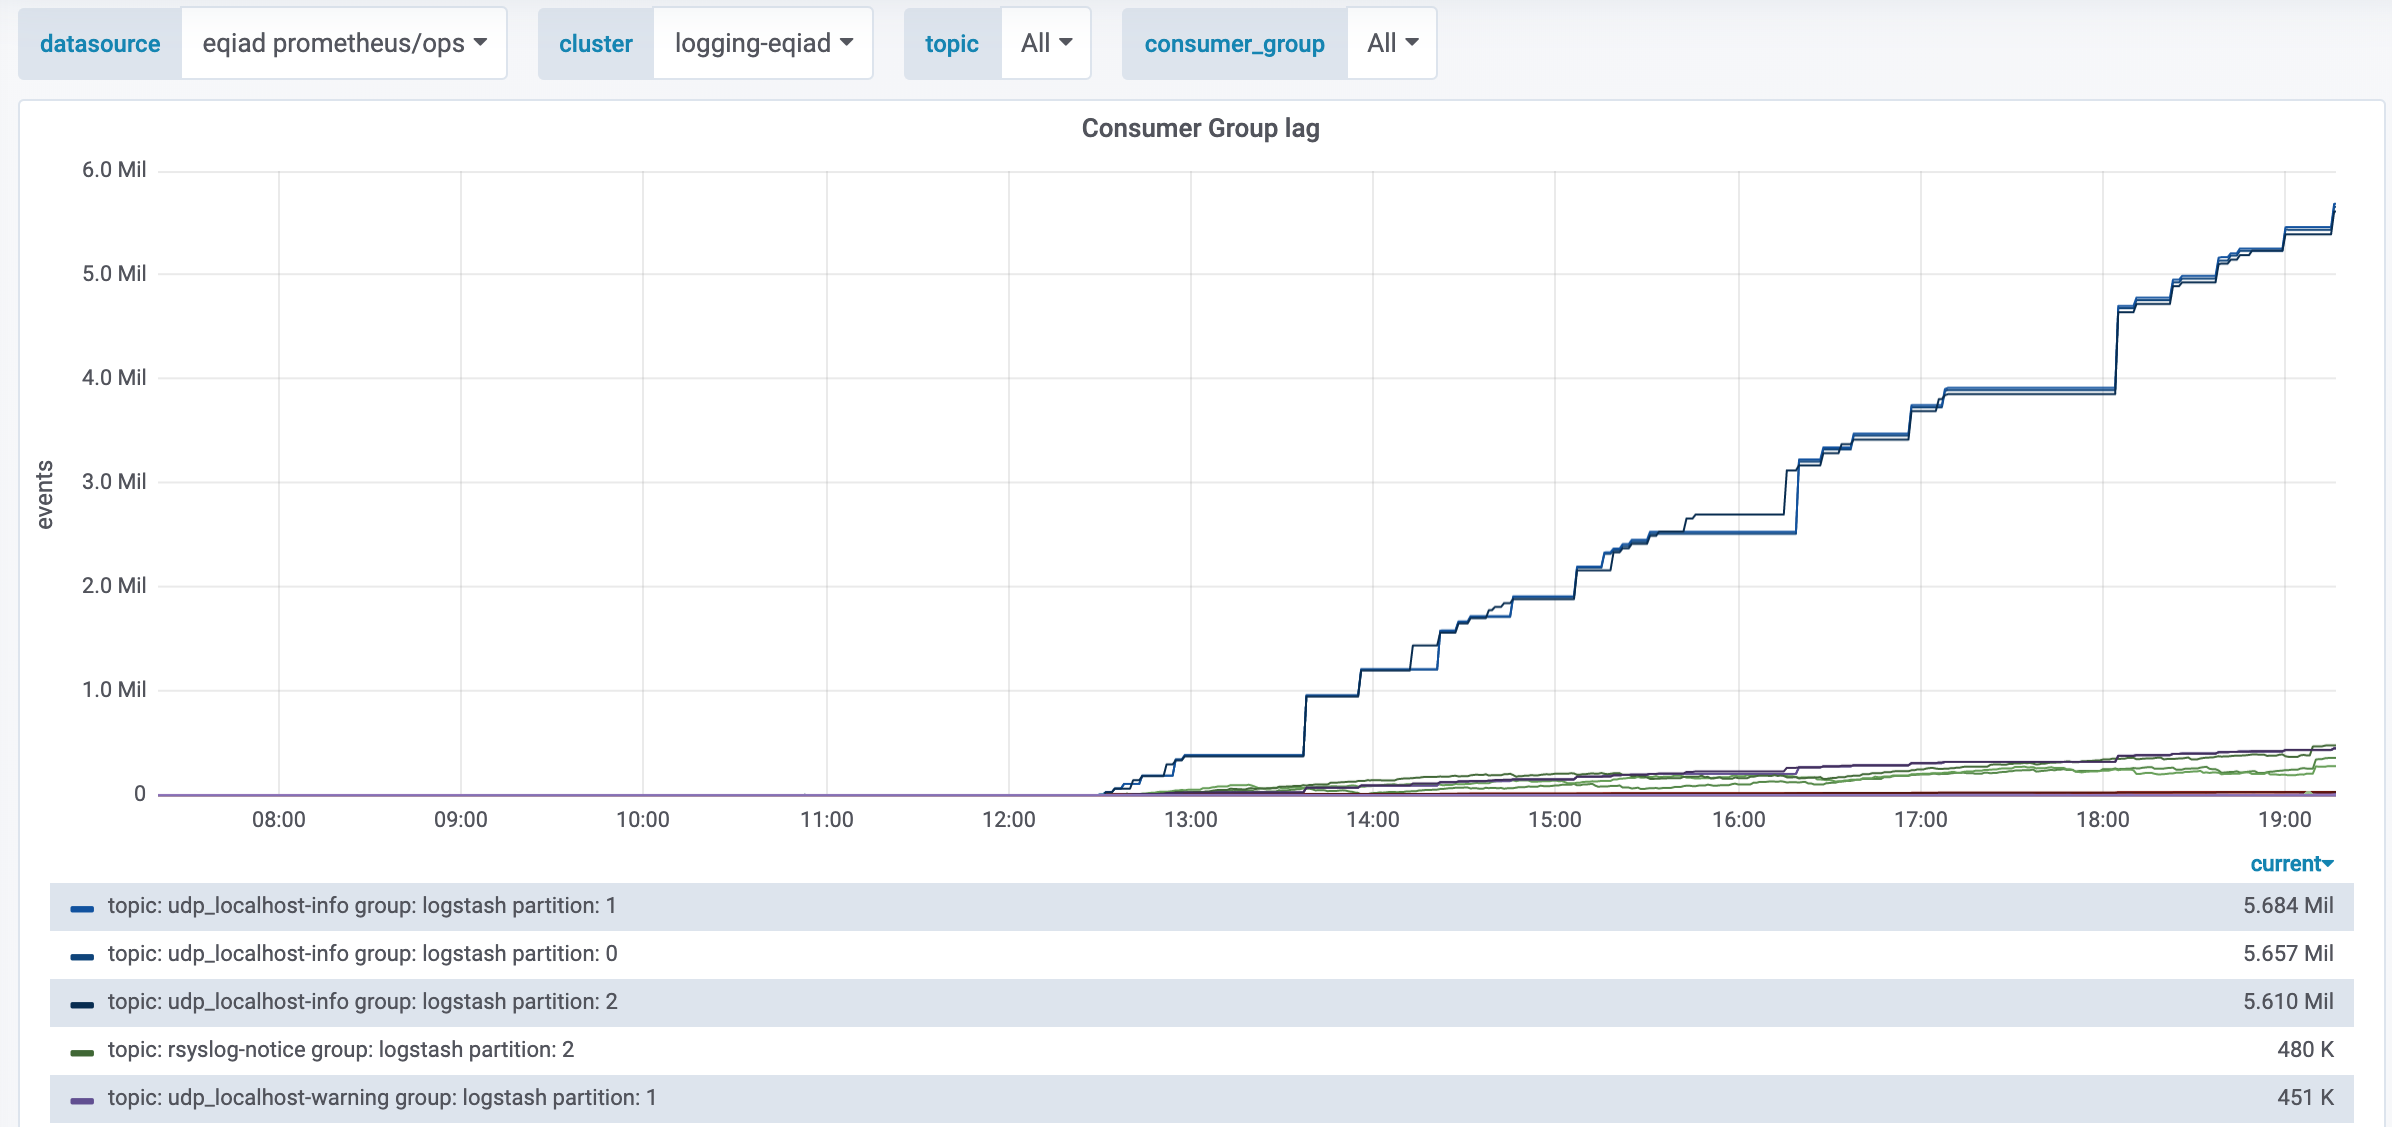
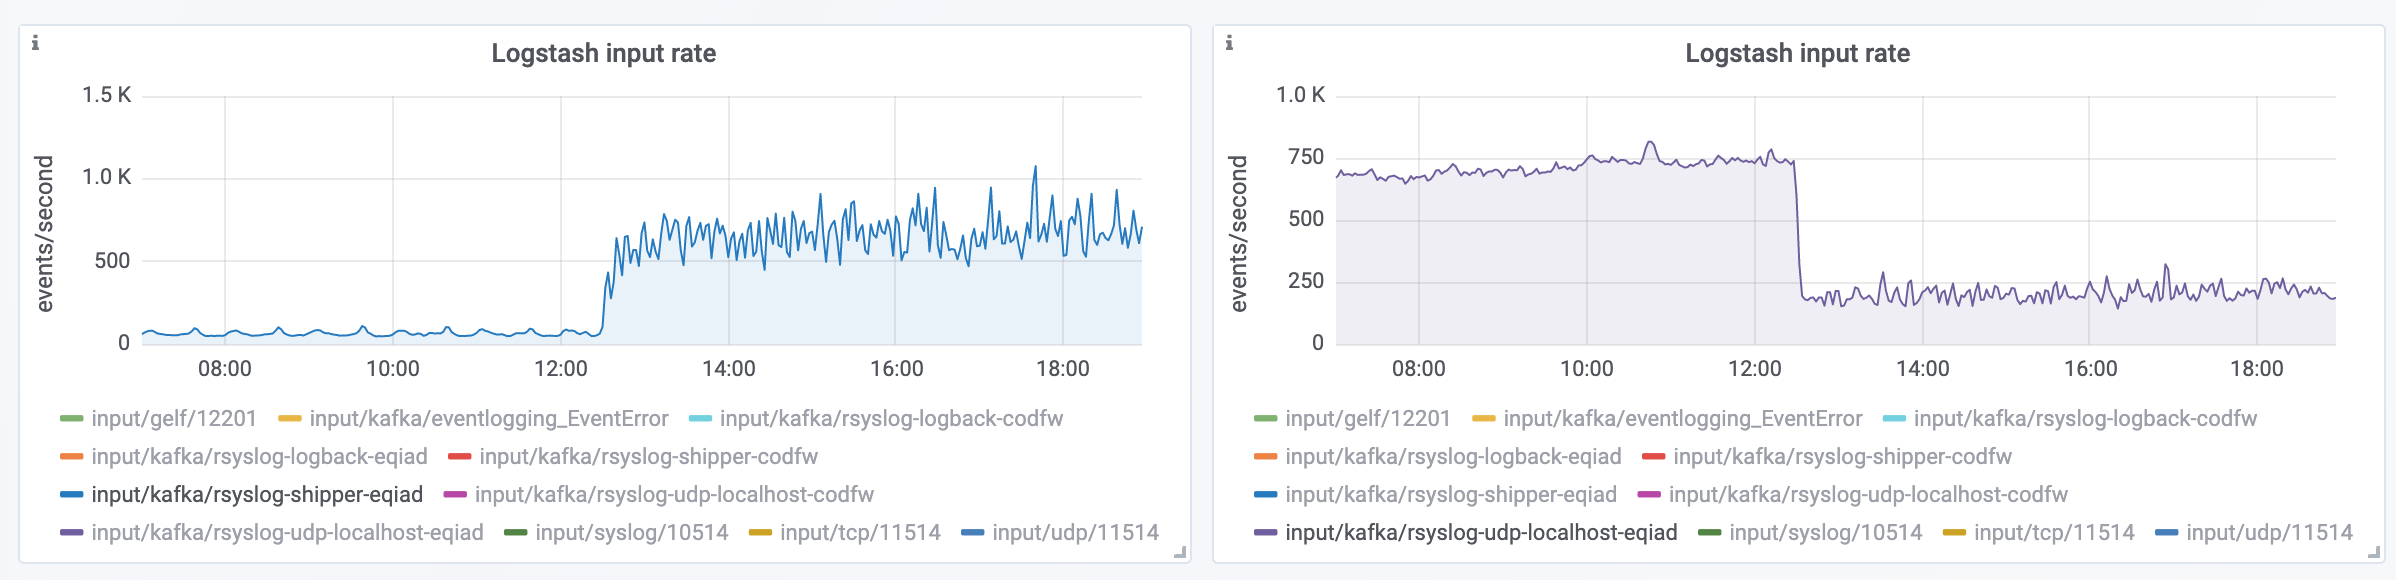
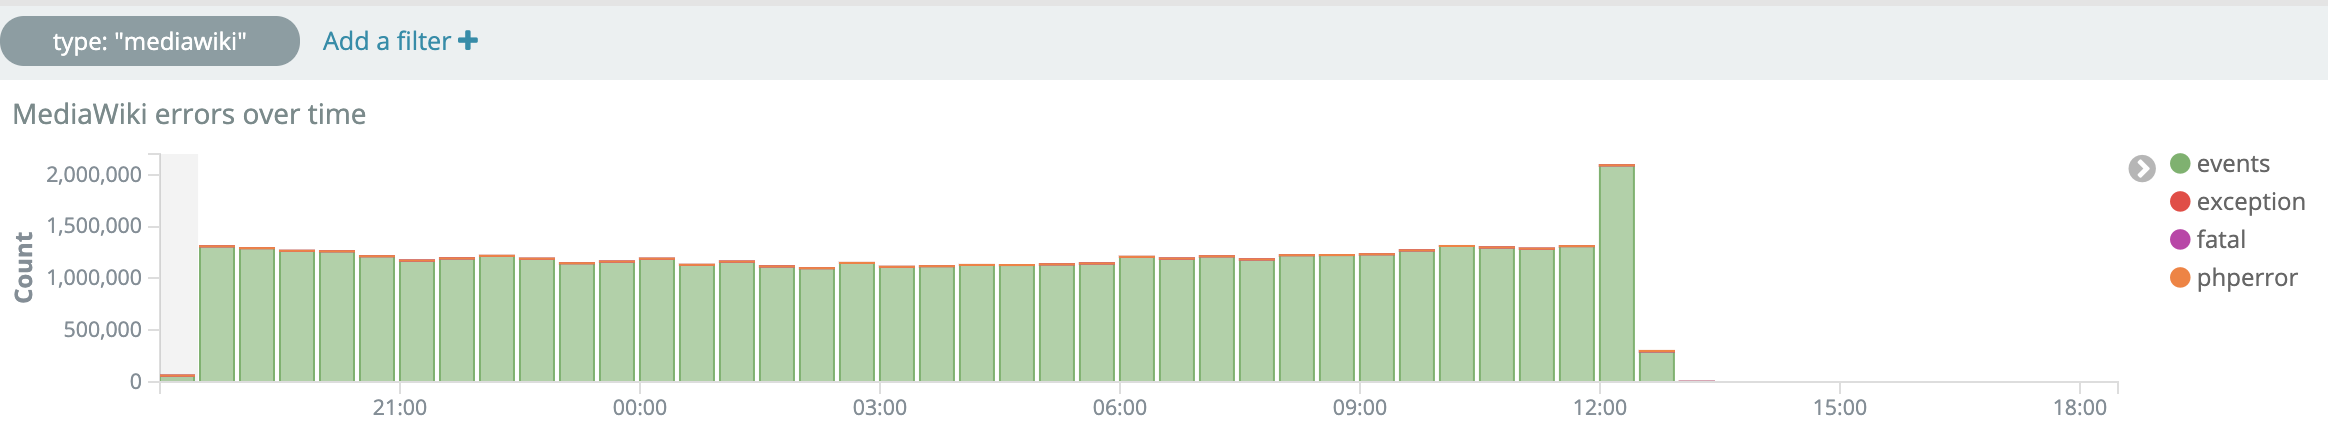
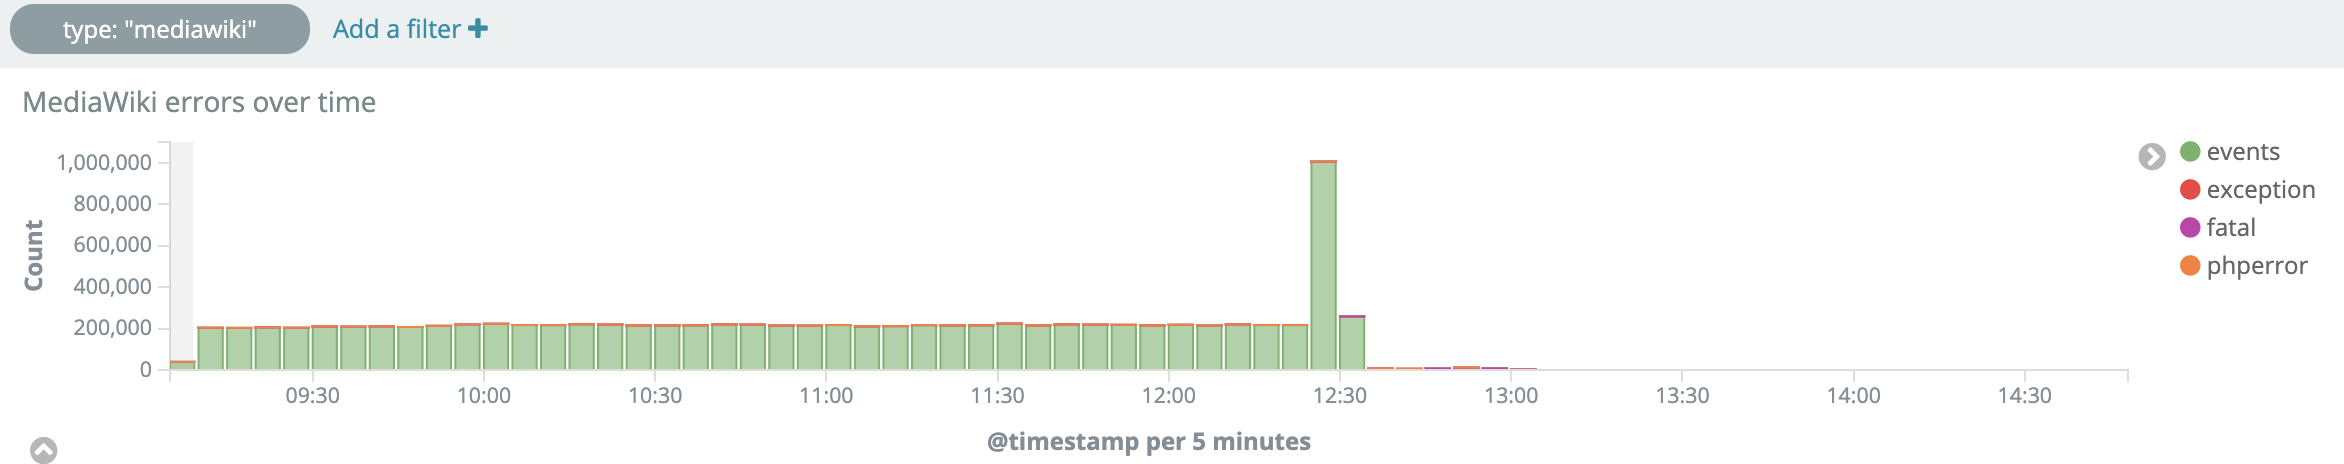
Around 12:30 UTC today, Logstash stopped accepting messages from MediaWiki.

From https://logstash.wikimedia.org/app/kibana#/dashboard/mediawiki-errors

Screenshot 2019-07-15 at 19.30.04.png (442×2 px, 87 KB)

Screenshot 2019-07-15 at 19.30.51.png (464×2 px, 93 KB)

Impact
  • Blocks MediaWiki deployments, as Scap checks Logstash during the canary phase.
  • Workflow for verifying changes from mwdebug1002 servers false-positively suggests there are no problems. (which unlike the main dashboard, does not appear suspicious because most requests produce no errors and these servers receive no other traffic, so no errors is the default).
  • Engineering teams working on MediaWiki have no visibility into operational problems from the PHP core.

Event Timeline

Krinkle triaged this task as Unbreak Now! priority.Jul 15 2019, 6:33 PM

@jcrespo said on #wikimedia-operations "<jynus> robh: see eqsin mails" when talking about this issue, see P8748.

I never talked about this issue, and had not idea why @Urbanecm thoughout I was talking about this while I was having a private conversation with other person.

I'm sorry, I thought so because said conversation directly followed the report from @Daimona.

Huh, when I first reported I thought someone already knew about this. Anyway. Looking at this I see there has been a spike around 12:20-30, which is right before data stopped to flow. It's also interesting to note that, apparently, there hasn't been any drop in the amount of data, which was in fact replaced by these errors. So something is wrong with Elastic (?).

@jcrespo said on #wikimedia-operations "<jynus> robh: see eqsin mails" when talking about this issue, see P8748.

I never talked about this issue, and had not idea why @Urbanecm thoughout I was talking about this while I was having a private conversation with other person.

I'm sorry, I thought so because said conversation directly followed the report from @Daimona.

For the record, @jcrespo was replying to RobH about an unrelated topic in response to messages from the wikibugs and icinga-wm bots.

Meanwhile, back on topic. Some graphs that have been mentioned in the IRC conversation about this.

Dashboard: kafka-consumer-lag

capture.png (1×2 px, 130 KB)

Messages appear to be arriving fine into the Kafka layer, but not consumed properly (by Logstash/Elasticsarch?).


Dashboard: logstash

capture.png (580×2 px, 102 KB)

There seems strong correlation with two Logstash message sources gaining and losing traffic respectively. Source input/kafka/rsyslog-shipper-eqiad grew by 10X, and input/kafka/rsyslog-udp-localhost-eqiad shrunk by about 3X.

We decided to drop logs from cpjobqueue and changeprop at the logstash layer with the following config:

89-filter_drop_cpjobque_changeprop.conf:

filter {
  if [type] == "cpjobqueue" {
    drop {}
  }
  if [type] == "changeprop" {
    drop {}
  }
  if [_type] == "cpjobqueue" {
    drop {}
  }
  if [_type] == "changeprop" {
    drop {}
  }
}

Once the backlog is processed, https://grafana.wikimedia.org/d/000000102/production-logging?refresh=5m&panelId=8&fullscreen&orgId=1 This can be lowered to high, but something should be put in place to prevent another logs outage, even if it is a rough way, such as an alert to identify it and a runbook to drop a source of logs like above.

CDanis claimed this task.

The backlog in Kafka should clear in just a few more minutes. Closing this; separate issues to be opened later for followup work.

Mentioned in SAL (#wikimedia-operations) [2019-07-16T00:03:42Z] <shdubsh> restart logstash to revert mitigations - T228089