Page MenuHomePhabricator

Optimize talk endpoint performance
Closed, ResolvedPublic

Description

  • Run benchmarks and profiling to determine slowest areas
  • Attempt to optimize those areas without adjusting spec/schema
  • If nothing is promising, propose spec changes that would allow for faster generation of talk pages (keep attributes in html tags, keep more tags, etc).

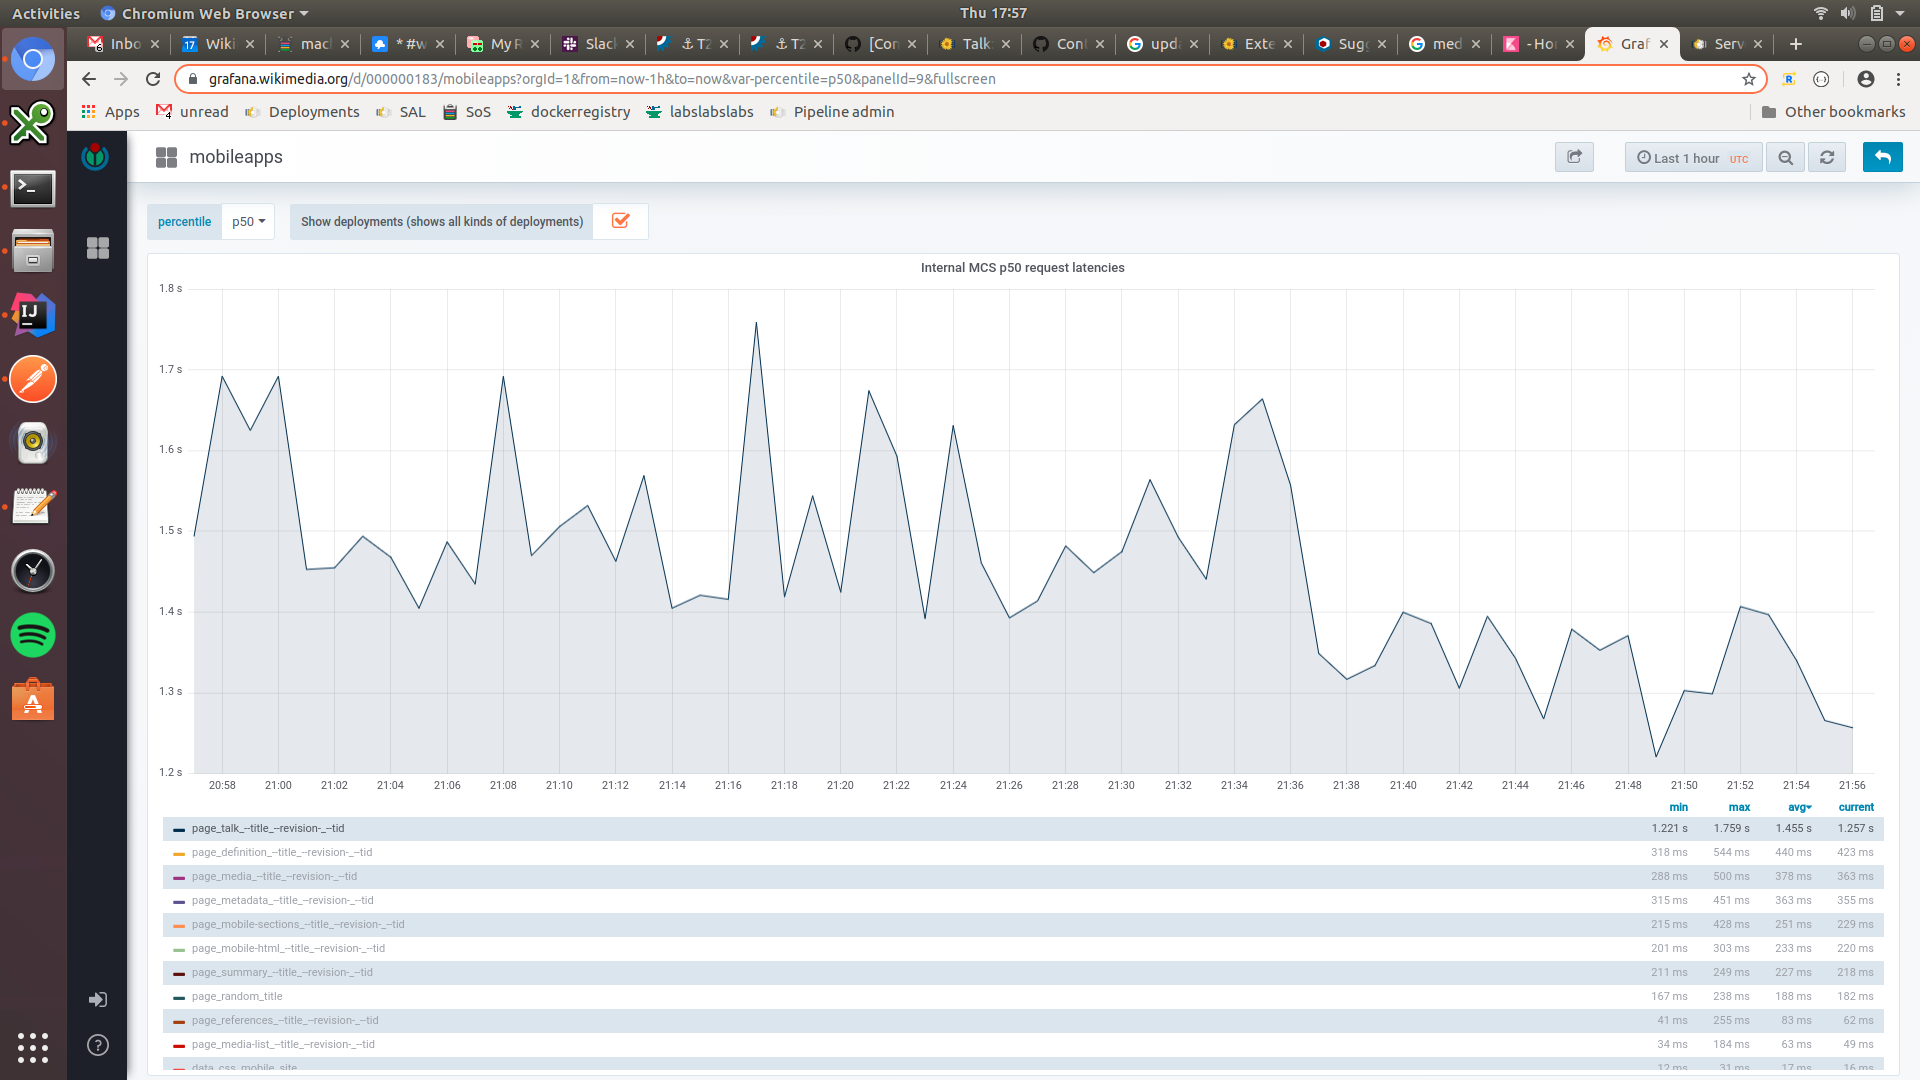
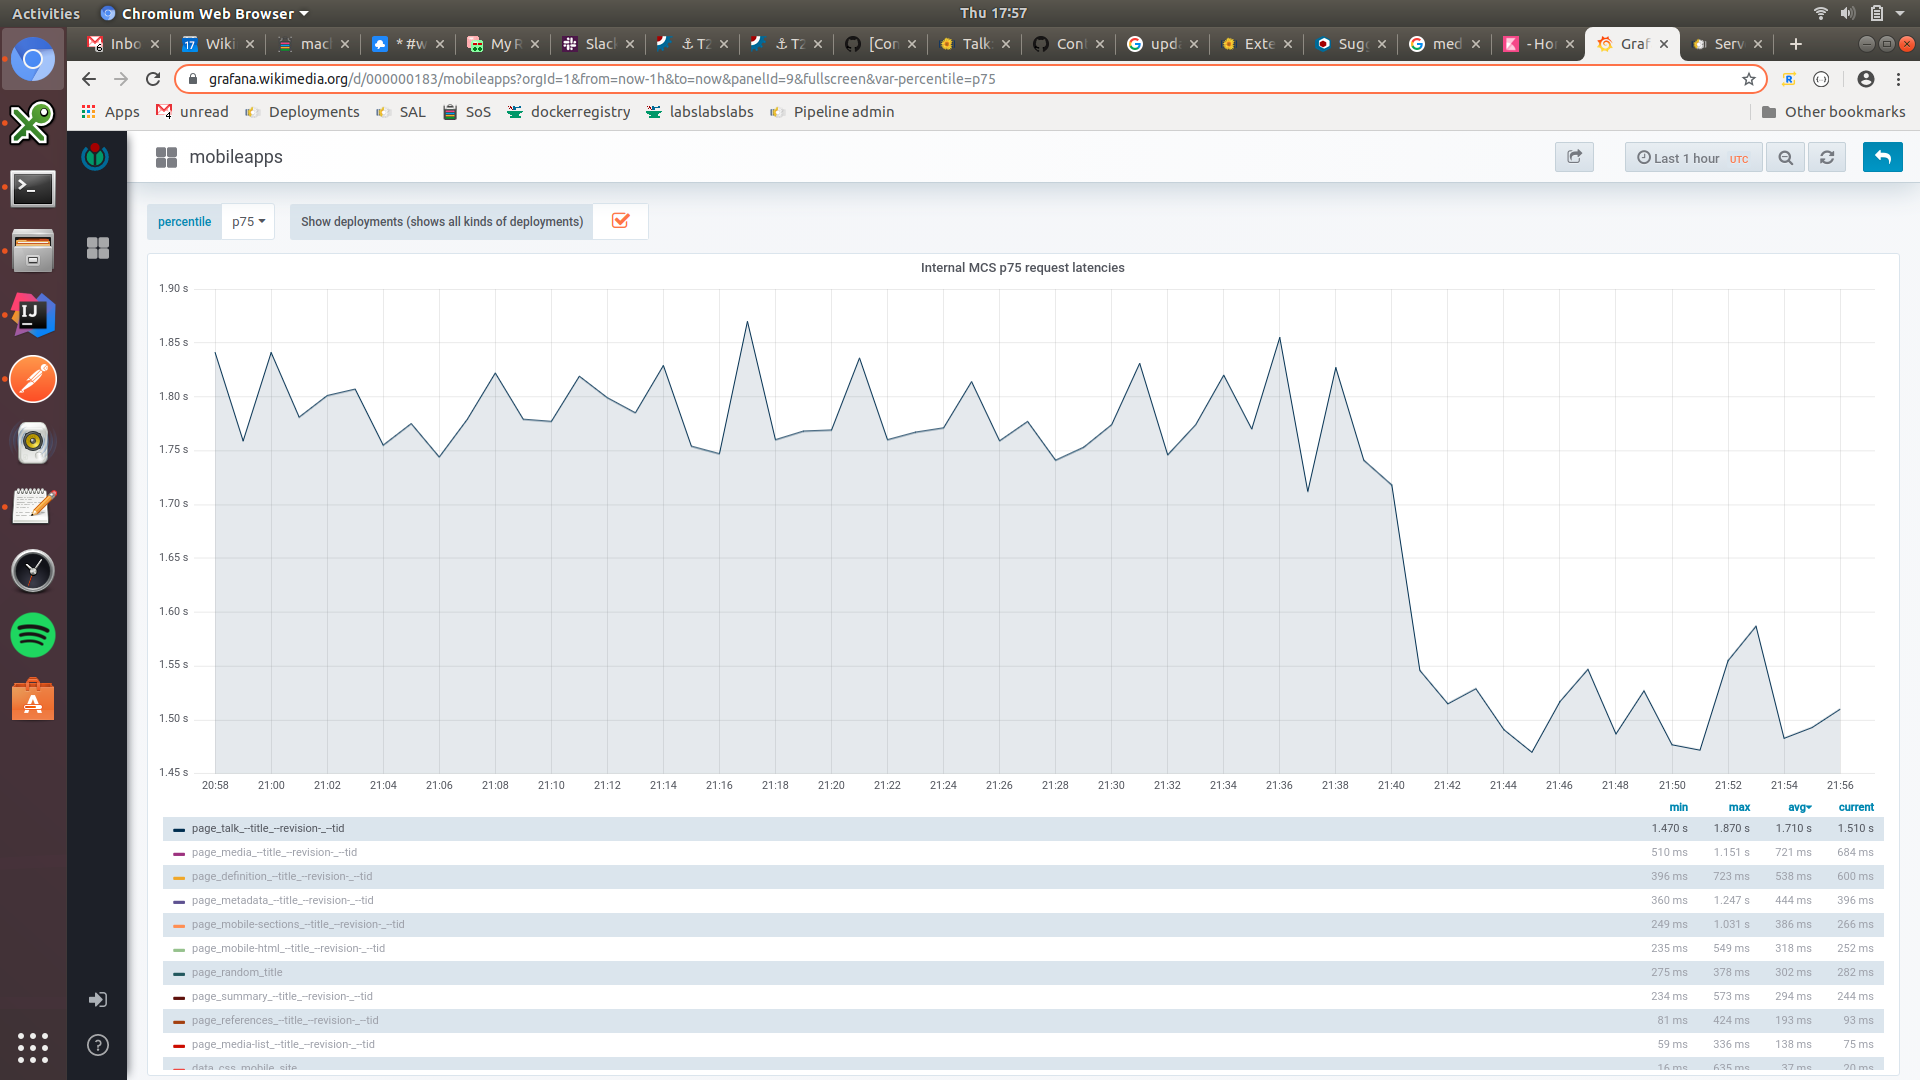
Target an 80% or greater reduction in the time it takes to generate a talk page to result in 75th percentile performance on the server of 200-300ms or better

https://grafana.wikimedia.org/d/000000183/mobileapps?orgId=1&from=now-24h&to=now&panelId=9&fullscreen&var-percentile=p75

Event Timeline

Here's my WIP:

https://github.com/wikimedia/mediawiki-services-mobileapps/compare/master...montehurd:talk-speed-squashed

Speedup so far is (very) roughly 10%.

Making further tweaks now - looking at Array.from calls and other places which may also coerce linked lists into arrays...

Edit: I'm going to digest the profiling info mentioned in the comment below before proceeding further. I think I'll be able to more easily/effectively target the worst performance offenders vs. my previous manual benchmarking.

I took some time today to understand more about node's built-in profiling abilities.

I was able to use these built-in bits by digesting the details found in this article:

https://nodejs.org/en/docs/guides/simple-profiling/


To get this working for mediawiki-services-mobileapps I had to follow these steps:

In console, start the server configured for profiling:

NODE_ENV=production node --prof server.js

^ the hardest part was discovering I had to start via server.js vs the usual npm start for this to work. The isolate log file mentioned below was never appearing until I stumbled onto this 😂.

Then in another console window run this once to warm-start the endpoint:

curl -X GET "http://127.0.0.1:6927/en.wikipedia.org/v1/page/talk/User_talk:Brion_VIBBER/895522398"

Then put load on the server via ApacheBench - you can change the two 10s as needed - see ab's help:

ab -k -c 10 -n 10 "http://127.0.0.1:6927/en.wikipedia.org/v1/page/talk/User_talk:Brion_VIBBER/895522398"

Then find the name of the isolate log file which was created in mediawiki-services-mobileapps folder. Will look something like:

isolate-0x1024d2000-v8.log

Then use that file name and run this command to create a human readable processed.txt file which will contain our profiling/benchmarking info for the code which ran when we put load on the server in the previous step:

node --prof-process isolate-0x1024d2000-v8.log > processed.txt

Then open processed.txt and read the guide https://nodejs.org/en/docs/guides/simple-profiling/ to know how to interpret it. The article explains it in great detail.


^ @Mholloway @bearND not sure if you guys have played with this, but it's looking *super* promising for getting really detailed information about which method calls are taking a long time for any of the mediawiki-services-mobileapps routes!

JMinor triaged this task as Medium priority.Oct 15 2019, 6:11 PM

Reminder steps for using mediawiki-services-mobileapps with Chrome breakpoints & inspection:

https://medium.com/@ukrbublik/optimizing-node-js-app-case-from-the-trenches-1f2560604165

Terminal command to start mediawiki-services-mobileapps:

node --inspect-brk server.js

Then in Chrome use this URL:

chrome://inspect/#devices

Then under Remote target tap inspect, then can tap the play button to resume script execution.

Once the Chrome node dev tool loads tap Add folder to workspace and add the mediawiki-services-mobileapps folder.

After breakpoint is set can hit the endpoint again to trigger it and inspect.

Can also tap Profiler to record (then hit the endpoint a few times to accumulate performance data).

^ Patch which improves performance around 17% - details on the patch link.

Hopefully this buys us some time. I'd love to do a deeper re-write using the more performant declarative yaml pipeline if/when some more time becomes available :)

The patch is deployed and made a good dent, though there's still some way to go.

p50 latencies are now peaking around 1.4 s, whereas before they were hitting 1.75 s:

Screenshot from 2019-10-17 17-57-12.png (1×1 px, 280 KB)

The effect is more apparent still at p75:

Screenshot from 2019-10-17 17-57-23.png (1×1 px, 272 KB)

Mentioned in SAL (#wikimedia-operations) [2019-10-22T17:51:46Z] <mholloway-shell@deploy1001> Started deploy [mobileapps/deploy@b4c484a]: Build structured talk pages by walking the DOM (T235213)

Mentioned in SAL (#wikimedia-operations) [2019-10-22T17:57:00Z] <mholloway-shell@deploy1001> Finished deploy [mobileapps/deploy@b4c484a]: Build structured talk pages by walking the DOM (T235213) (duration: 05m 14s)