Page MenuHomePhabricator

Android Editor Retention stats by task - manual and automated - title descriptions vs image captions
Closed, ResolvedPublic

Description

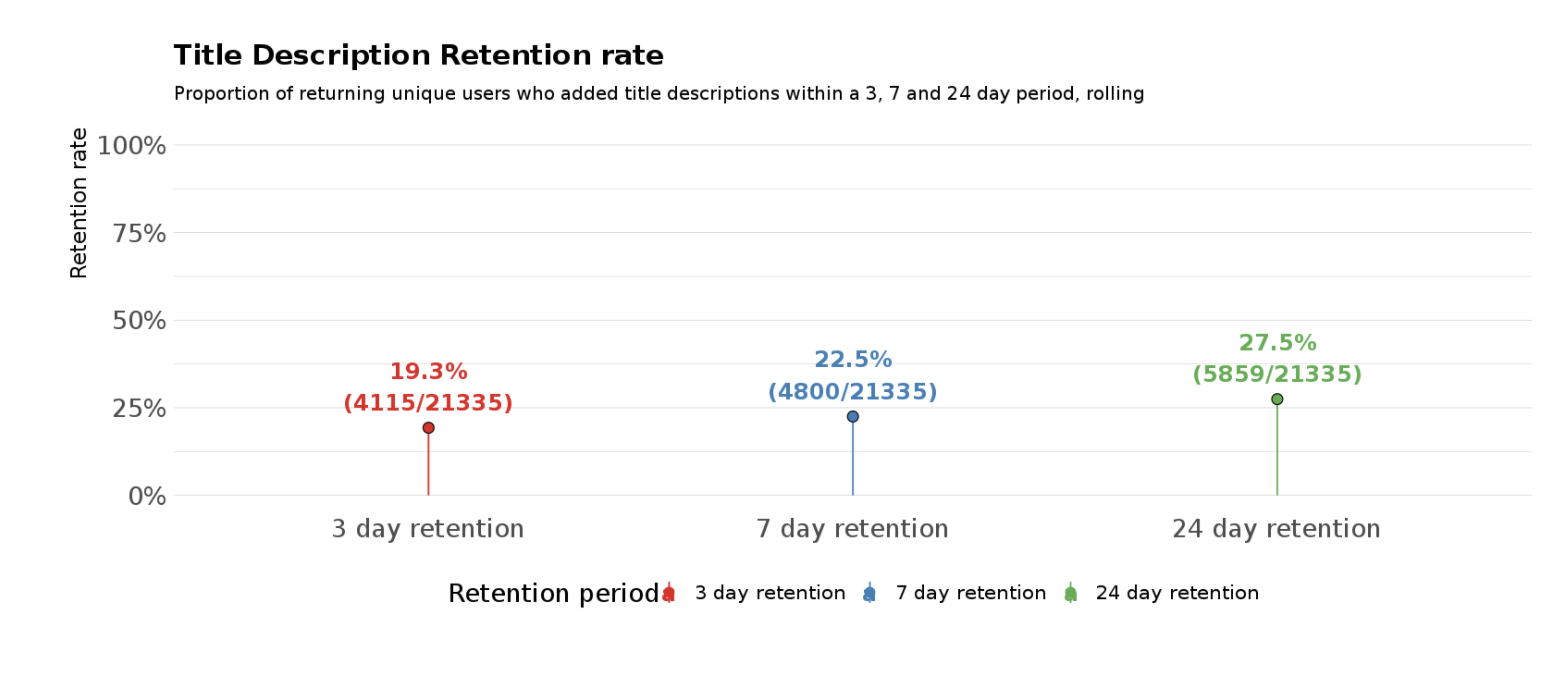
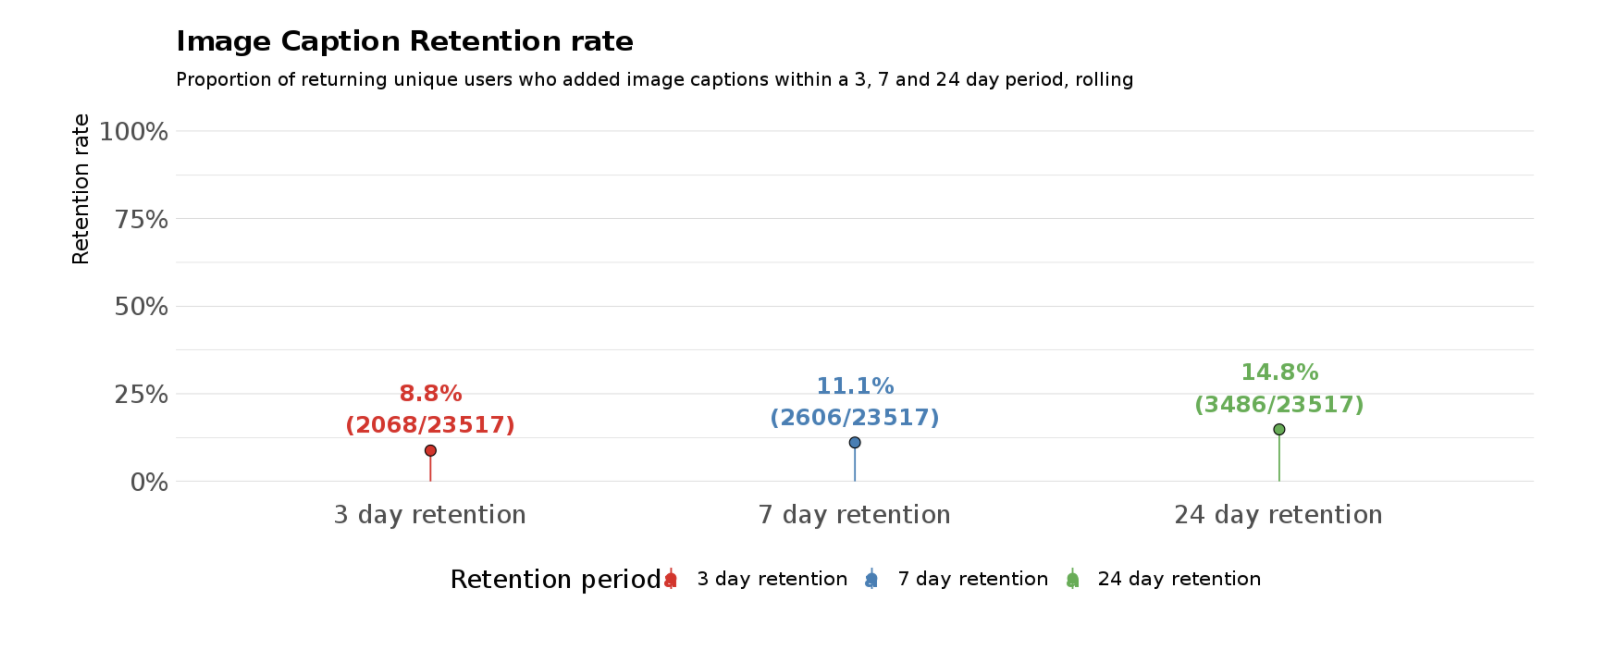
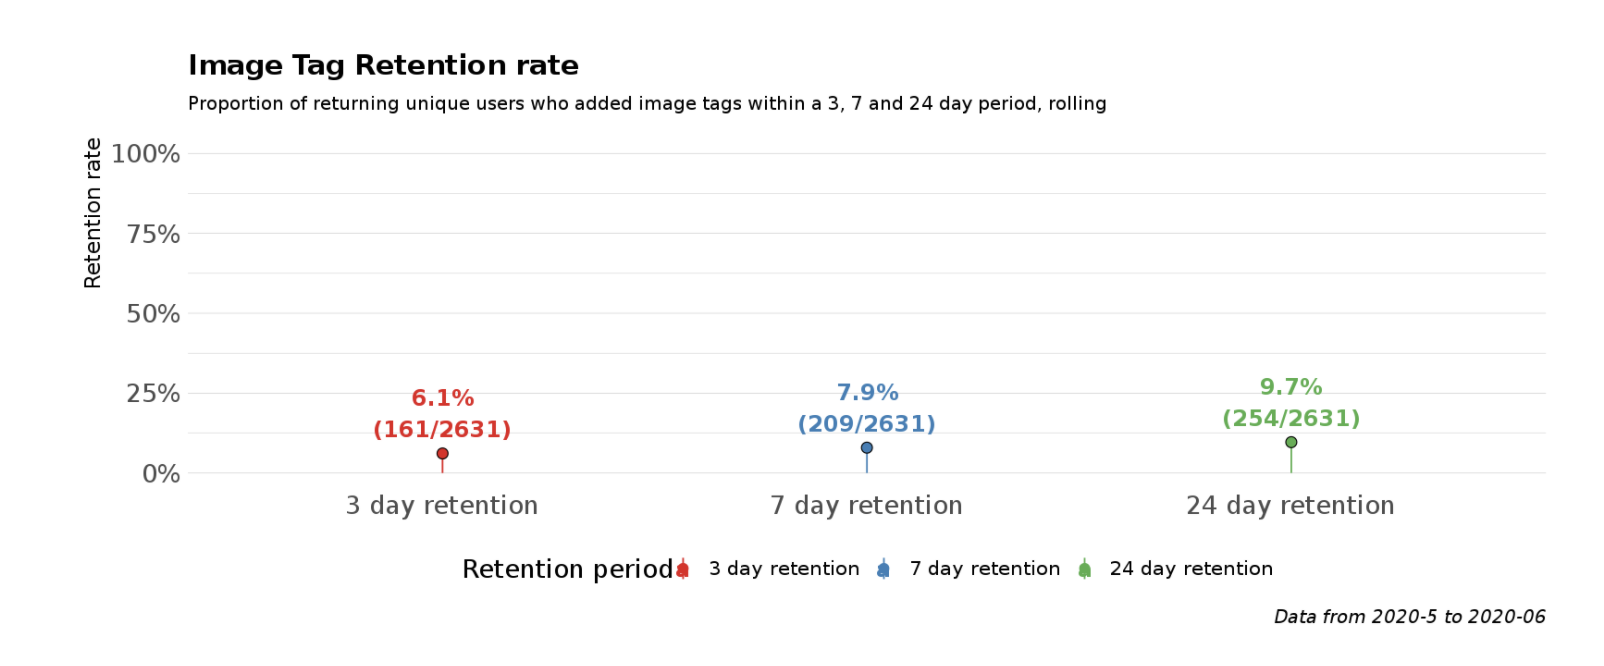
Measure user retention by title descriptions vs image captions vs image tags

so someone adds 1 title description. what % of people come back to add another within x days
or someone adds 1 image caption - what % of them come back to add another image caption
ditto image tags

I have access to the data to do something like that manually but I don't know about having an ongoing metric until I look at where that retention data is stored. Parent report I'm working on now will have insights on repeat users but not by task, once I set that up I can add that dimension and do it again

Event Timeline

SNowick_WMF renamed this task from Retention stats by task - manual and automated to Android Editor Retention stats by task - manual and automated - title descriptions vs image captions.Mar 2 2020, 5:48 PM
LGoto triaged this task as Medium priority.Mar 2 2020, 5:48 PM
LGoto moved this task from Next 2 weeks to Blocked on the Product-Analytics (Kanban) board.

Ticket will stay open until implemented. Pending dev cycle.

Need to verify that data is there, will process with analysis when verified.

Will add automated version to Superset in the Suggested Edits dashboard but wanted to make progress on this ticket.
Note that Image Tag data is missing for month of July 2020 due to bug that prevented tag event counts in event logging.

Screen Shot 2020-07-21 at 6.25.53 PM.png (686×1 px, 138 KB)

Screen Shot 2020-07-21 at 6.26.02 PM.png (668×1 px, 136 KB)

Screen Shot 2020-07-21 at 6.26.13 PM.png (666×1 px, 137 KB)

SNowick_WMF lowered the priority of this task from Low to Lowest.Sep 28 2020, 8:15 PM

These graphs can go live in the SE dashboard that Mikhail originally made. Updating them once a month is ok

An analysis of editor activity between 2020-08-01 and 2020-09-31 showed the following editor retention percentages.
(An editor counts as retained if they were active on or after a specific day cohort, these are averages across all active editors.)

For the future I will be working on a way to automate these stats so they are readily available.

Edit type3 day retention7 day14 day30 day
Description add, translate28.4%23%17.6%10.5%
Image caption add, translate17.6%14.3%10.3%5.1 %
Image tag add5.8%5%3%1.2%

Thx @SNowick_WMF

Edit type3 day retention7 day14 day30 day
Description add, translate28.4%23%17.6%10.5%
Image caption add, translate17.6%14.3%10.3%5.1 %
Image tag add5.8%5%3%1.2%

Uh, the hard truth for image tags!

I’m wondering how much influence the prominent ADD ARTICLE DESCRIPTION and ADD IMAGE TAGS CTA’s in the article have. An explanation for the low 3 day retention value for Image tag add could be that CTA’s to add an article description and image caption are featured prominently on the article, which is a pool of ~ 73k users (61.9% of 118.9k that are logged in).

In addition, the image caption CTA is featured in the gallery. This means, users are confronted with article description and image caption edits more than with the tags, as they constantly see the CTA’s on the article page. Does this take make sense @SNowick_WMF ?

@schoenbaechler We do have a schema to track user exposure to CTAs and secondary CTAs https://phabricator.wikimedia.org/T258080 but that has been de-prioritized while we re-org the analytics workflow for Android. Agree with the assumption that CTAs are motivating returning editors.