Page MenuHomePhabricator

Perform load-testing in Beta
Closed, ResolvedPublic

Assigned To
Authored By
sdkim
Aug 19 2020, 3:33 PM
Referenced Files
F32350817: Screenshot_2020-09-14 Test Report(1).png
Sep 14 2020, 6:39 PM
F32350815: Screenshot_2020-09-14 Test Report.png
Sep 14 2020, 6:39 PM
F32242311: image.png
Sep 3 2020, 10:02 AM
F32243231: image.png
Sep 3 2020, 10:02 AM
F32243253: image.png
Sep 3 2020, 10:02 AM
F32242307: image.png
Sep 3 2020, 10:02 AM
F32243237: image.png
Sep 3 2020, 10:02 AM
F32243246: image.png
Sep 3 2020, 10:02 AM

Description

Open questions

Acceptance criteria

  • Retrieve benchmarks to compare the performance test against
  • Re-do the kubernetes benchmarking LOCALLY
  • Re-do the kubernetes benchmarking against BETA clusters
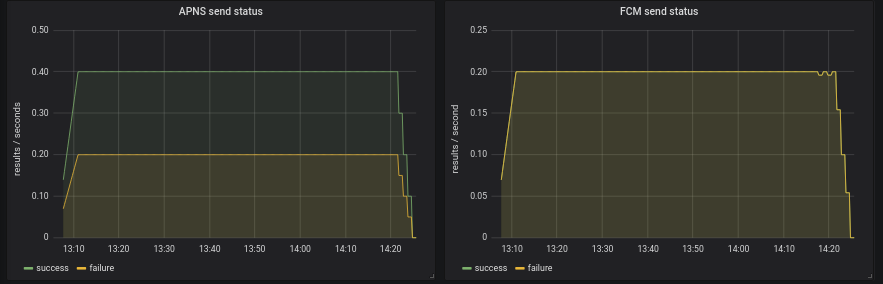
  • Include APNS url

Out of Scope

  • Not including echo

Notes

  • We can potentially use the script that Mateus used on a previous beta test.

Conclusion

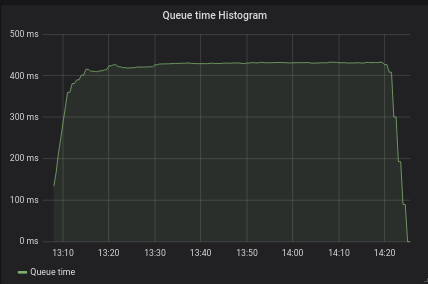
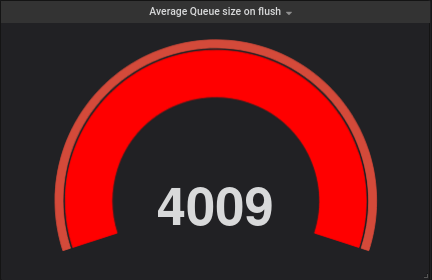
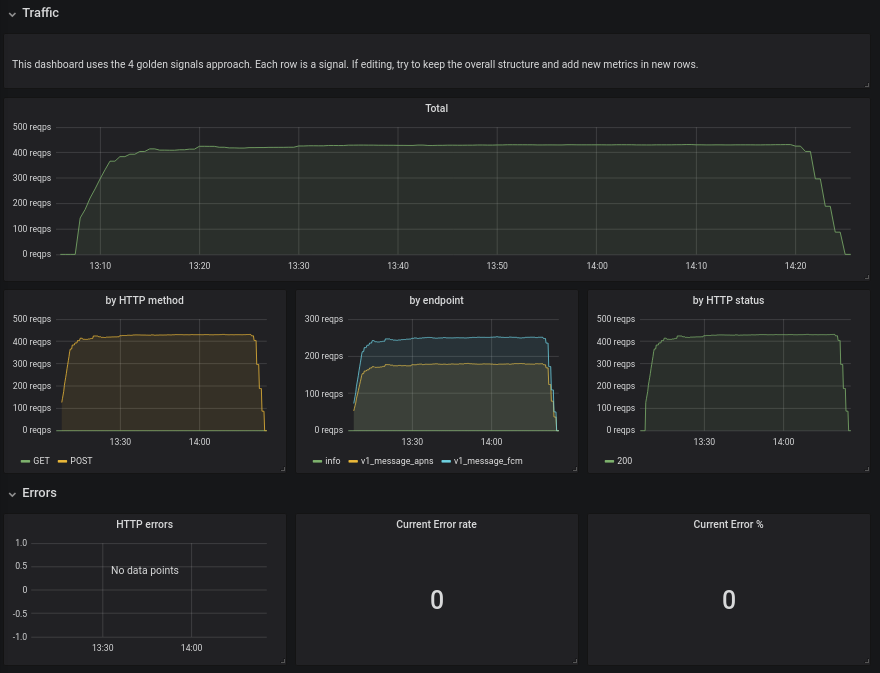
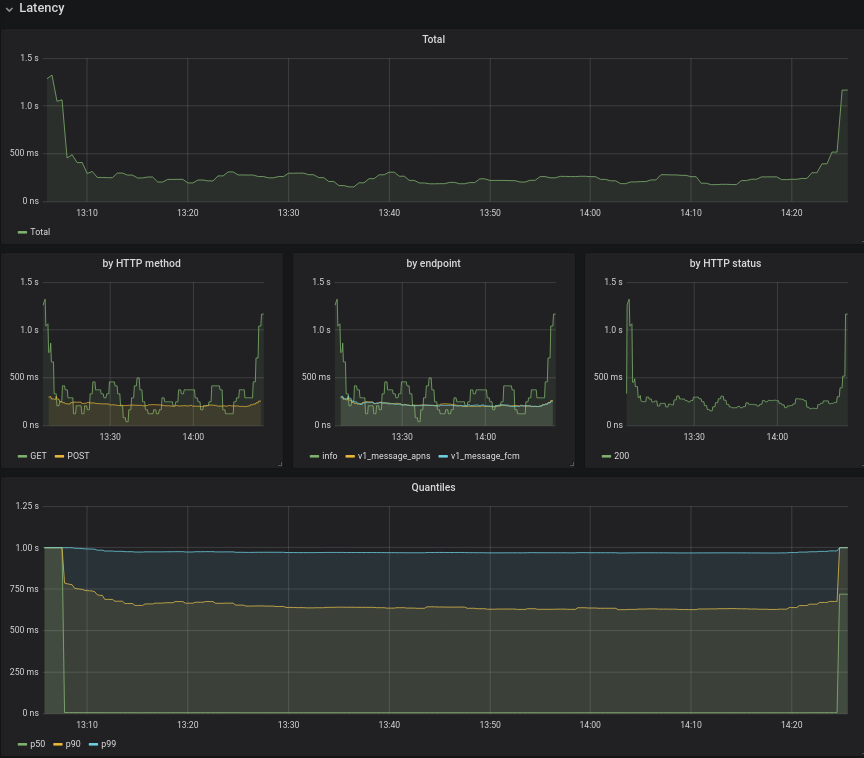
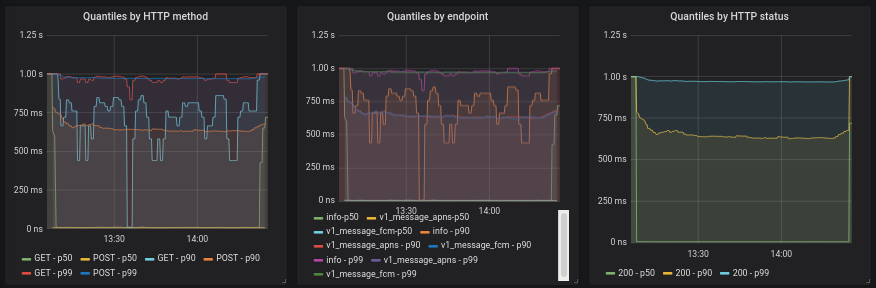
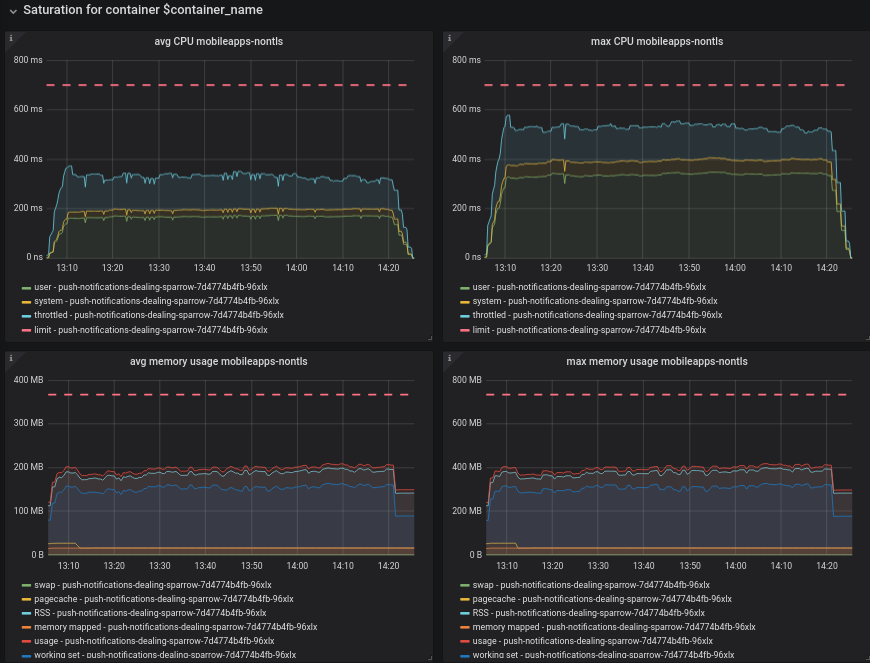
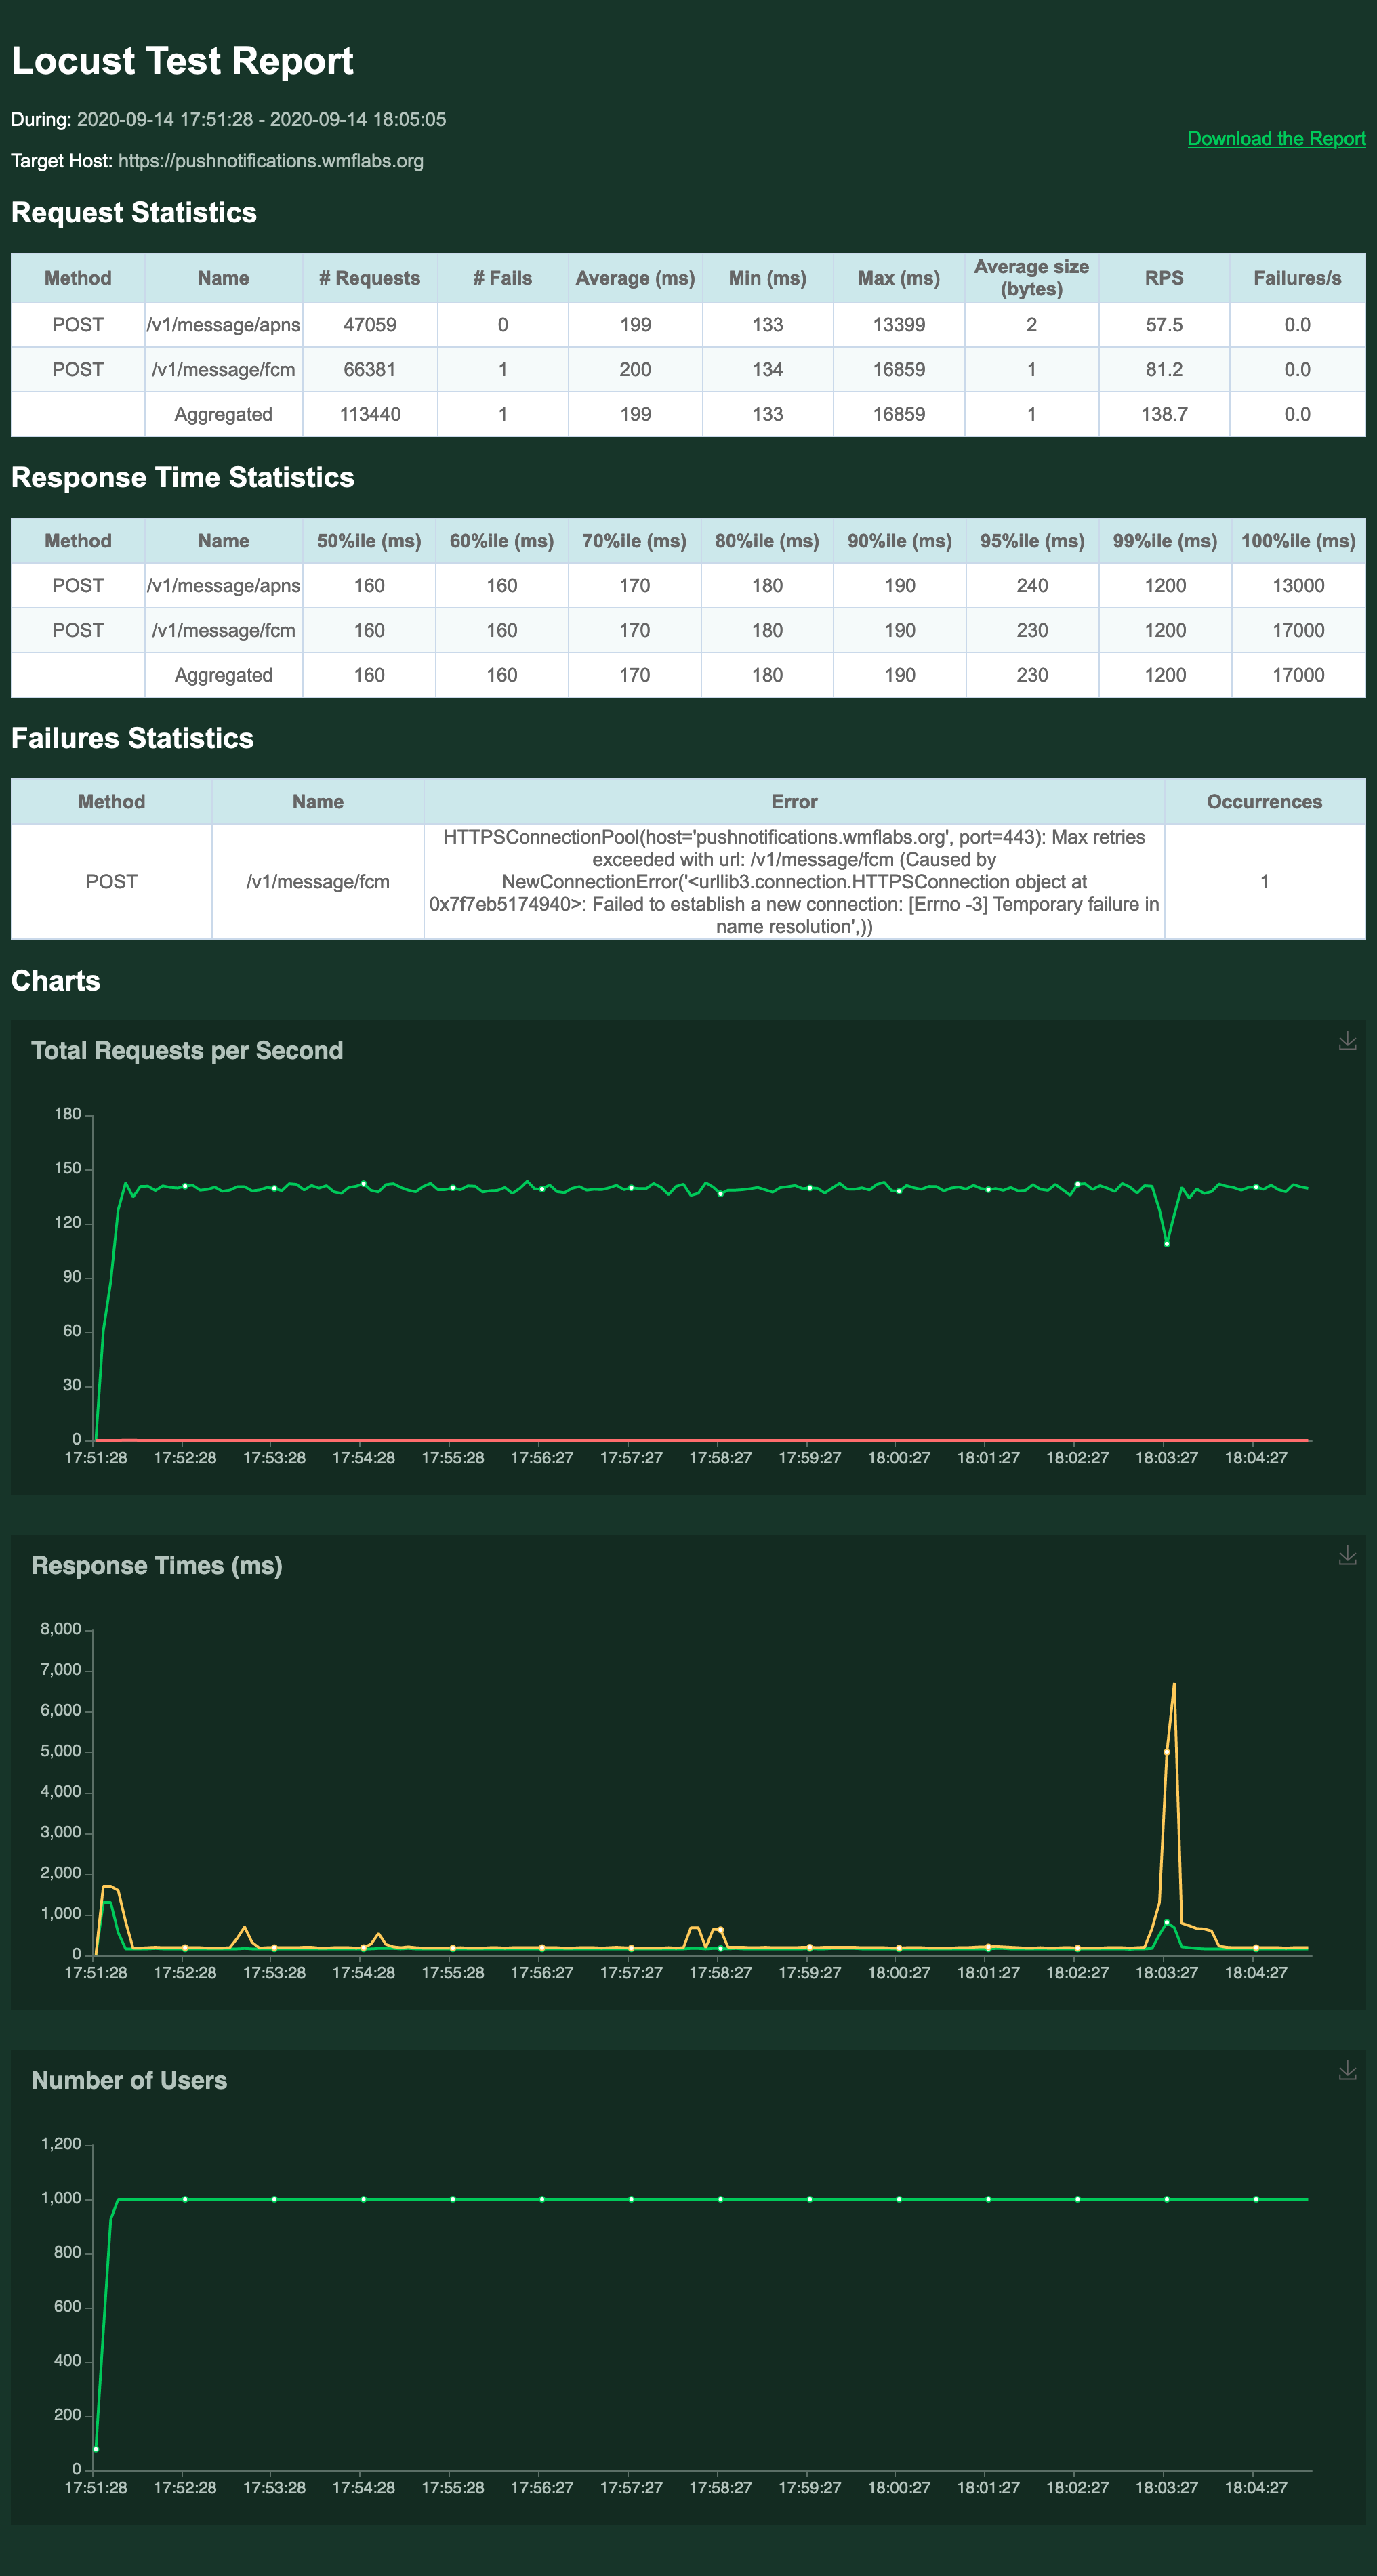
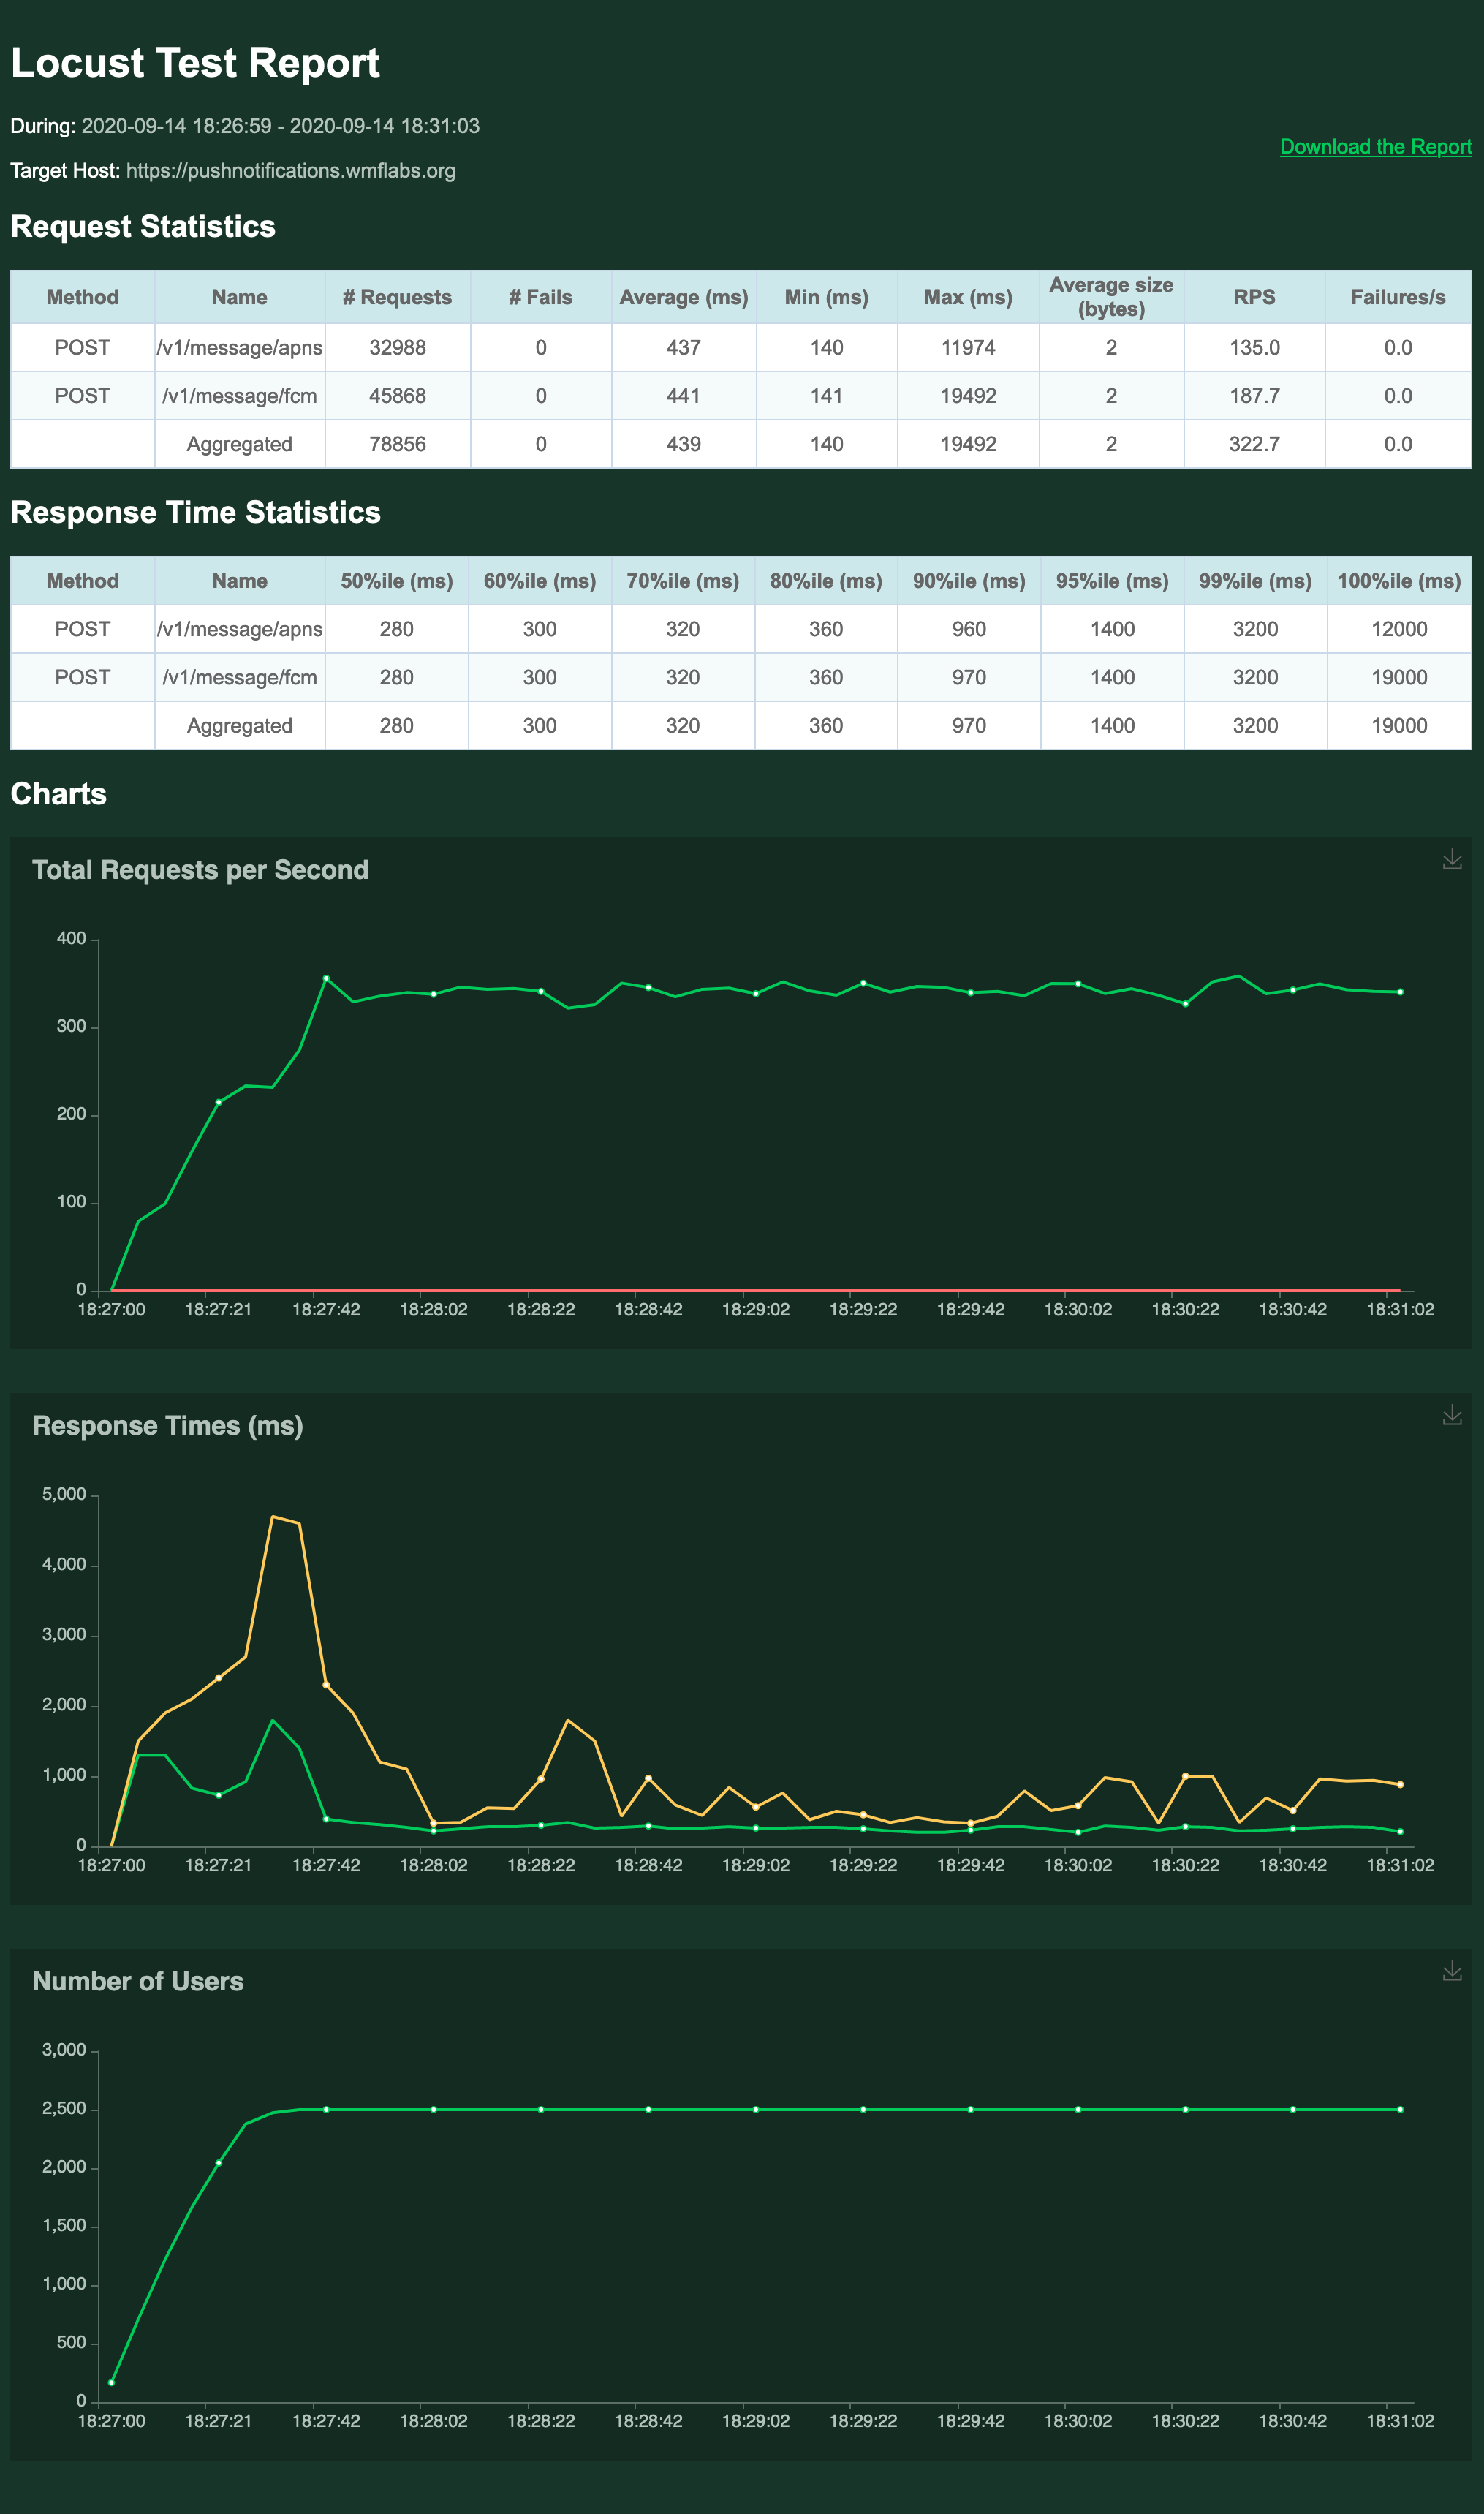
See reports T260807#6432860 and T260807#6459980

A follow-up patch on deployment-charts is to be pushed with the needed changes to run the service with the prometheus metrics collections and the new configurations.

No follow-up issues were found during tests.

Event Timeline

Regarding prometheus on beta:

  • There is a prometheus node running in the beta cluster
  • Push notification instance is running the node export for system metrics
  • There is network flow from prometheus to push-notifications for the node metrics
  • There is no scrape_config for nodejs this means it needs some extra config to be able to pull metrics from our push-notifications service
  • In case we add a new exporter for the service specific metrics we need to change the sg rules to allow traffic to the exporter

The load test locally is finished, here are the data collected:

  • Queue time was in average 400 ms and very consistent

image.png (284×428 px, 15 KB)

  • Queue size on flush was in average 4009

image.png (280×432 px, 23 KB)

  • The transaction time with APNS and FCM was almost constant at 200ms for both providers

image.png (284×876 px, 19 KB)

  • The test included sending a small amount of fake tokens to force send failure, but FCM metrics showed a weird behavior of duplicated counts for success and failure

image.png (284×883 px, 30 KB)

  • The service performed well at 400 req/s where it saturated, no HTTP error was registered at this rate

image.png (673×880 px, 63 KB)

  • In the tests there were a spike in latency at the beginning and end of the script, but it kept an average of 300ms overall, p99 at 1s and p90 at 700ms

image.png (758×864 px, 72 KB)

image.png (288×876 px, 64 KB)

  • CPU and memory stabilized above the established limits, the memory needed increased by 100Mi and CPU needed decreased by 1000m

image.png (663×870 px, 129 KB)

A follow-up patch on deployment-charts is to be pushed with the needed changes to run the service with the prometheus metrics collections and the new configurations.

Change 624012 had a related patch set uploaded (by MSantos; owner: MSantos):
[operations/deployment-charts@master] push-notif: drop support to statsd-exporter

https://gerrit.wikimedia.org/r/624012

Change 624012 merged by jenkins-bot:
[operations/deployment-charts@master] push-notif: drop support to statsd-exporter

https://gerrit.wikimedia.org/r/624012

So, I tried to configure Prometheus and Grafana for the beta cluster, but without success. I was still able to perform the load test, but only able to collect the metrics available in Locust.

The latency results do not reflect production because they will be made as internal requests for each cluster. But, the tests were consistent with a similar error rate and request/s. Here are 2 reports considering different loads:

138.7 req/s:

Screenshot_2020-09-14 Test Report.png (3×2 px, 365 KB)

322.7 req/s:

Screenshot_2020-09-14 Test Report(1).png (3×2 px, 319 KB)