Page MenuHomePhabricator

Onboard Perf Team to new Alerting Toolset
Closed, ResolvedPublic

Description

This task tracks onboarding Performance team alerts to Alertmanager, specifically:

  • Add performance team "contacts" (irc/email) to Alertmanager configuration
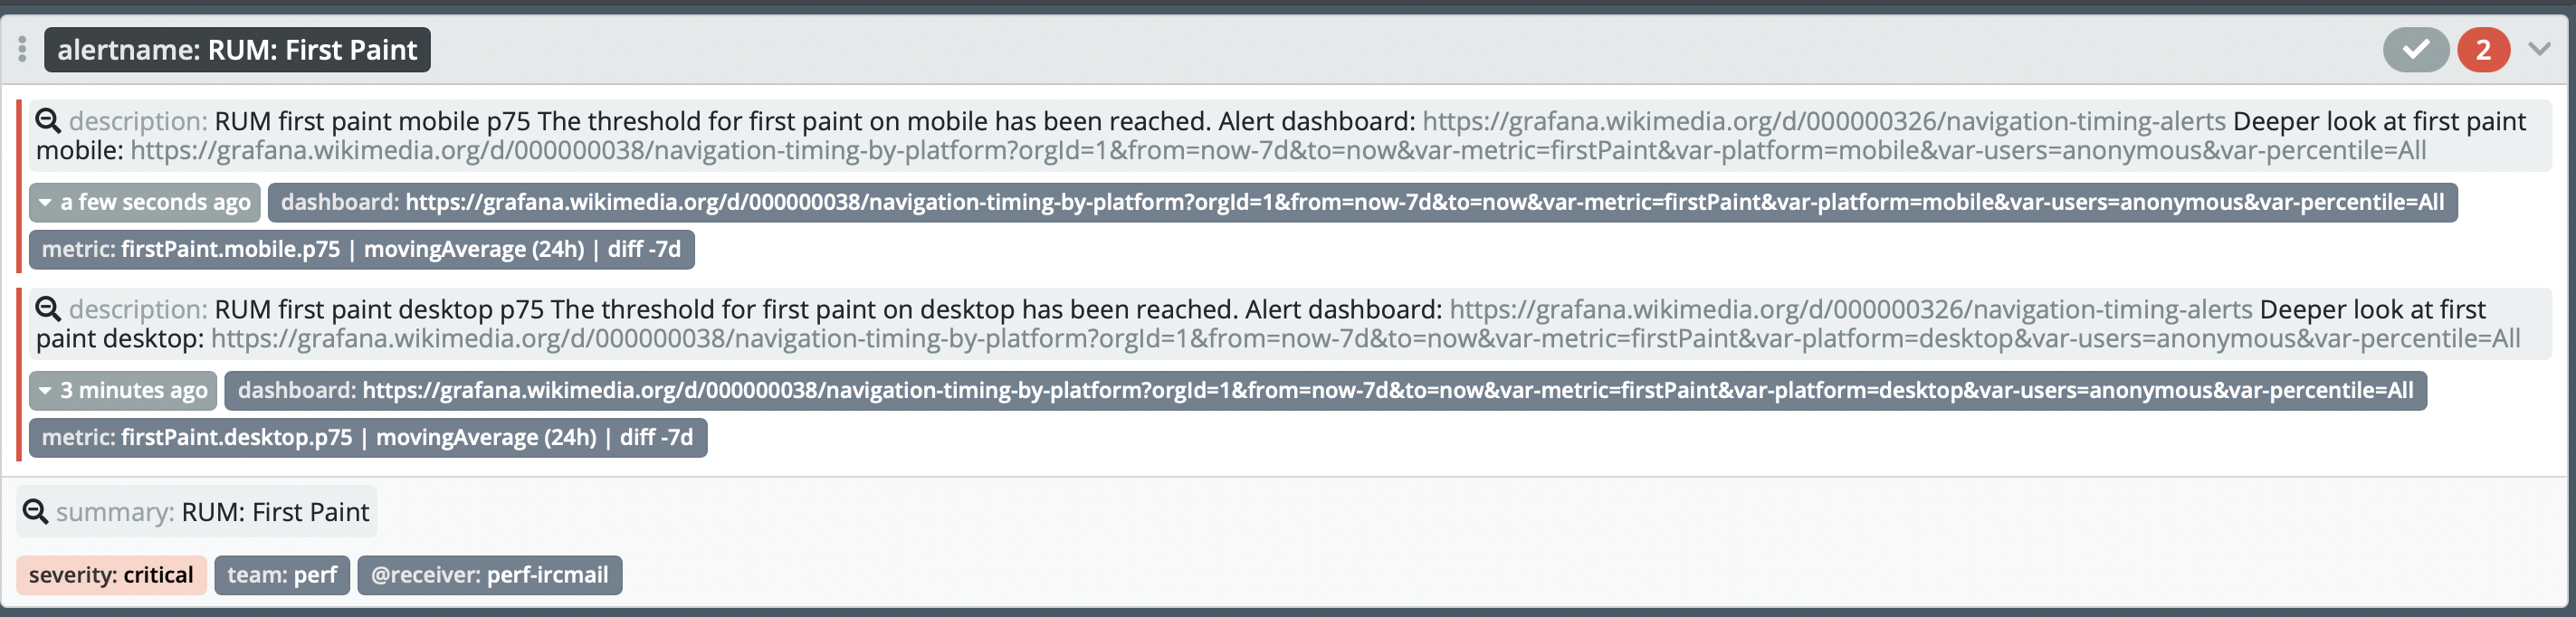
  • Audit and move Grafana alerts from Icinga to Alertmanager. Each alert must have at least team and severity labels set
  • De-provision Icinga checks for Performance dashboards

Event Timeline

@fgiunchedi I'm gonna do that on our side, so ping me when you are ready to talk.

@fgiunchedi I'm gonna do that on our side, so ping me when you are ready to talk.

Sounds good! To give an overview: to have proper routing each alert will need to have at least team and severity labels, in this case the team value could be performance (or perf ? I'm ok with either). The severity label is also not written in stone but to ease the transition from Icinga I think it makes sense to have (some of) the following: page, critical, warning, unknown, task. The first and last are new, and can be used to issue pages to the team (if applicable) and to create tasks to one/more phabricator projects.

The first step I think is to figure out what severity should correspond to which contact method for team=performance alerts, for a made-up example:

  • critical should IRC #wikimedia-perf and email performance-team@
  • warning should email performance-team@
  • otherwise open a task to PROJECT

Let me know what you think! Happy to set up a meeting as well if that's easier

@fgiunchedi great, lets setup a meeting as a start!

@fgiunchedi great, lets setup a meeting as a start!

Sweet! Meeting on Wed at 13 UTC (invite sent)

Thanks for the meeting @fgiunchedi I will change two alerts first things tomorrow for the tests we run with WebPageReplay and set them up as an example, and then make them fire and see if we can up with a good way of grouping them.

Checked the docs for Grafana. To be able to add custom labels we need 7.4 but since it based on tags for Graphite it no use for us right now for the synthetics tests,

The docs also says: "All alert notifications contain a link back to the triggered alert in the Grafana instance. This URL is based on the domain setting in Grafana." that would be sweat if we can use.

Change 663238 had a related patch set uploaded (by Filippo Giunchedi; owner: Filippo Giunchedi):
[operations/puppet@production] alertmanager: route Performance team alerts

https://gerrit.wikimedia.org/r/663238

Thanks for the meeting @fgiunchedi I will change two alerts first things tomorrow for the tests we run with WebPageReplay and set them up as an example, and then make them fire and see if we can up with a good way of grouping them.

Sweet! I've just published https://gerrit.wikimedia.org/r/c/operations/puppet/+/663238 for the routing as we discussed, PTAL. I'm not sure about the email address for example

Checked the docs for Grafana. To be able to add custom labels we need 7.4 but since it based on tags for Graphite it no use for us right now for the synthetics tests,

The docs also says: "All alert notifications contain a link back to the triggered alert in the Grafana instance. This URL is based on the domain setting in Grafana." that would be sweat if we can use.

Agreed that'd be sweet! We have a tracking task for Grafana upgrade (https://phabricator.wikimedia.org/T263747) FWIW

I've tested with two alerts just to see what it looks like:

Screenshot 2021-02-11 at 08.47.17.png (1×2 px, 1 MB)

So I need to be better at naming each metrics :) The test we run tests three different URLs and if all three are above the threshold, the alert is fired.

It seems that the runbook link isn't created? In Grafana it looks like this, is that correct or should I do something special for the link:

Screenshot 2021-02-11 at 08.52.47.png (430×1 px, 210 KB)

I think would be great to find a way to include the URL to the dashboard to make the alerts in the alert manager more actionable.

Now I grouped per tool that run the tests, I need to think about how we best should do that before I move on.

Made some changes:

Screenshot 2021-02-11 at 09.33.13.png (1×2 px, 1 MB)

I've added the URL to the dashboard in the message, that's ok ok I think.

Then I feel we should group the tests per wiki instead. So for example we have one group for en.wiki (same for mobile/desktop?) and then all tools report under that name and tag what tool that is alerting.

For the RUM metrics we don't needy to group them so the name is one per metric we test.

For reference: Each condition that we add to the alert in Grafana:

Screenshot 2021-02-11 at 09.55.42.png (448×1 px, 238 KB)

will have their own section with description in the alert manager. In that example we test one URL or query and the last query checks if we show a banner or not. All these for condition will have their own section in the alert manager and reuse the message set in Grafana.

It seems that the runbook link isn't created? In Grafana it looks like this, is that correct or should I do something special for the link:

Screenshot 2021-02-11 at 08.52.47.png (430×1 px, 210 KB)

That's interesting! Yes I think the reason why the link isn't rendered is that alert "annotations" are given that treatment in Karma and not alert "labels", it seems Grafana sends only labels (named 'tags') and not arbitrary annotations :( The annotations that are sent however are: summary / description and image (which in theory should be enabled, not sure why we're not seeing the image URL included though)

@fgiunchedi is images configured? I think they need to be uploaded somewhere, before when I used it on my personal setup I needed to configure so Chromium (before PhantomJS) took a screenshot of the graph and then upload it somewhere so the image are accessible.

@fgiunchedi is images configured? I think they need to be uploaded somewhere, before when I used it on my personal setup I needed to configure so Chromium (before PhantomJS) took a screenshot of the graph and then upload it somewhere so the image are accessible.

AFAICT it should work, in the sense that I can do direct-linking of renders of panels, e.g. this swift render. We have grafana-image-renderer plugin installed (thus chromium headless)

However I just noticed that the direct render doesn't seem to work for all dashboards. e.g. edit-count doesn't work however the webpagerelay ca alerts works.

Made some changes:

Screenshot 2021-02-11 at 09.33.13.png (1×2 px, 1 MB)

I've added the URL to the dashboard in the message, that's ok ok I think.

Agreed that's likely good enough for now

Then I feel we should group the tests per wiki instead. So for example we have one group for en.wiki (same for mobile/desktop?) and then all tools report under that name and tag what tool that is alerting.

There's indeed many ways to solve this problem, as a matter of best practice the alert name is usually a combination of "thing" and/or "symptom", e.g. in the case above one could have:

alertname: WebPageReplaySlowFirstVisualChange

+

alertname: WebPageReplaySpeedIndexRegression

across all relevant dashboards, each group then will have the tags e.g. per wiki

@fgiunchedi I have two questions:

  • is there a way to convert/massage the data that comes from Grafana before it ends up in the Alert Manager? I'm thinking if there's a way to get rid of one message per alert condition as in https://phabricator.wikimedia.org/T272979#6821783? We need to have three/four different conditions and but since we use AND conditions all need to match = one message in the alert manager is enough and make the alert easier to read/understand.
  • is there a way today to escalate X amounts of warnings into a critical alert in the Alert Manager? For example we test 12 different Wikipedias, if a couple fails its a warning but if all its critical? I understand we can do that directly in Grafana but the alert setup there are still pretty basic so creating that amount of alert queries will be hard to get right.

Change 663238 merged by Filippo Giunchedi:
[operations/puppet@production] alertmanager: route Performance team alerts

https://gerrit.wikimedia.org/r/663238

Checked the docs for Grafana. To be able to add custom labels we need 7.4 but since it based on tags for Graphite it no use for us right now for the synthetics tests,

The docs also says: "All alert notifications contain a link back to the triggered alert in the Grafana instance. This URL is based on the domain setting in Grafana." that would be sweat if we can use.

Grafana has been upgraded to 7.4 today, in case you'd like to do further tests

@fgiunchedi I have two questions:

  • is there a way to convert/massage the data that comes from Grafana before it ends up in the Alert Manager? I'm thinking if there's a way to get rid of one message per alert condition as in https://phabricator.wikimedia.org/T272979#6821783? We need to have three/four different conditions and but since we use AND conditions all need to match = one message in the alert manager is enough and make the alert easier to read/understand.

Following up from IRC -- there isn't such a built-in way in AM

  • is there a way today to escalate X amounts of warnings into a critical alert in the Alert Manager? For example we test 12 different Wikipedias, if a couple fails its a warning but if all its critical? I understand we can do that directly in Grafana but the alert setup there are still pretty basic so creating that amount of alert queries will be hard to get right.

The closest functionality (but not quite) would be to use "inhibit" AM feature to not fire the warning alerts if there's already critical alert, although the critical alert will still need to be sent somehow

I'll start today and add some new alerts that that will fire critical if our measuring tools isn't working. Those queries will be easier and the output will look better/more understandable in AlertManager.

For the others more complicated queries, I wanna get some feedback from the rest of my team members, I'll do that on Monday,

I tried one of the new alerts and we got the email and the alert in IRC and Alert Manager (https://grafana.wikimedia.org/d/frWAt6PMz/synthetic-tool-alerts).

Yes I think the reason why the link isn't rendered is that alert "annotations" are given that treatment in Karma and not alert "labels", it seems Grafana sends only labels (named 'tags') and not arbitrary annotations

@fgiunchedi is that something you can fix so they are linked and the alerts in the Alert Manager is readable?

Not AFAIK, it'd be nice though if Grafana could be instructed to send alertmanager annotations (not to be confused with grafana annotations) in addition to tags. I've just opened a Grafana feature request: https://github.com/grafana/grafana/issues/31345

Ok, so then there's nothing to do at the moment right?

Then my plan is to start convert all our alerts tomorrow by adding the AlertManager and severity/team to all of them and tune the title/description to better reflect what is wrong.

And then I will let you know @fgiunchedi when I'm finished and you can verify.

I think one tool per day is a good pace :) Let me start with the WebPageTest alerts today.

I haven't started to try out transformations yet, thanks.

Adding a couple of screenshots that we can talk about later today:

Screenshot 2021-02-25 at 09.52.37.png (238×2 px, 243 KB)

Screenshot 2021-02-25 at 10.11.46.png (682×2 px, 859 KB)

Here's my notes from the sync meeting with @fgiunchedi :

  • Make the name/subject on the alert descriptive, for example: First paint is slow on mobile (or something like that
  • Add the tool name (that fired the alert) as a tag
  • Add links to dashboard(s) as tags and use the "message" part of Grafana to just have text.

Hi @fgiunchedi I have two questions:

  1. Yesterday our mobile phone provider tests went down and in Grafana I can see that the alert started:

Screenshot 2021-03-08 at 09.14.44.png (600×1 px, 218 KB)

That looks good and the problem is still there (I reported it upstream). On the IRC channel I can see that the alerts keep firing but they are also resolved:

Screenshot 2021-03-08 at 09.01.24.png (964×1 px, 1 MB)

Does that mean that someone resolved it through the GUI at alerts.wikimedia.org?

  1. Is it possible to configure the subject in the alert emails? On my phone it looks like this:

Image from iOS.png (2×1 px, 572 KB)

The subject starts with: [performance team] [FIRING 1] Andr ... or whatever could fit. I wonder if the email could start with the reason instead, so its easy just to look at the subject and understand what's wrong?

Hi @fgiunchedi I have two questions:

  1. Yesterday our mobile phone provider tests went down and in Grafana I can see that the alert started:

Screenshot 2021-03-08 at 09.14.44.png (600×1 px, 218 KB)

That looks good and the problem is still there (I reported it upstream). On the IRC channel I can see that the alerts keep firing but they are also resolved:

Screenshot 2021-03-08 at 09.01.24.png (964×1 px, 1 MB)

Does that mean that someone resolved it through the GUI at alerts.wikimedia.org?

I'm not sure why the alert would flap, can you post the timestamps as well? My suspicion now is that Grafana evaluates the alert every X, and thus at most sends alerts every X (in cases like this when the alert keeps firing). However AM requires clients to keep sending alerts that are firing (every 3m more or less IIRC), thus I think what's happening is that Grafana evaluates the alert, sends it, AM sees the alert and fires it, then some time passes and Grafana isn't sending the same alert again, AM considers the alert resolved. This repeats at the next Grafana evaluation cycle. The first test I suggest is to try with a shorter evaluation cycle for the alert!

  1. Is it possible to configure the subject in the alert emails? On my phone it looks like this:

Image from iOS.png (2×1 px, 572 KB)

The subject starts with: [performance team] [FIRING 1] Andr ... or whatever could fit. I wonder if the email could start with the reason instead, so its easy just to look at the subject and understand what's wrong?

I'll look into how to shorten the [FIRING 1] prefix, however the [performance-team] prefix is a mailman setting AFAICT

I've added AlertManager alerts for the most of our alerts now. What's missing is the WebPageReplay alerts. Hopefully I will finish that tomorrow and then I would love your input @fgiunchedi to see if there's something missing or should be changed. I'll ping you when I'm done.

Change 672346 had a related patch set uploaded (by Filippo Giunchedi; owner: Filippo Giunchedi):
[operations/puppet@production] icinga: remove Grafana alerts for Performance

https://gerrit.wikimedia.org/r/672346

Change 672346 merged by Filippo Giunchedi:
[operations/puppet@production] icinga: remove Grafana alerts for Performance

https://gerrit.wikimedia.org/r/672346

This is all completed now, specifically all Performance alerts that used to go through Icinga now are sent from Grafana itself to Alertmanager and show up on https://alerts.wikimedia.org, and have notifications routed accordingly

fgiunchedi claimed this task.

Change 674803 had a related patch set uploaded (by Filippo Giunchedi; author: Filippo Giunchedi):
[operations/puppet@production] alertmanager: send recovery emails for performance

https://gerrit.wikimedia.org/r/674803

Change 674803 merged by Filippo Giunchedi:
[operations/puppet@production] alertmanager: send recovery emails for performance

https://gerrit.wikimedia.org/r/674803