Page MenuHomePhabricator

Analyze readers' engagement in countries affected by Singapore Data Center's switch
Closed, ResolvedPublic

Assigned To
Authored By
Miriam
Apr 29 2019, 3:53 PM
Referenced Files
F29262740: lift_us_4groups.png
May 28 2019, 12:30 PM
F29262741: lift_ud_4groups.png
May 28 2019, 12:30 PM
F29262953: india0.png
May 28 2019, 12:30 PM
F29262954: malawi0.png
May 28 2019, 12:30 PM
F29263005: peru3.png
May 28 2019, 12:30 PM
F29263004: taiwan3.png
May 28 2019, 12:30 PM
F29262996: nepal2.png
May 28 2019, 12:30 PM
F29262968: burkina1.png
May 28 2019, 12:30 PM

Description

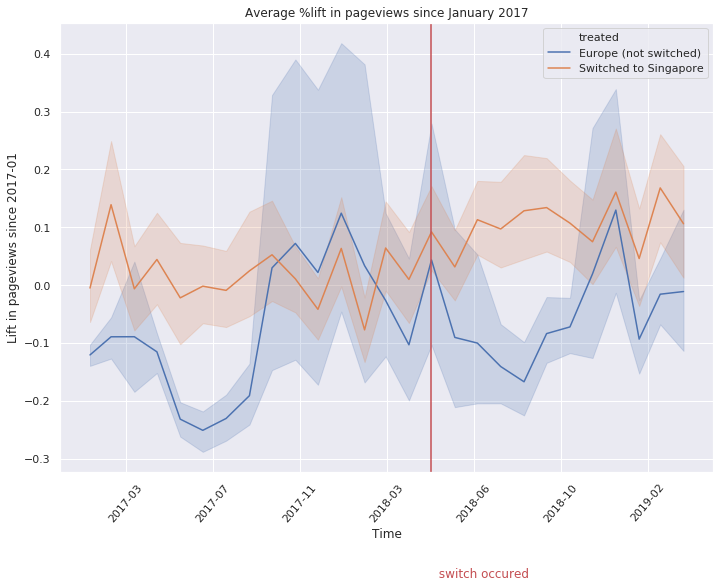
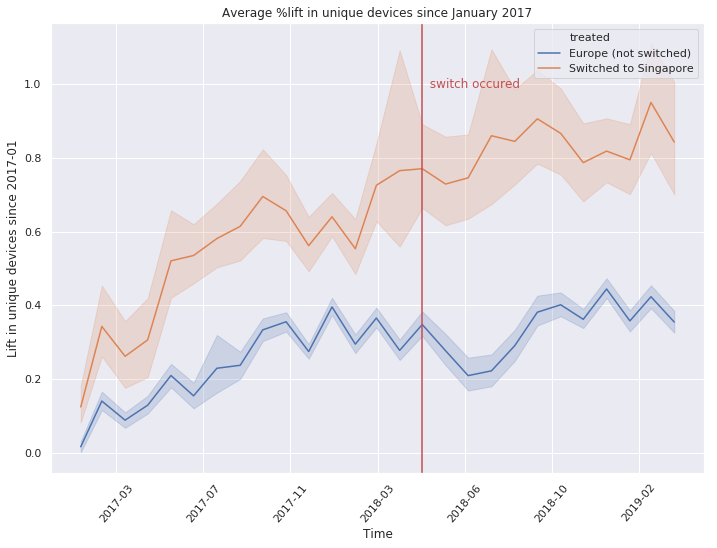
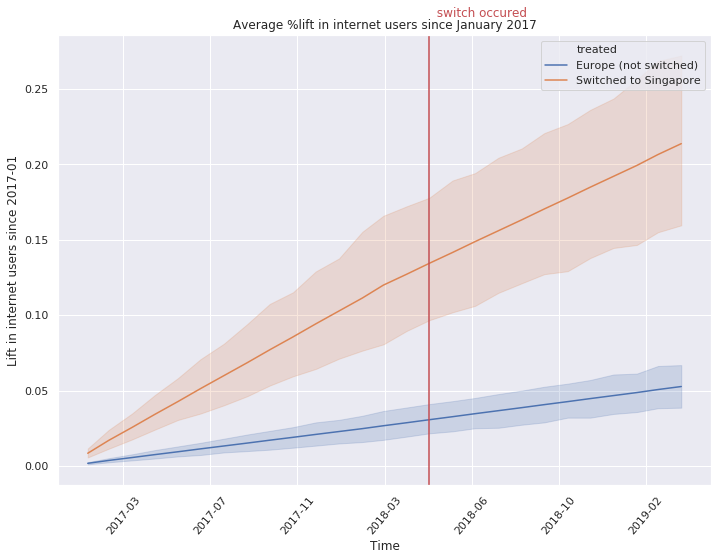
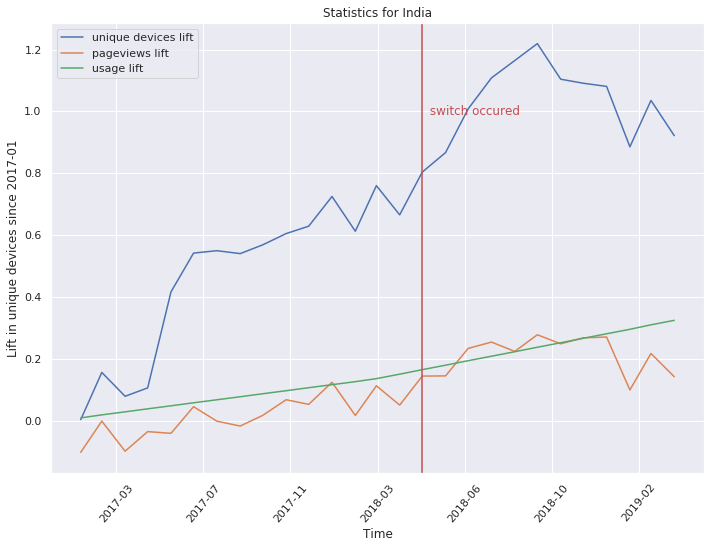
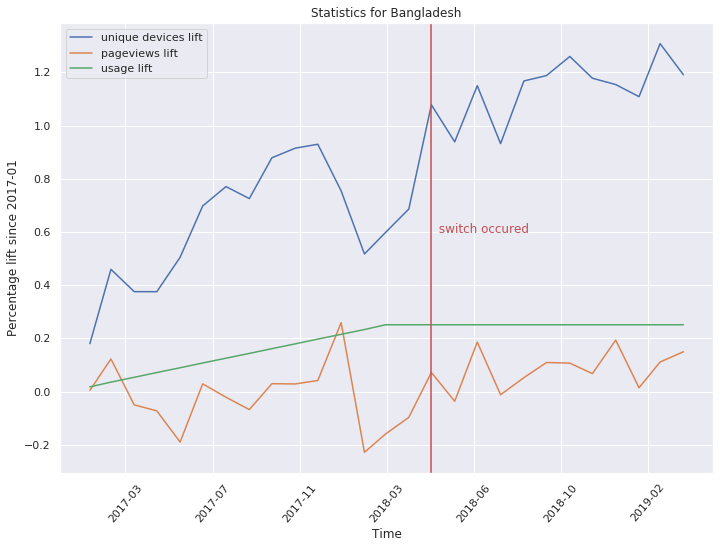
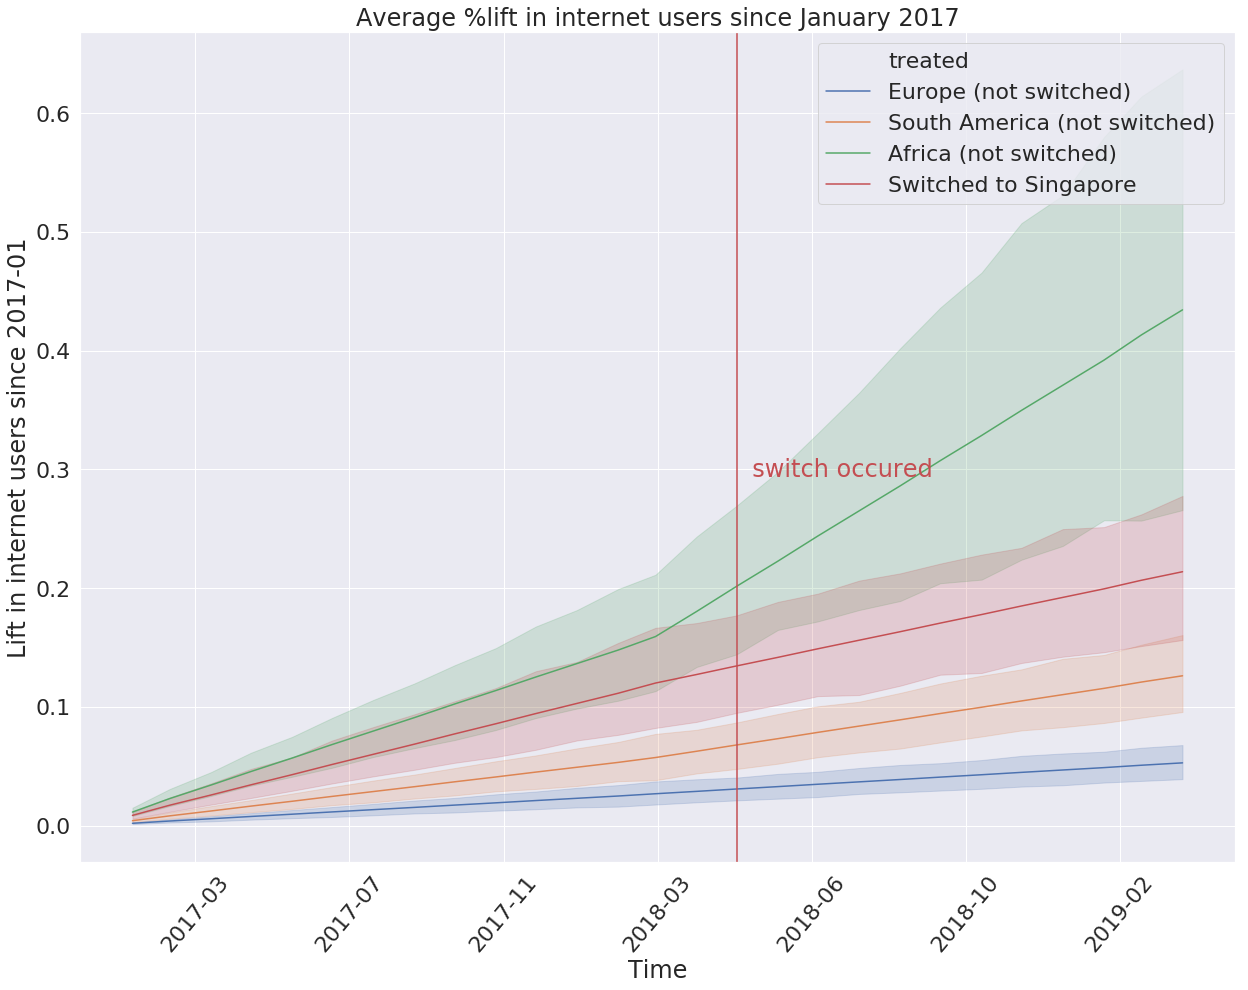
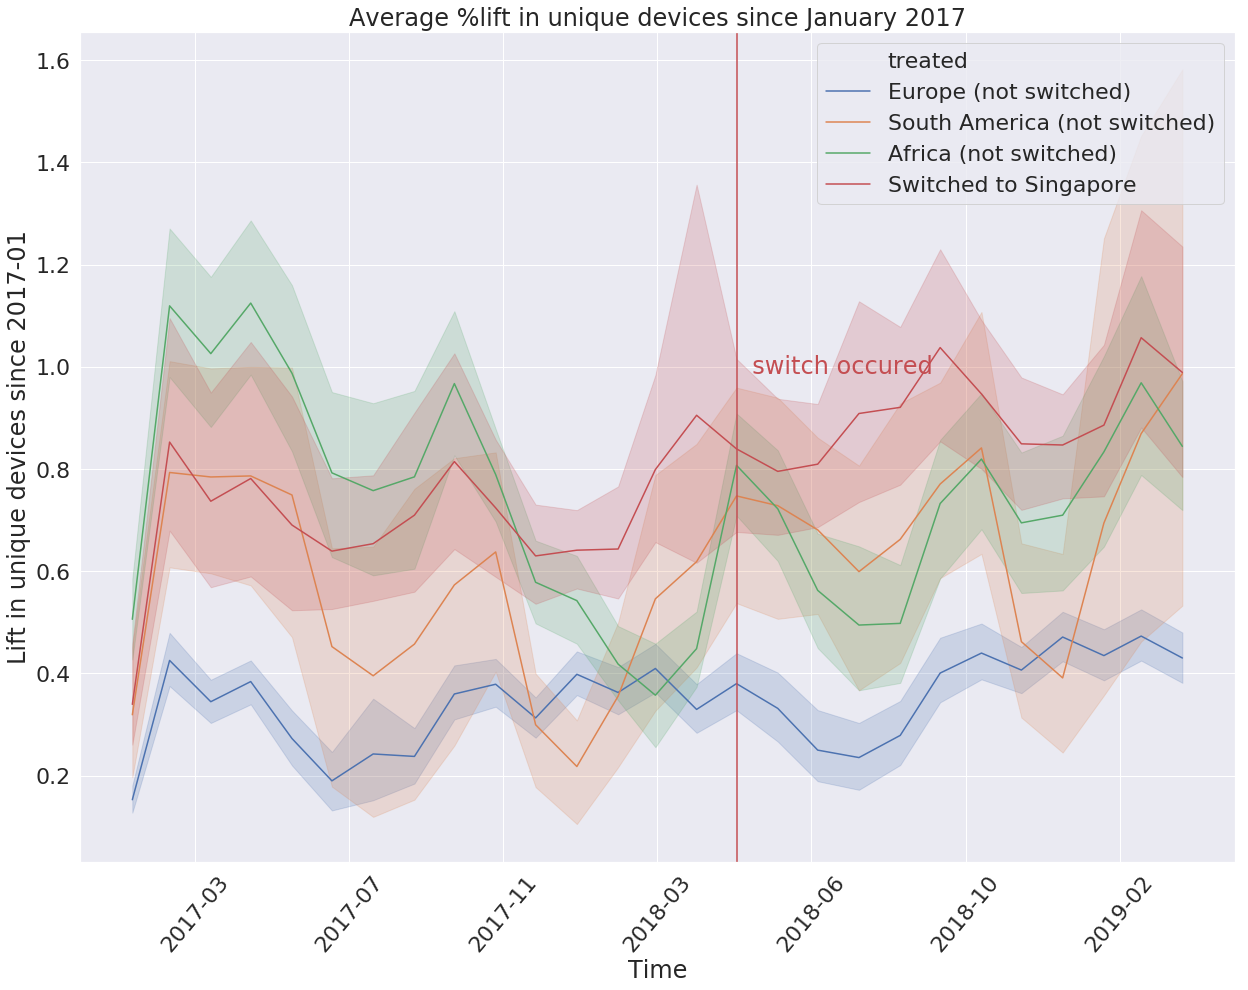
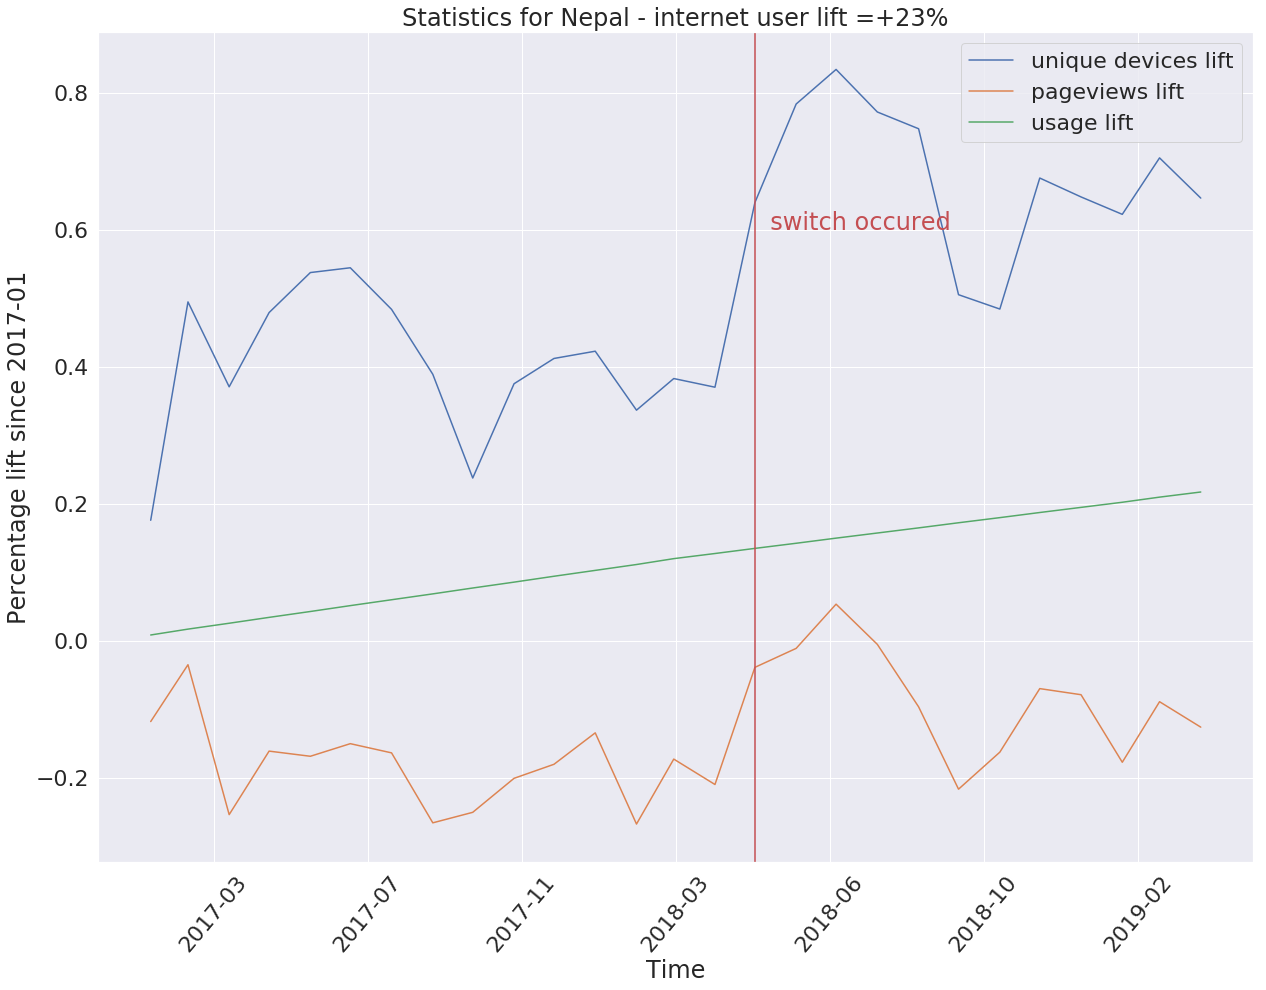
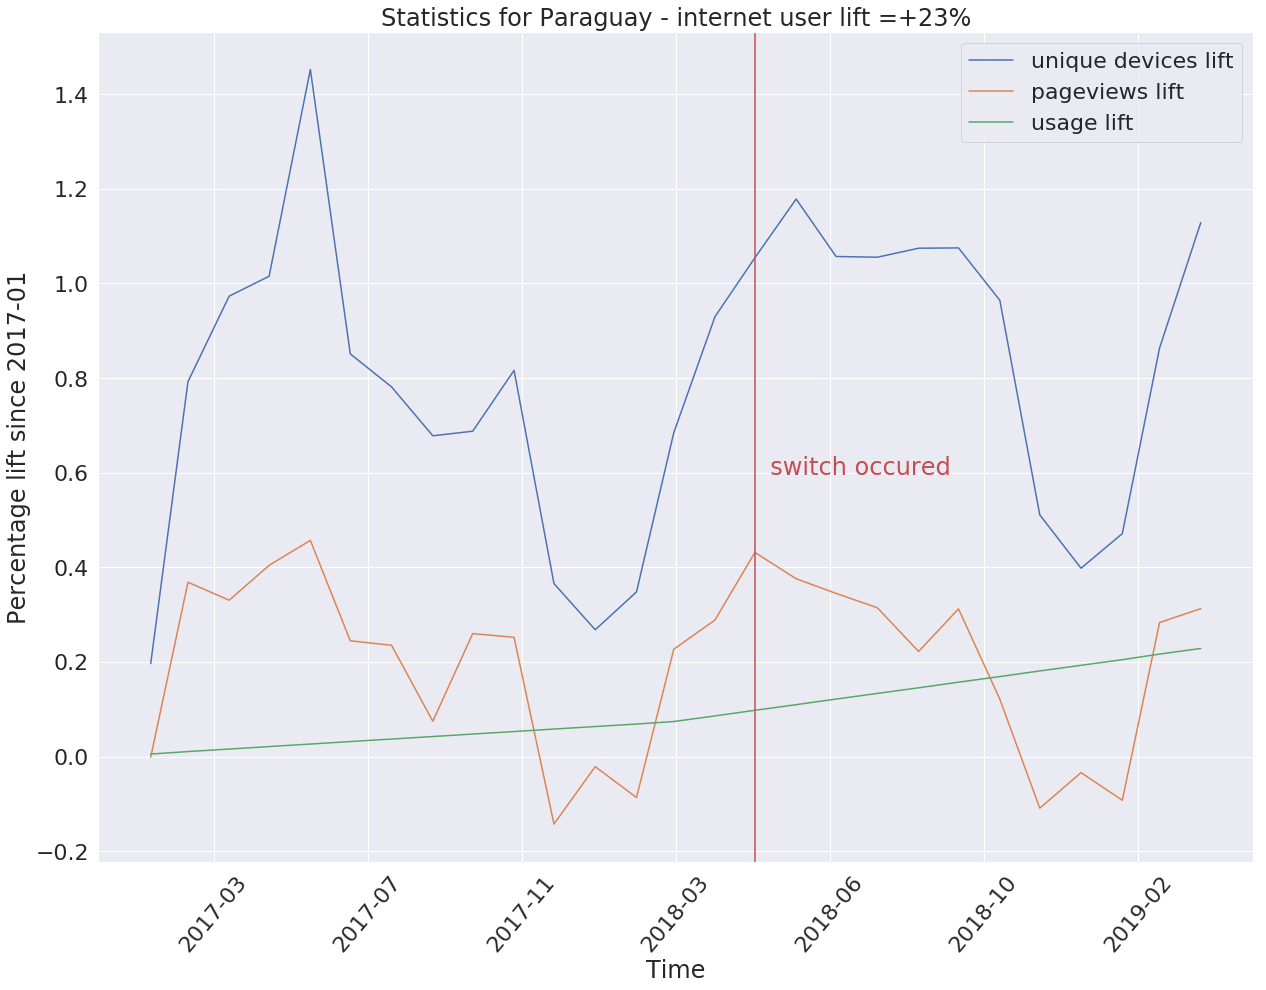
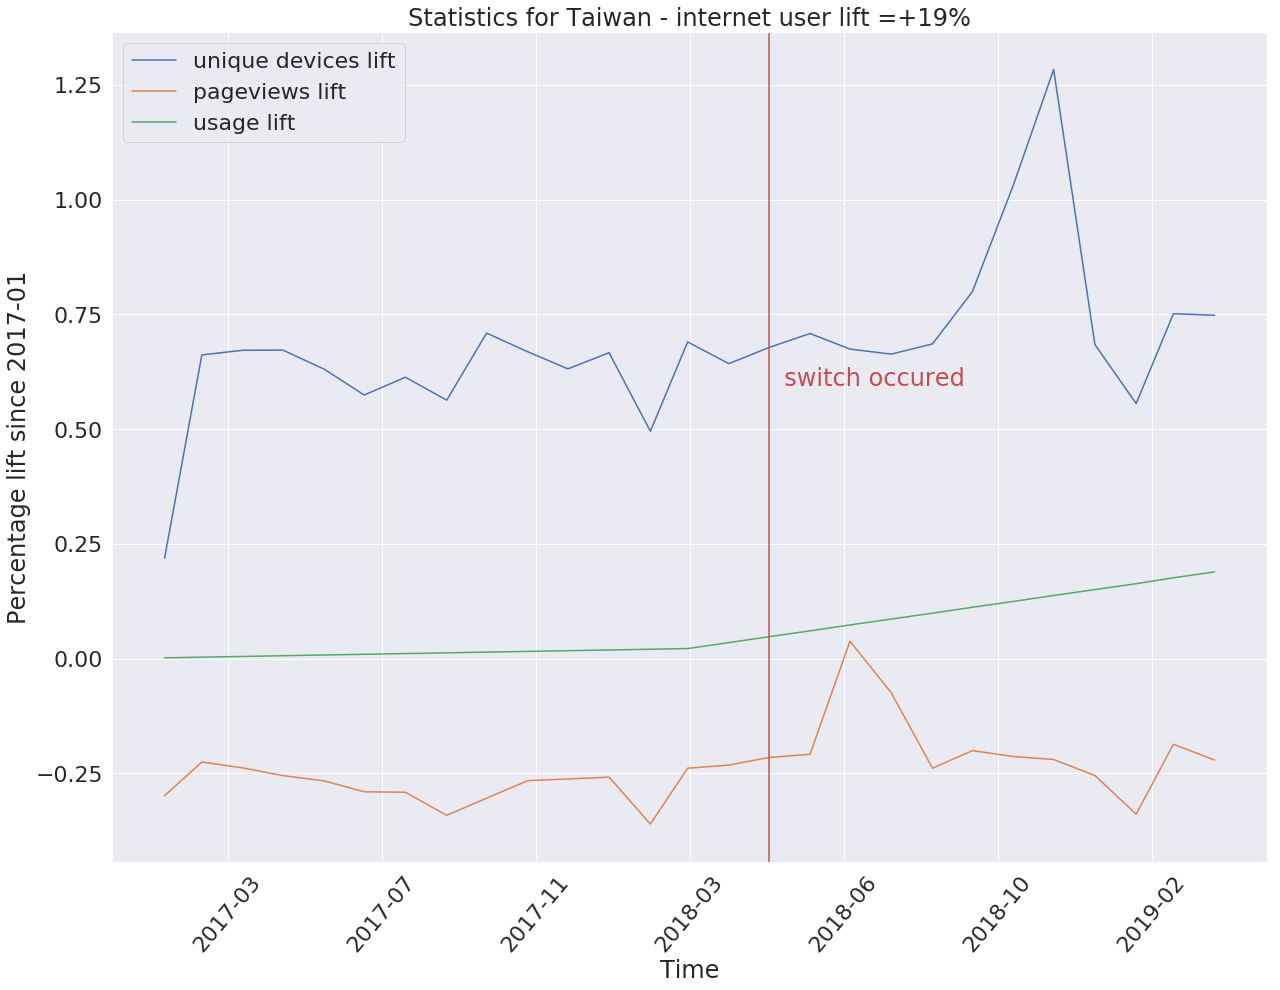
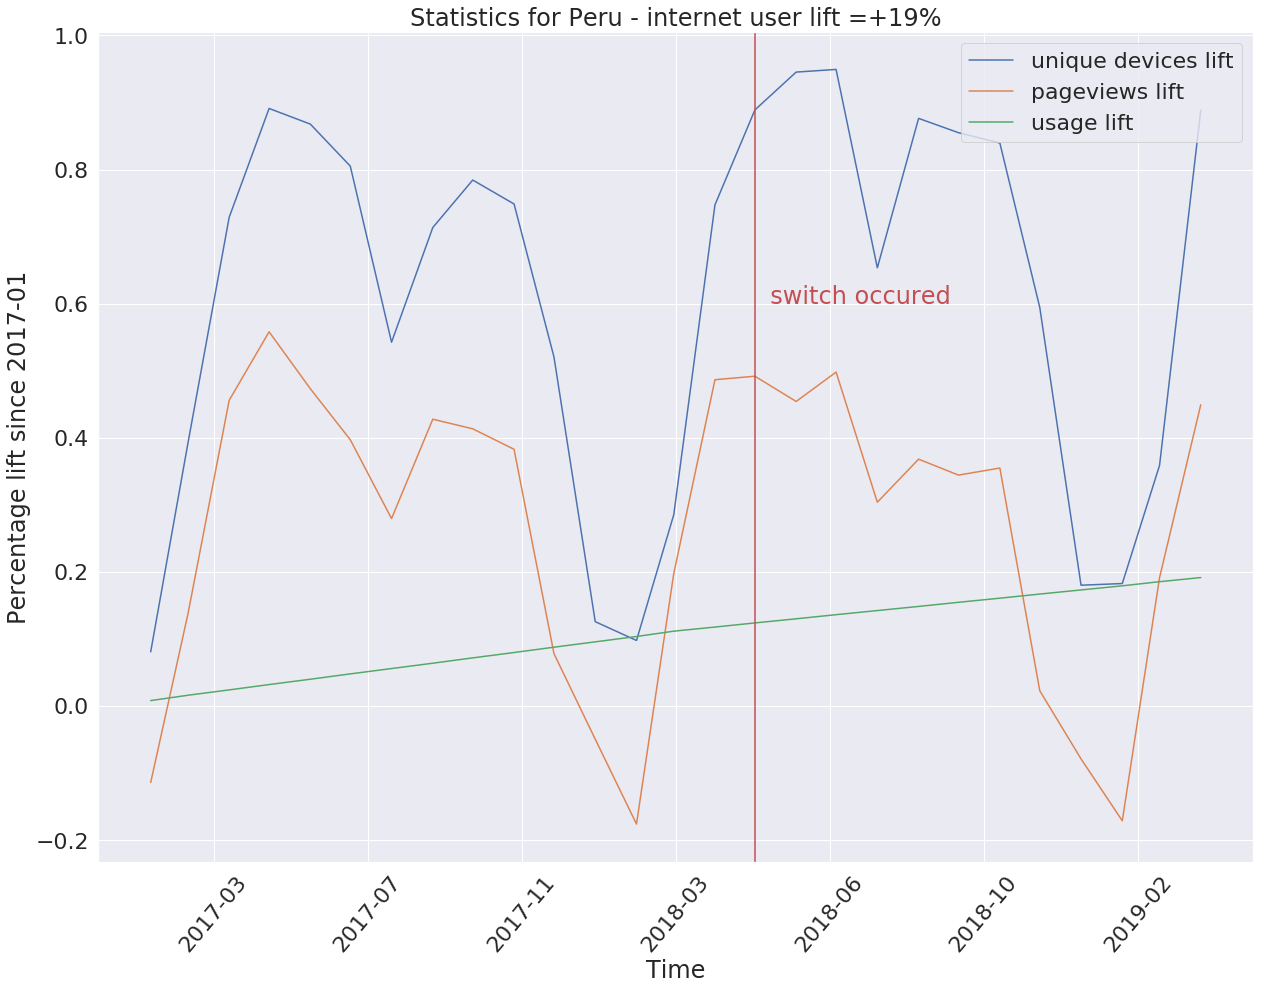
We want to measure the impact in terms of readers' engagement of adding the new Data Center in Singapore.
Readers get significant latency improvements, but does this impact their engagement with Wikipedia? Do they tend to read more pages? Does the number of unique devices significantly increase? Is it more likely that they register as new users?

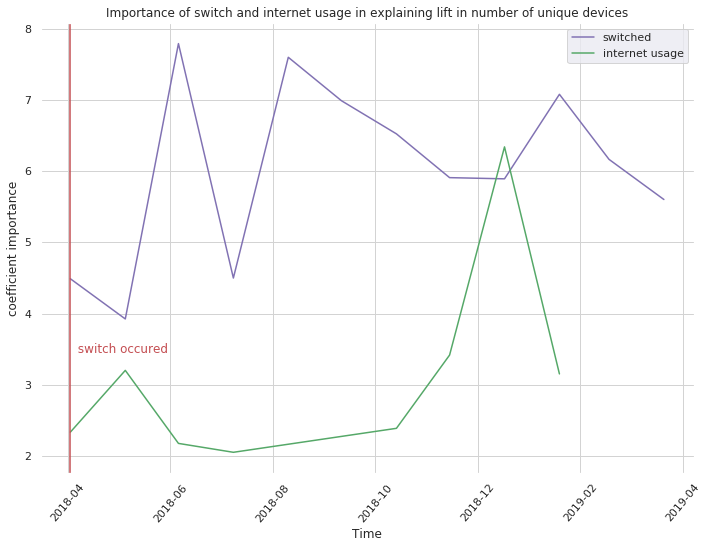
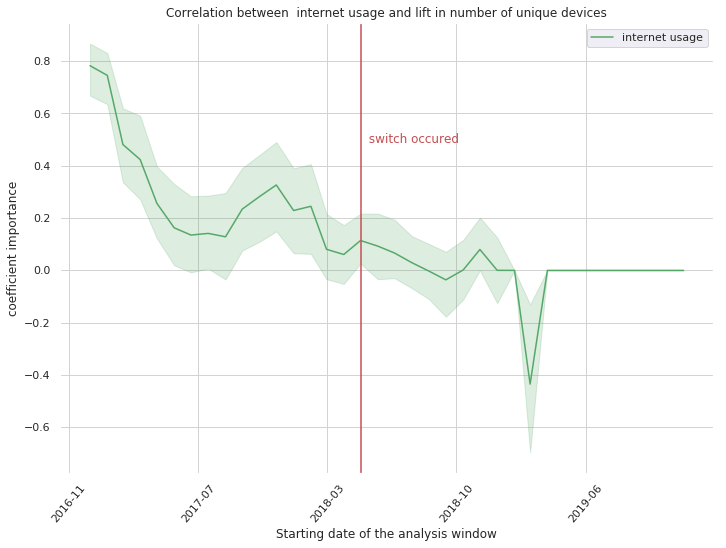
One possible idea is to build, for different time snapshots, a regression model that can tell whether there is a relation between countries Wikipedia usage and data center re-routing.

We will describe each country with the following independent variables:

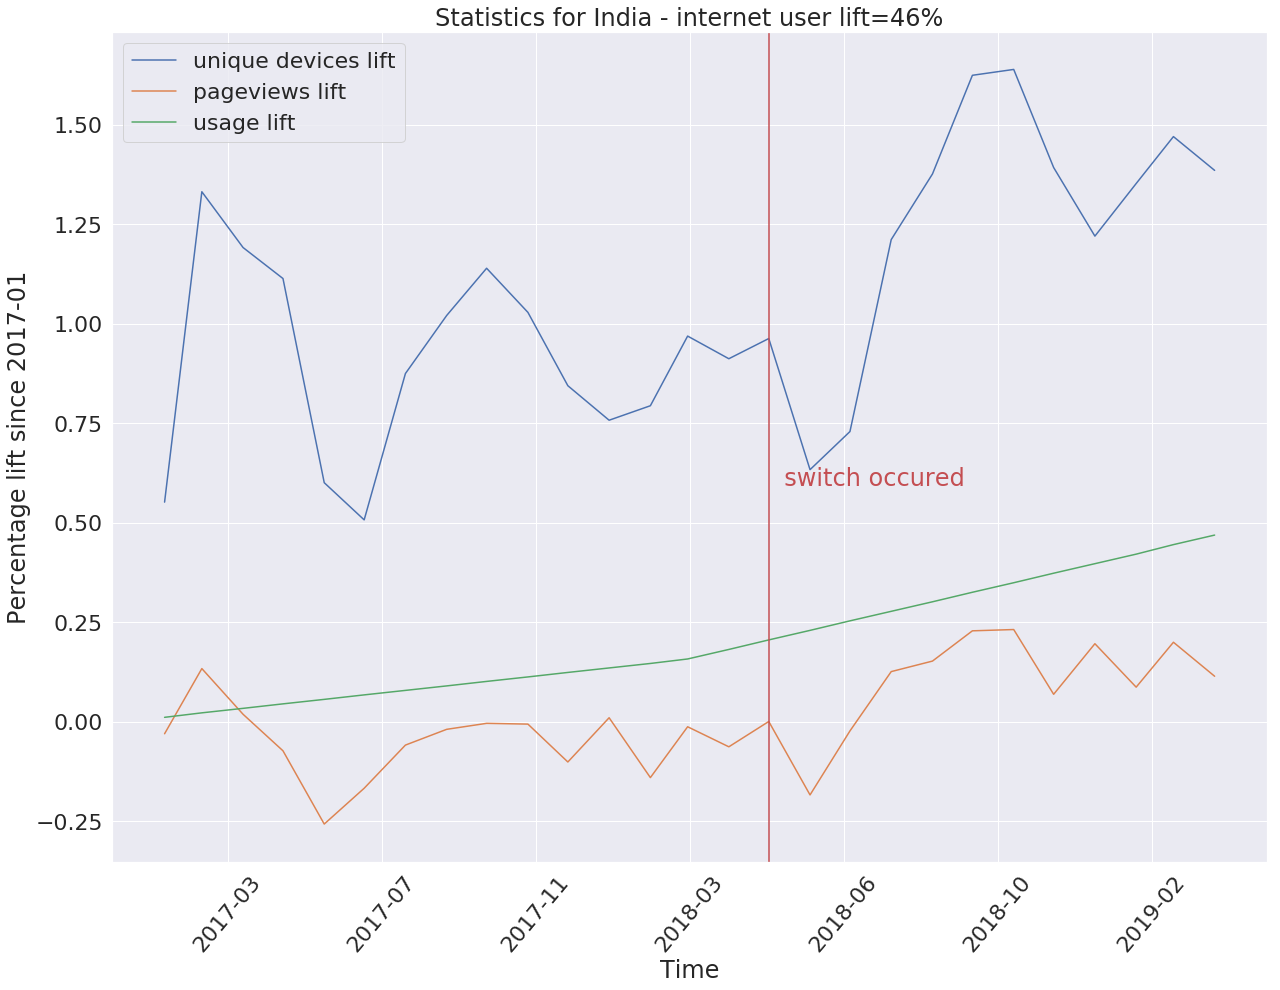
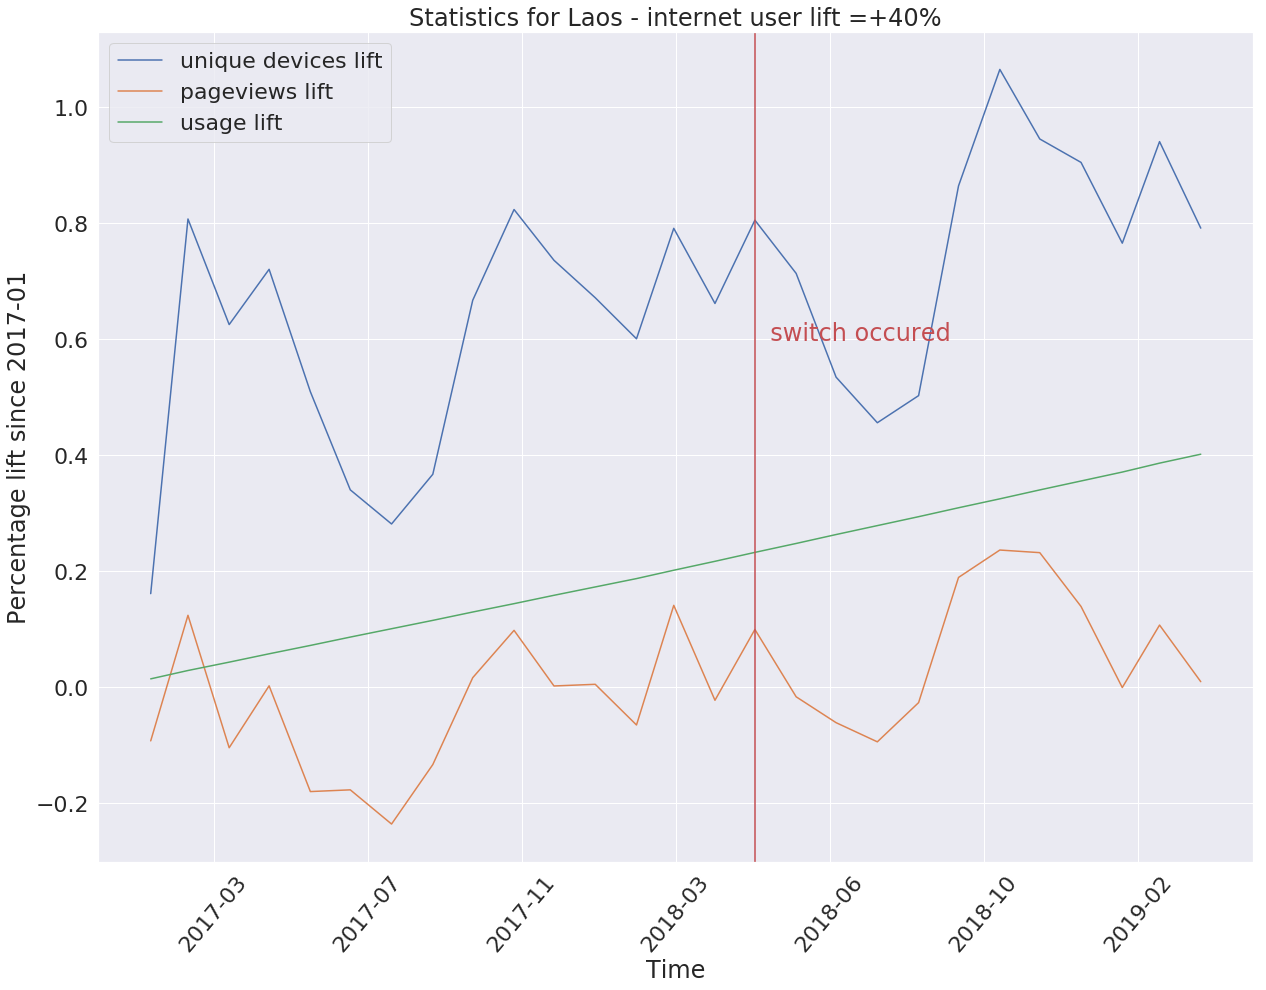
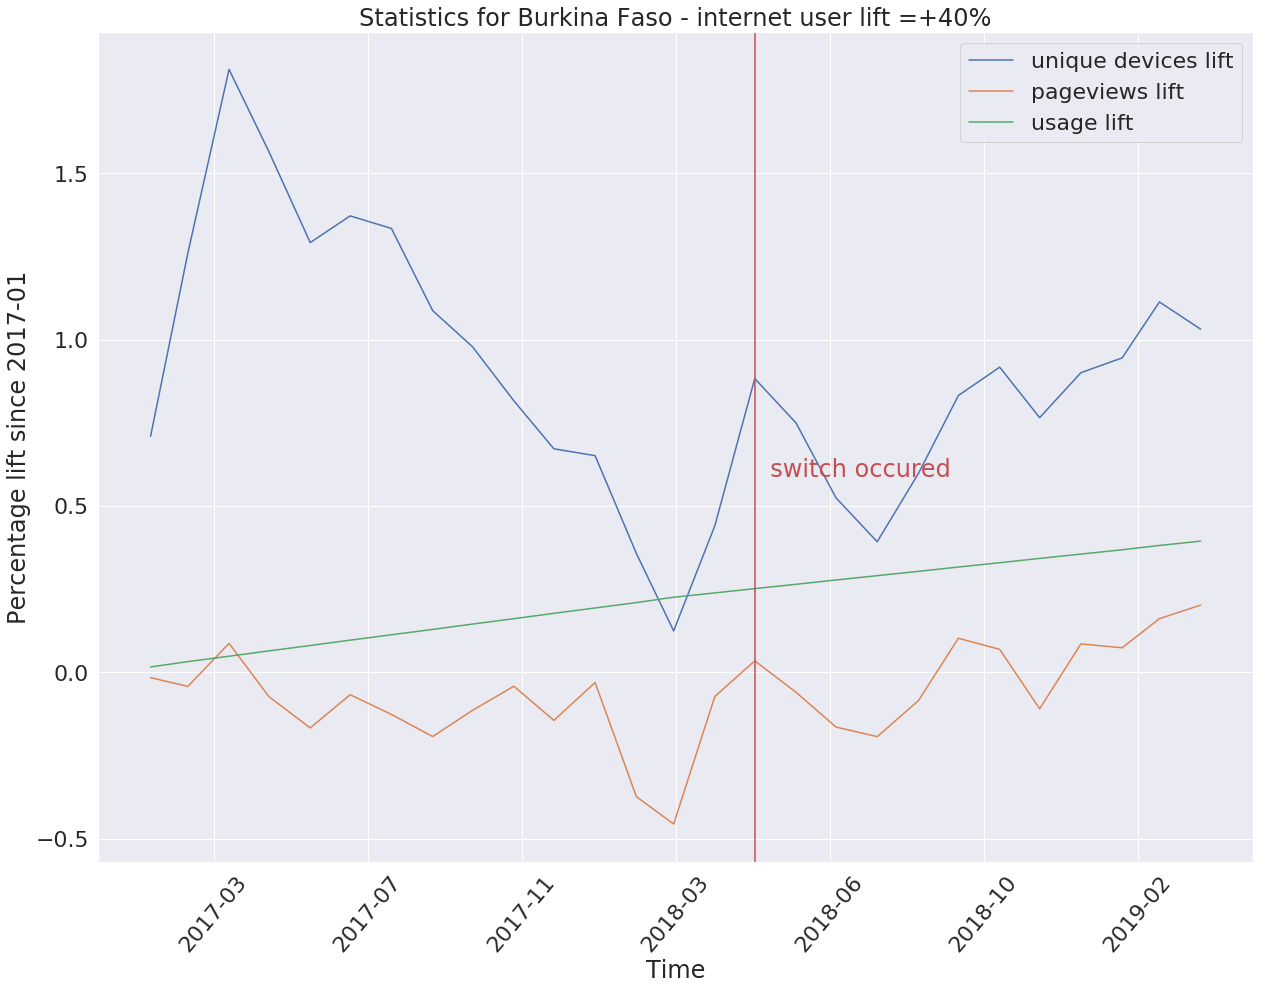
  • Percentage increase of internet users in the country (this is to control for potential increase of unique devices due to overall internet population increase)
  • Percentage increase/decrease of number of monthly unique devices (this is to see the impact on new users)
  • Percentage increase/decrease of number of monthly pageviews (this is to see the impact on pageviews)
  • Percentage increase/decrease of number of monthly pageviews/unique devices (this is to see the impact on reading depth)

The target/dependent variable will be:

  • 0 if the country is not included in the new data center at the time of the snapshot (control countries)
  • 1 if the country has been re-routed at the time of the snapshot (treated countries)

We will plot the significance of each feature over different time snapshots. If engagement-related variables becomes predictive of the target variable after re-routing time, it means that there is a significant relation between the switch to the data center and readers' engagement.

To do this, we will need:

Event Timeline

This looks awesome @Miriam -- just adding more particulars to what I mentioned today:

  • Given that I think there's no great way to control for differences between countries, I still advocate for the approach you're suggesting to keep this to a pretty simple regression analysis. The specific term for what you're describing is difference-in-differences. Here's very simple R example code for how you might run this: https://www.princeton.edu/~otorres/DID101R.pdf
  • For the control countries, you could potentially use all of the countries that were not re-routed to Singapore, but I think I would instead advocate for including just the countries that are physically closest to Singapore but were not re-routed. These countries are more likely to be similar to those re-routed (treated countries) and therefore less likely to be affected by external events that didn't affect the re-routed countries. For example, seasonal effects might mean that countries further from the equator have more pronounced differences in page views month to month. So if you include Canada and Russia and Iceland etc. in the control countries, they might lead you to believe there was a change in page views in the re-routed countries (which are going to be closer to the equator) when in fact it's just that they didn't experience the same shift in weather. Using nearby countries will make it less likely that this (and other external events) confound the data.
  • If you wanted to get more robust, you could pursue the Bayesian approach used by @chelsyx for estimating page views, but I don't think we have the good control data available that we had there, so I expect it would mostly add complexity but not provide any further benefits.

Hey @Miriam , happy to help if you want to try the Bayesian approach :)

Also @MNeisler and @Tbayer has done an analysis about the impact of Singapore Data Center's switch last year: T184677 . I'm not sure if you're addressing the same questions here, but if you want to learn more about the previous analysis, feel free to reach out to @MNeisler .

Thanks @chelsyx ! Yes the questions are somehow similar -- how performance impacts engagement -- and we want perform a robust analysis 1 year after switching to the Singapore data center.

@Miriam - sorry for the slowness!

2-letter ISO country codes, showing the actual UTC turn-up timestamps from DNS repo history, plus a few notes:

  • 2018-03-22 21:03 - SG
  • 2018-03-26 15:12 - ID, MY, VN
  • 2018-03-28 13:36 - HK, PH, JP
  • 2018-03-28 18:37 - BD, LK, NP, PK
  • 2018-03-29 11:26 - IN
  • 2018-04-02 14:33 - BN, BT, CC, CX, KH, KR, LA, MN, MO, MV, TW
  • 2018-04-02 16:00 - Other Asia Pacific (default/non-specific AP locations)
  • 2018-07-19 23:43 - MM, TH, TL (These came much later because had to wait on some WP Zero issues to resolve before we could turn them on)

I've also left out the Oceania conversions (Australia, NZ, and various surrounding islands). Those converted, reverted, and experimented on multiple times circa April - July, and some of those countries are still mapped there, but the latency benefit for Oceania is known to be questionable - some localities actually get worse latency to eqsin than ulsfo, and many of the rest are very borderline benefits. Probably best left out of any broad analysis of the rest of AP.

[edited to remove NC from the 2nd timestamp, as that's off in Oceania as well]

@BBlack Thank you, I'll get back to you with more insights soon!

leila triaged this task as Medium priority.May 21 2019, 2:59 PM
leila edited projects, added Research, Research-consulting; removed Research-2017-18-Q4.
leila moved this task from Backlog to In Progress on the Research board.

Hello! Sorry for the slow response, travels in the middle.

So I did some initial analysis of 2.5 years of traffic data, starting from January 2017.

TL;DR lift in engagement in switched countries is substantial, but seem to be very much related with growth of internet user base, however early results show that the switch might play an important role in this engagement lift.
Disclaimer: the data is fairly small, so further investigation is needed to validate the latest findings.

Longer explanation.

Country selection : treated countries + control countries to compare the findings

  • Treated countries: 27 countries that were switched to Singapore
  • Control Countries: 23 European countries that have always been routed to Amsterdam: [AT, BE, BG, CY, CZ, DK, EE, FI, FR, DE, GR, HU, IE, IT, LV, LT, LU, MT, NL, PL, PT, RO, SK, SI, ES, SE, GB]

Variable selection : engagement metrics + control metrics to compare the findings

  • Engagement Metrics: monthly unique devices counts and monthly pageviews [TODO: ratio between the 2]
  • Control Metrics: number of internet users per country, per year, according to ITU

Data Processing : counts percentage lift
I normalized raw counts data into comparable ranges by calculating the percentage lift of each metric with respect to the beginning of analysis time. So, if in India there were 4 unique devices in 2017/01 (beginning), and 6 unique devices in 2018/05, the value of unique devices for India on 2018/05 will be +50%

Results for Overall Metrics before and after switching time (generally set as April 2018), comparison between treatment and control groups

  • Pageviews There does seem to be a minor overall lift in pageviews since activation time 1 year ago. However as we can see from the plot, pageview counts are heavily subject to seasonality effects, and therefore this lift might not be significant.

lift_pw.png (588×726 px, 92 KB)

  • Unique Devices Counts and Internet Users. Compared to EU countries, countries switched to Singapore have experienced a major lift in unique devices since January 2017 (left plot), and a substantial lift since switching time one year ago. However, most of these countries are also experiencing substantial growth in internet user population (right plot), while European countries' user base growth is relatively steady. So next question is, is the lift in number of unique devices explained by growth of user base only, or is the re-routing playing an important role?

lift_ud.png (548×717 px, 80 KB)

lift_us.png (560×724 px, 50 KB)

  • Country-Specific Examples would suggest that, in some countries (India left, Bangladesh right) readers engagement (number of unique devices) grows steadily after re-routing, despite a modest growth in the number of internet users.

india.png (548×717 px, 48 KB)

bangla.png (548×726 px, 52 KB)

Point-wise Regression Analysis to discover which factors explain the lift in unique devices at each point in time

  • We try to predict, at each point in time after activation, a target variable Uniques, i.e. the lift in unique devices in a given month.
  • We are using 2 independent variables:
    • Internet UsageThe lift in internet users at a given month.
    • Switched A binary variable =1 if the country has been rerouted, or 0 if the country has not been re-routed in that month.
  • We plot the importance of each feature for prediction at different time snapshots. When the switched variables is as or more predictive of uniques than the internet usage variable, it means that the lift in unique devices depends from both variables, and therefore the switch was important to generate this lift.

From the plot below, we can see that both variables are important to predict lift in unique devices, and therefore that the switch plays an important role in the lift of unique devices.

point-wise.png (548×708 px, 48 KB)

Series-wise Correlation Analysis to discover how similar are the curves of internet usage and lift in unique devices over a period of time

  • We try to see how much the time series of Internet Usage can explain the target series Uniques in a given time window, i.e. The similarity between the unique device lift curve and the internet usage curve.
  • We take snapshots of the 2 series at different 1-year time windows, progressively closer to the switching date, and compute the pearson correlation between the two segments.
  • We plot the correlation coefficients for each time window. We see that, for time windows starting much earlier than the switching date, the internet usage variable is the highly correlated with number of unique devices, As the time window starts narrowing towards the activation date, the coefficient becomes lower, and the unique device lift curve after activation date becomes less similar to the internet usage line. This suggests that around activation date, there is another factor influencing the shape of the unique device lift curve.

correlation.png (548×726 px, 49 KB)

@BBlack does the above help? Happy to steer the analysis in other directions if needed.

@leila FYI :)

@chelsyx maybe we can look at the time series analysis if you have time?

@Miriam Thanks for doing this analysis. Based on what we discussed on Thursday, it would be great if you can look at some of the South American countries with internet growths similar to Asia and see if the patterns you see (for unique device growth) can be similarly explained. If the patterns are different, we have a conclusion to make here with some modest signals.

Also, one more suggestion, this data (just like all the data we have related to pageviews, is affected by bots). You might want to look at unique_devices (underestimate) rather than the total, this number is less affected by bots, as only bots that might accept cookies are counted in this measure, and it also speaks as to the number of "returning sessions" to the site (i.e. people that were looking at wikipedia on tuesday that also come to browse on a thursday).

More info on this here: https://wikitech.wikimedia.org/wiki/Analytics/Data_Lake/Traffic/Unique_Devices/Last_access_solution#How_we_are_counting:_Technical_explanation

HI @leila, according to what we discussed, some further analysis below.

Here, I considered 4 groups of countries with different internet usage rate increase: European countries, African countries, South American countries, and all countries affected by Singapore switch. I also followed @Nuria's suggestion to use the _underestimate values.
What we see from the plots below is that, despite the internet user rate increases faster in African countries (green) than Singapore areas (red), the relative lift in unique devices after switch is greater in Singapore than in African countries.

lift_us_4groups.png (990×1 px, 140 KB)
lift_ud_4groups.png (990×1 px, 271 KB)

Here are some pairwise comparisons of countries with similar internet usage lift between 2016 and 2018, in terms of pageviews and unique devices counts - left is Singapore area, right is Africa or South America - in most cases, we see countries in Singapore area maintaining a steady lift of unique devices after switch occurred, unlike countries in other groups:

india0.png (990×1 px, 116 KB)
malawi0.png (990×1 px, 120 KB)

Laos1.png (990×1 px, 124 KB)
burkina1.png (990×1 px, 109 KB)

nepal2.png (990×1 px, 112 KB)
paraguay2.png (990×1 px, 121 KB)

taiwan3.png (990×1 px, 99 KB)
peru3.png (990×1 px, 131 KB)

Hope this helps!

Other than looking at seasonality I cannot think of any further suggestions.

@Miriam, thanks for expanding the analysis in T222078#5216328 . You and I talked about the results you have in this task and what recommendations we can have based on what we have learned from this analysis. I'll summarize them below:

  • We see a significant and sustained lift in Wikipedia unique device count in countries that are served via Singapore data-center after the switch.
  • We have done extensive (relative to the availability of data as well as hypotheses for what can explain the lift beyond the data-center switch) analysis to assess whether the lift in unique device can be explained by factors other than data-center switch. One explaining factor for the lift could be general internet usage increase in the region: as more people in the region served by Singapore data-center become connected (via internet), we expect to see more unique devices on Wikipedia (whether we would switch the traffic to Singapore data-center or not). What we observe is that the increase in connectivity alone does not explain the lift in unique device count in countries whose traffic is now served via Singapore data-center. Eliminating internet connectivity as a cause, and given that there are no other hypothesis about other causes for the lift, we can more confidently say the data suggests that the switch has been responsible for sustained unique device increase in countries served by Singapore data-center.
  • An equally important point we discussed: the nature of this research is such that establishing causality will require A/B testing over a long period of time before the switch is implemented on all possible regions. Doing A/B testing over a long period of time and keeping a subset of users in a worse experience bucket (in terms of performance) when we could switch them to a better performance experience can raise potential ethical questions (something I know BBlack is quite aware of) that need to be considered before making a decision whether such a study should be performed. I'm hoping that the result of the current analysis can provide enough knowledge that we won't need to do more extensive A/B testing in the future, but @BBlack if that kind of experiment is needed, you know where to find us. :)

@BBlack I'm going to move this task to Done on our end and will Resolve it in a couple of weeks. If it's resolved on your end, feel free to close it earlier. If you have pending questions, let us know by 2019-06-15.

@leila and @Miriam - Thanks for all the hard work here, it's truly outstanding the depth to which this analysis already goes, and it puts some useful numbers on the impact of expanding our edge network into under-served regions.

Thanks again!