Page MenuHomePhabricator

Measure impact of Singapore data center on Wikimedia usage
Closed, ResolvedPublic

Description

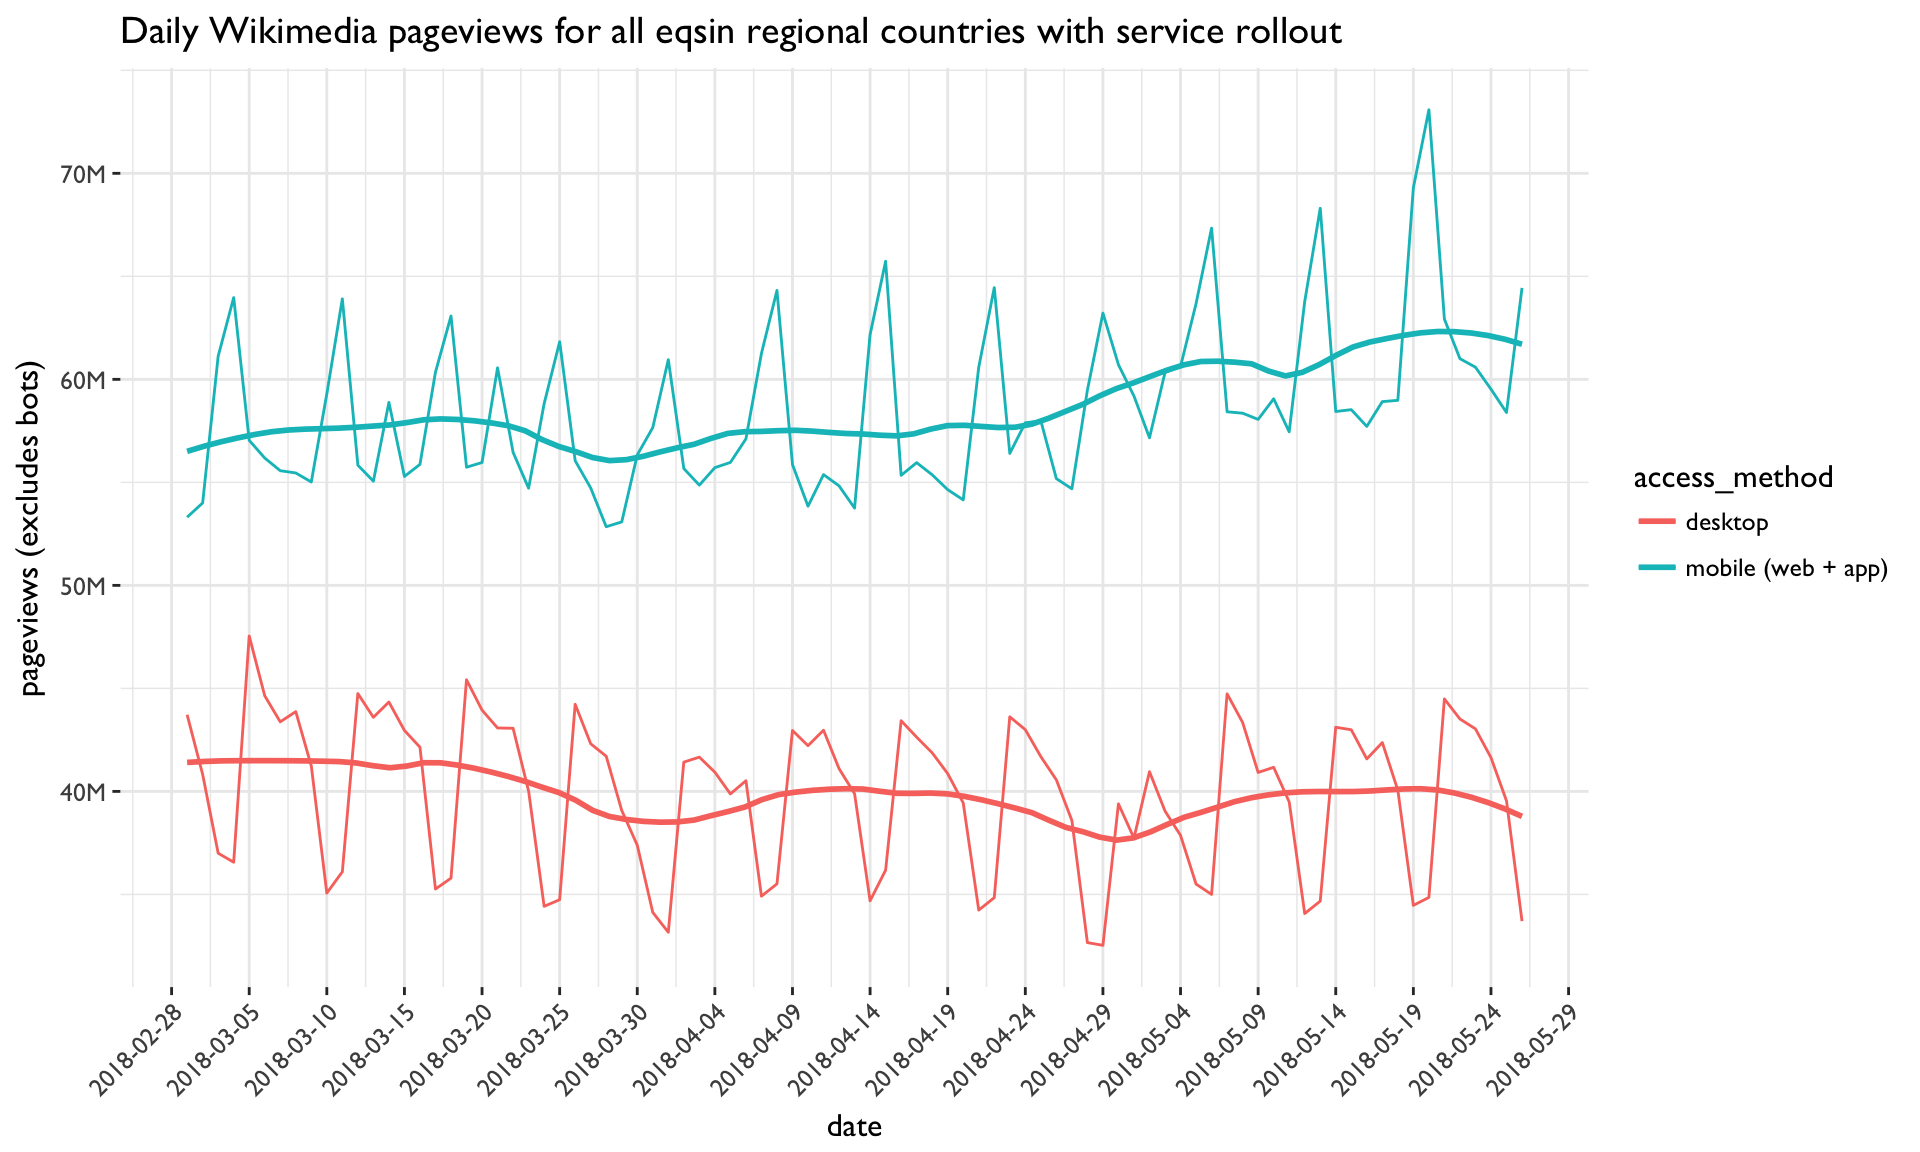
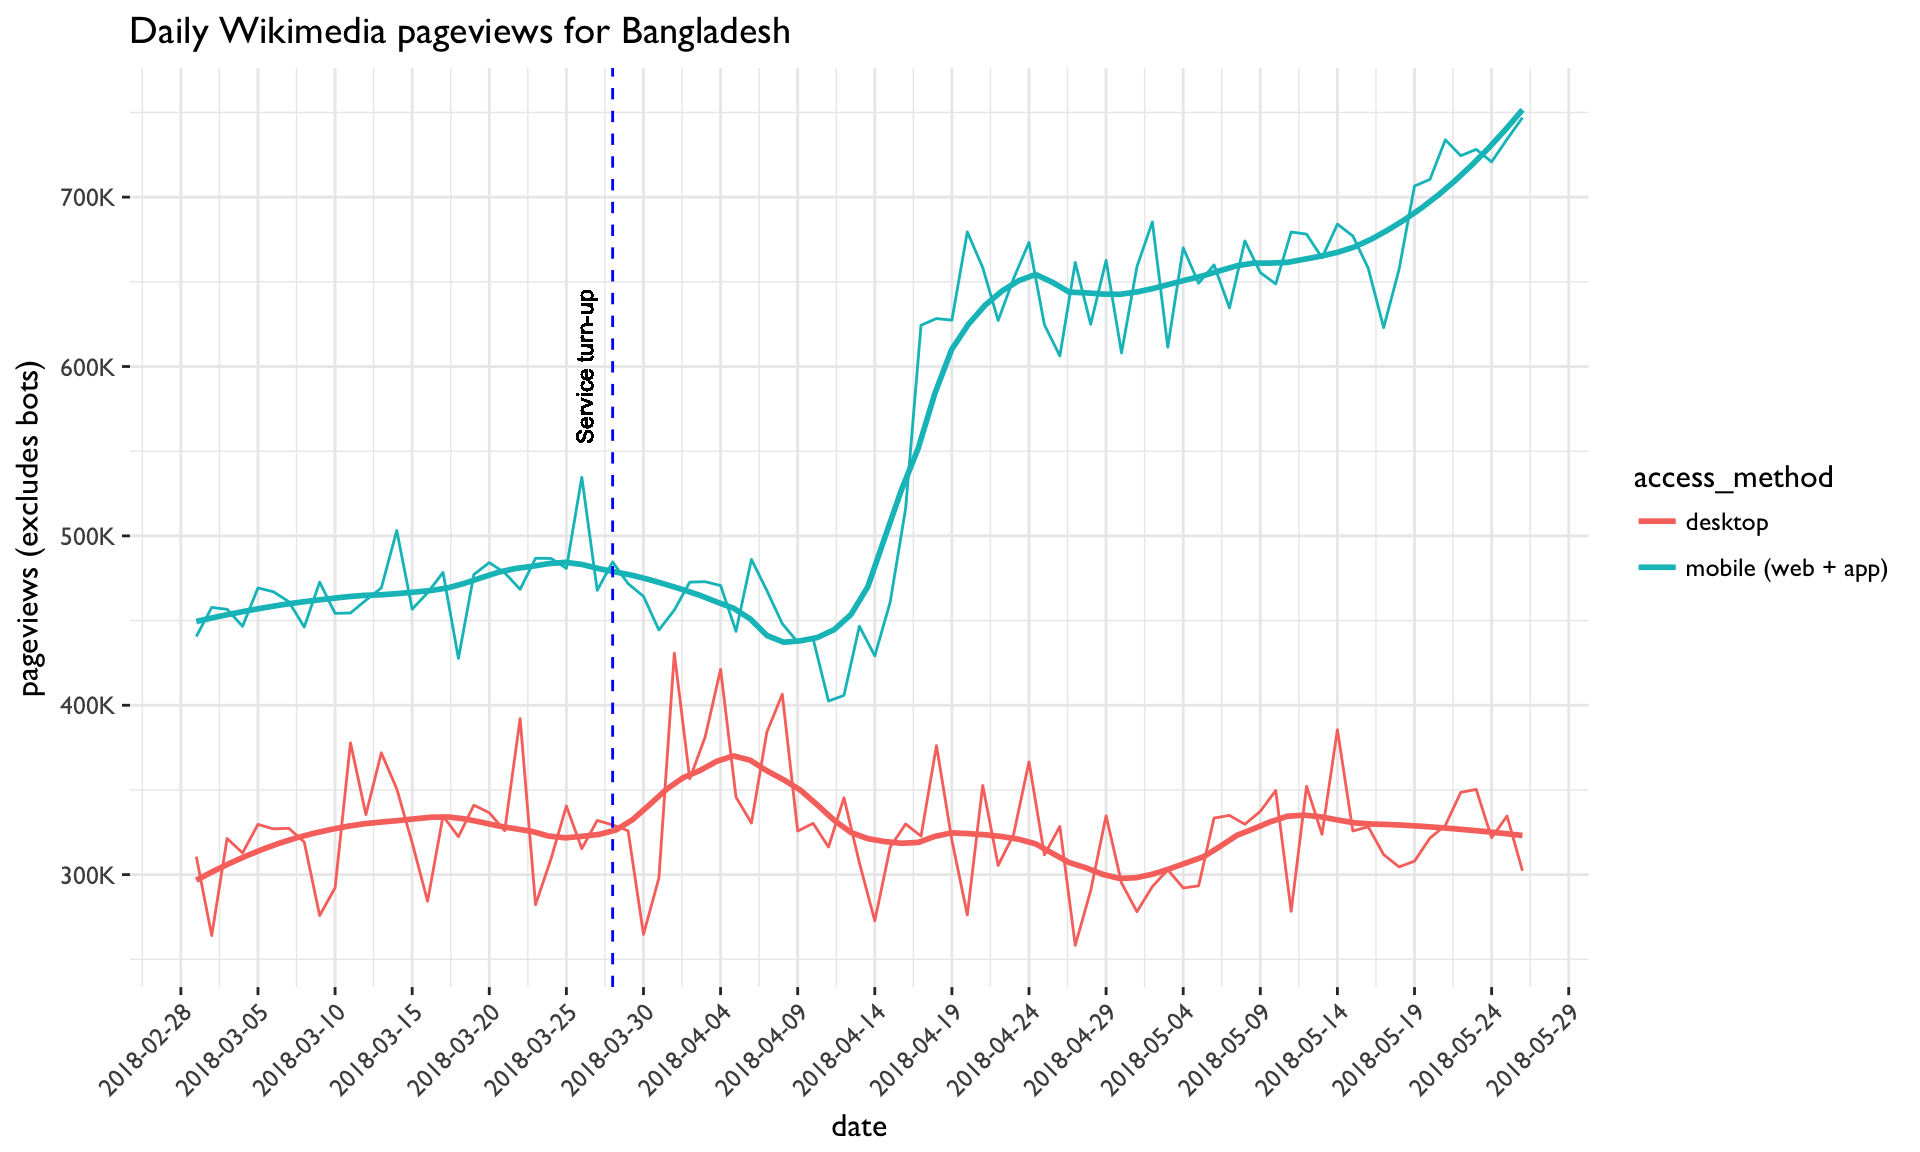
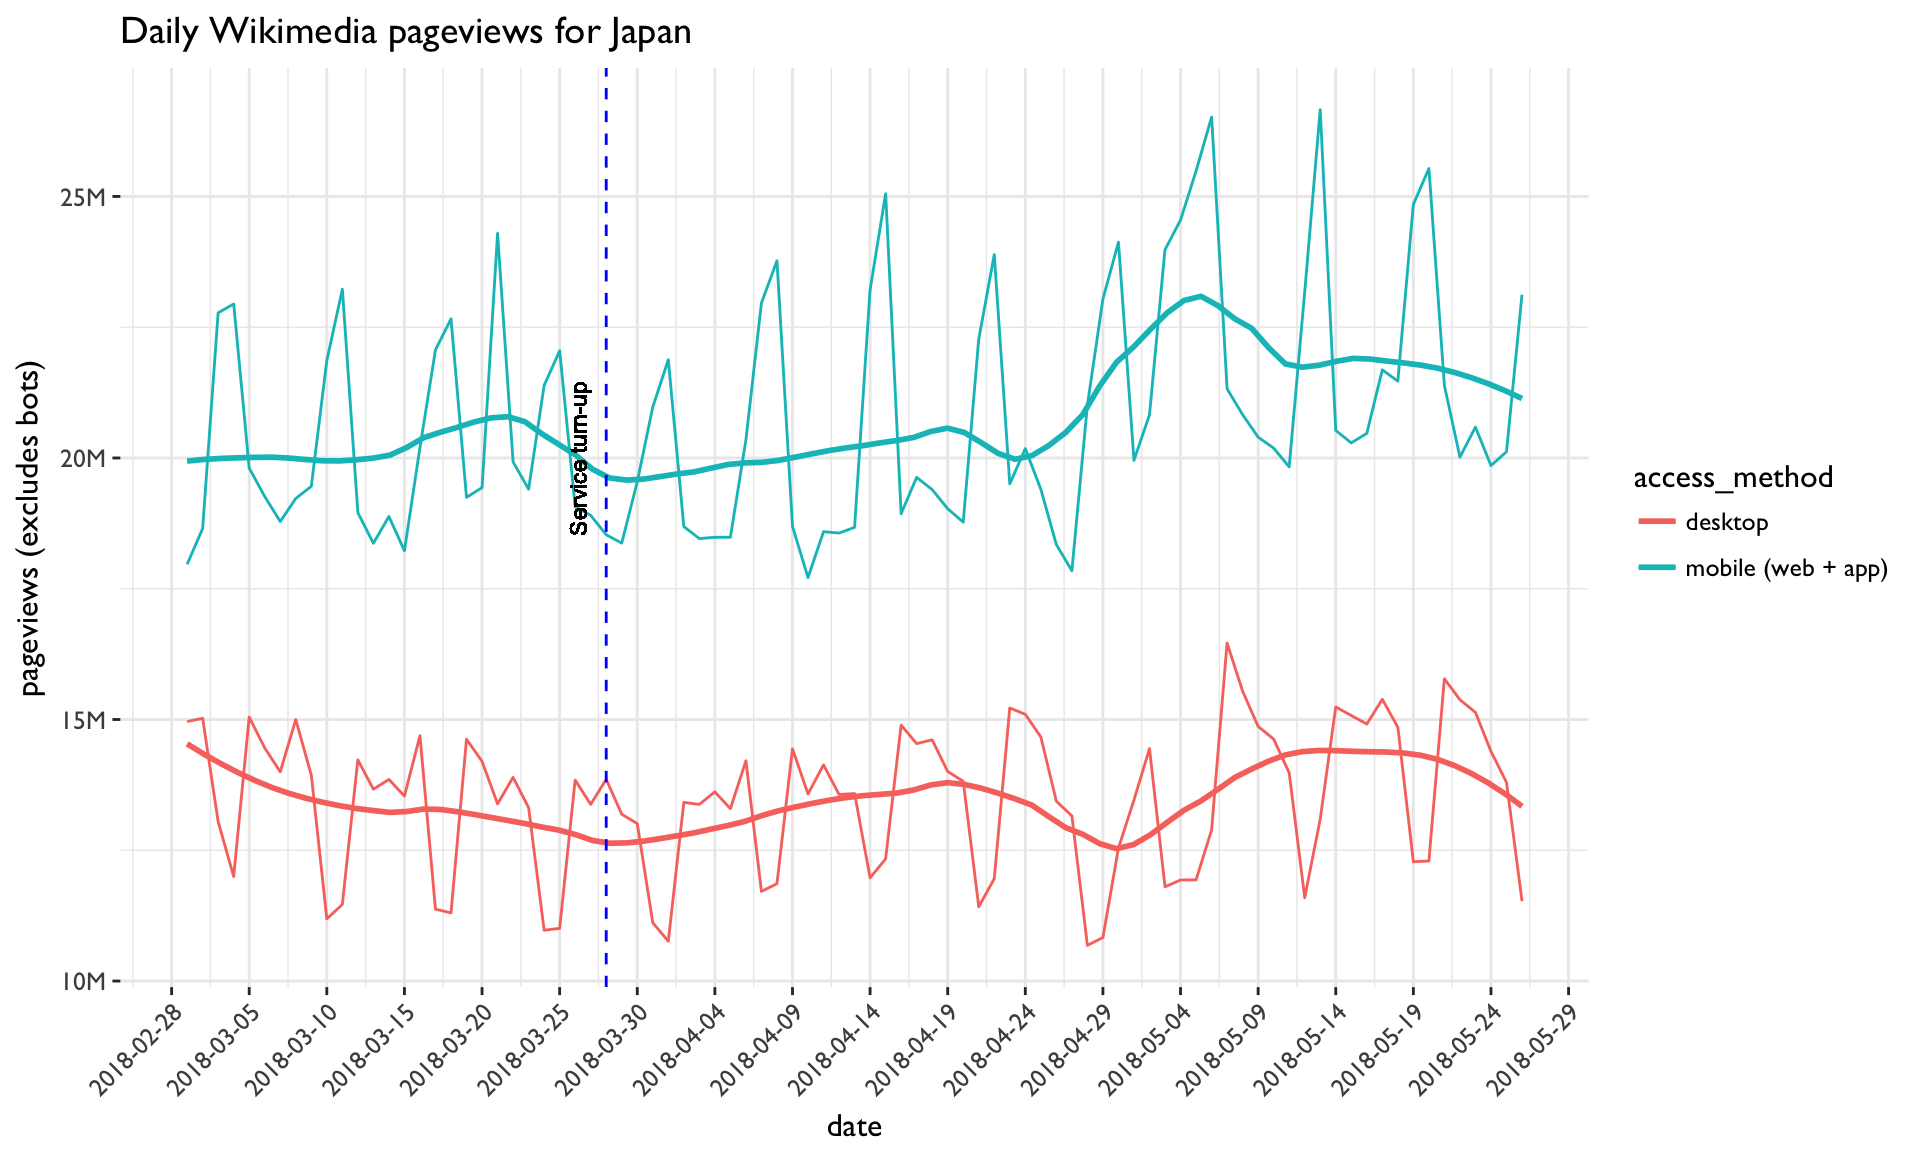
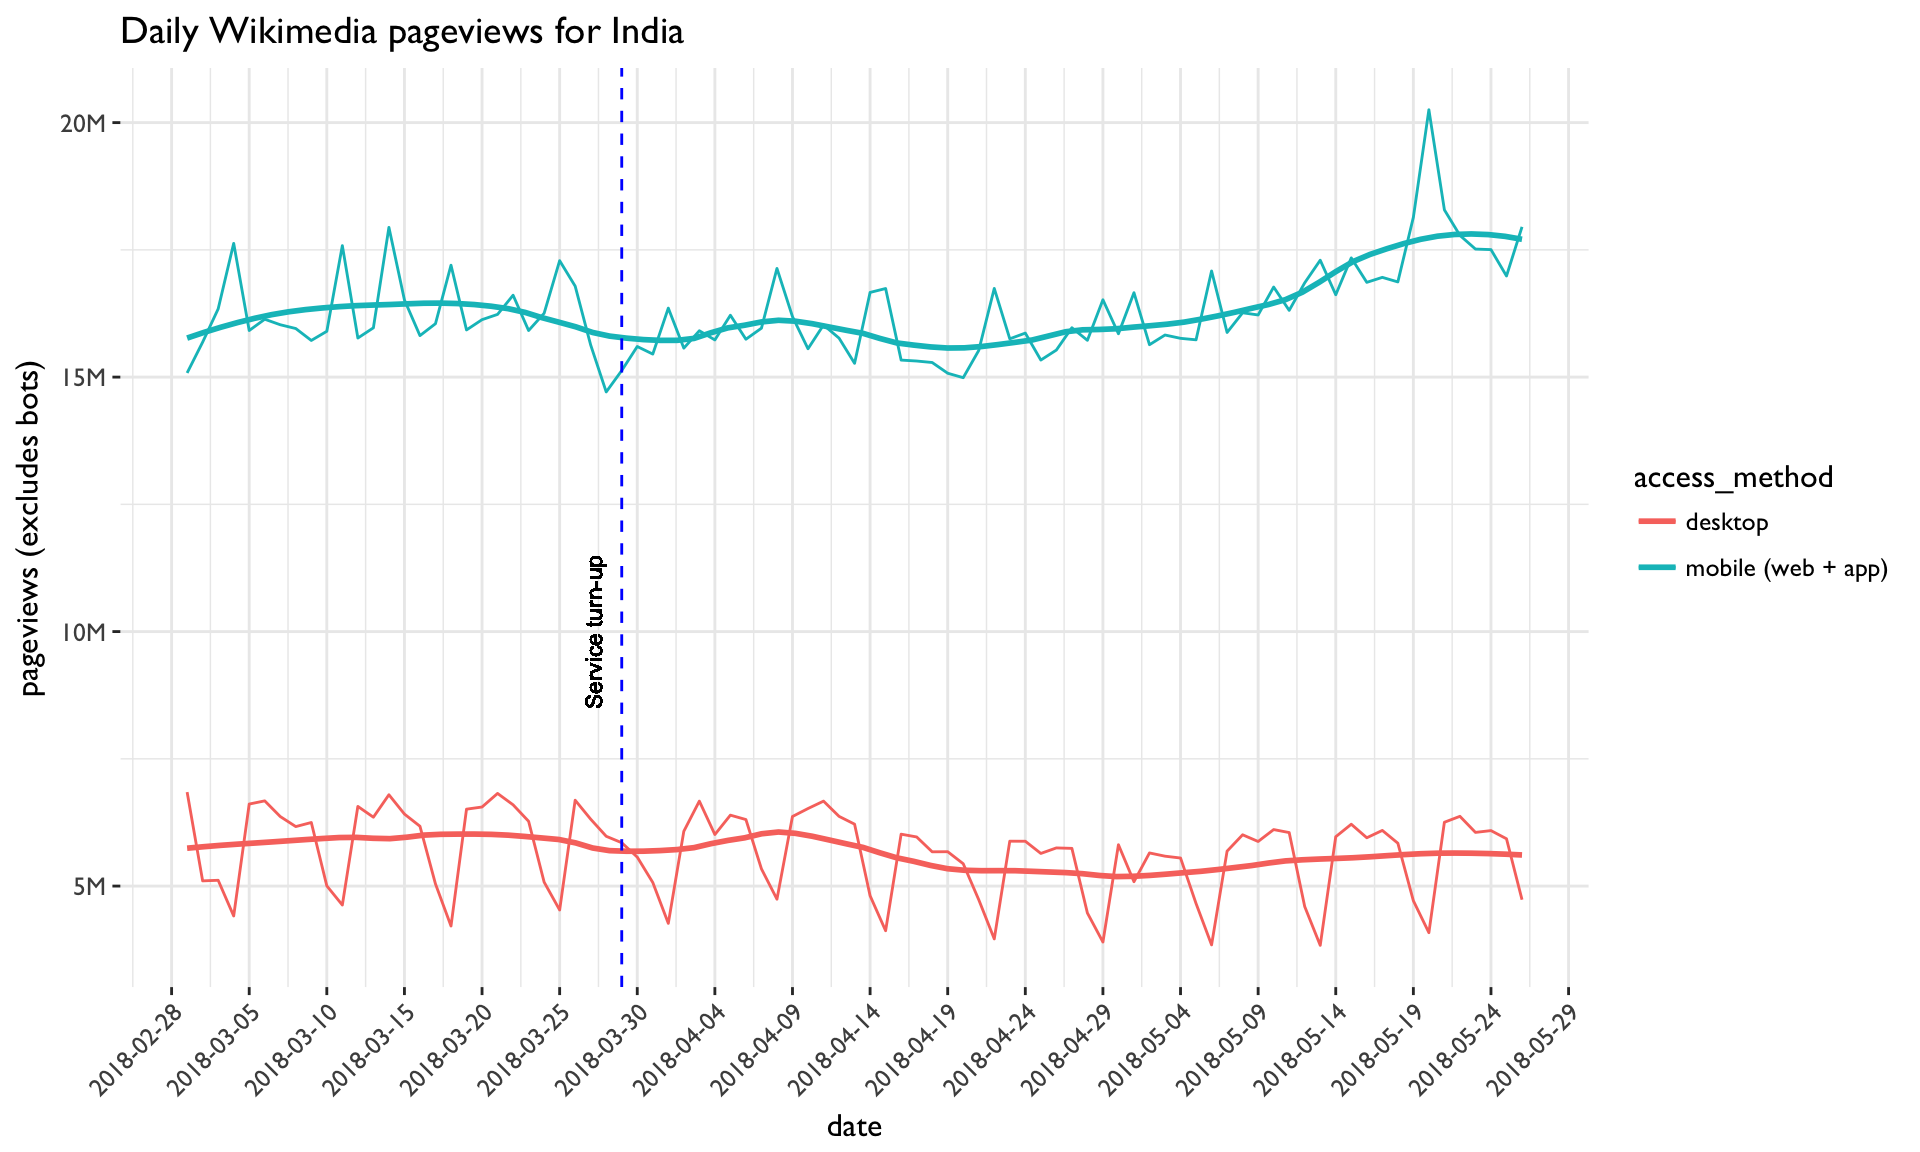
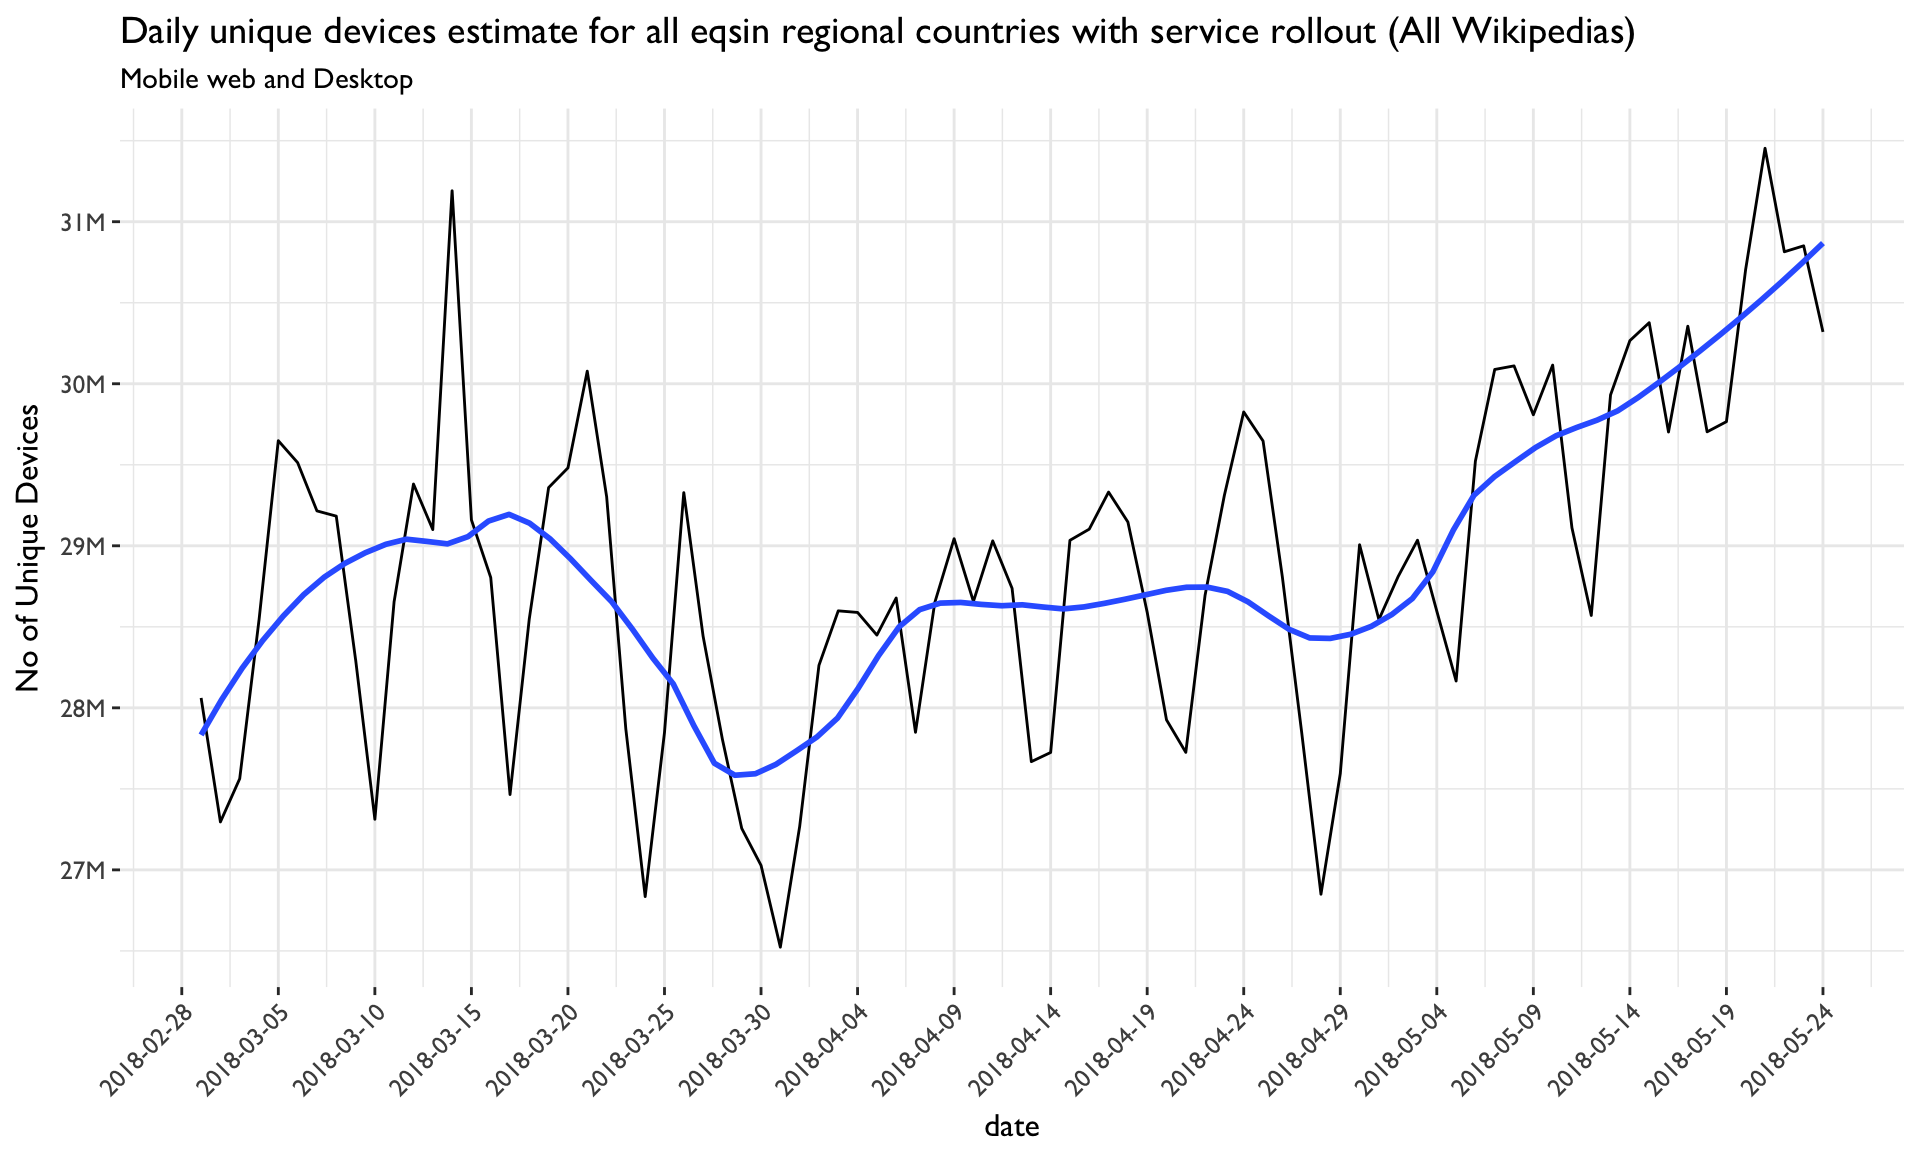
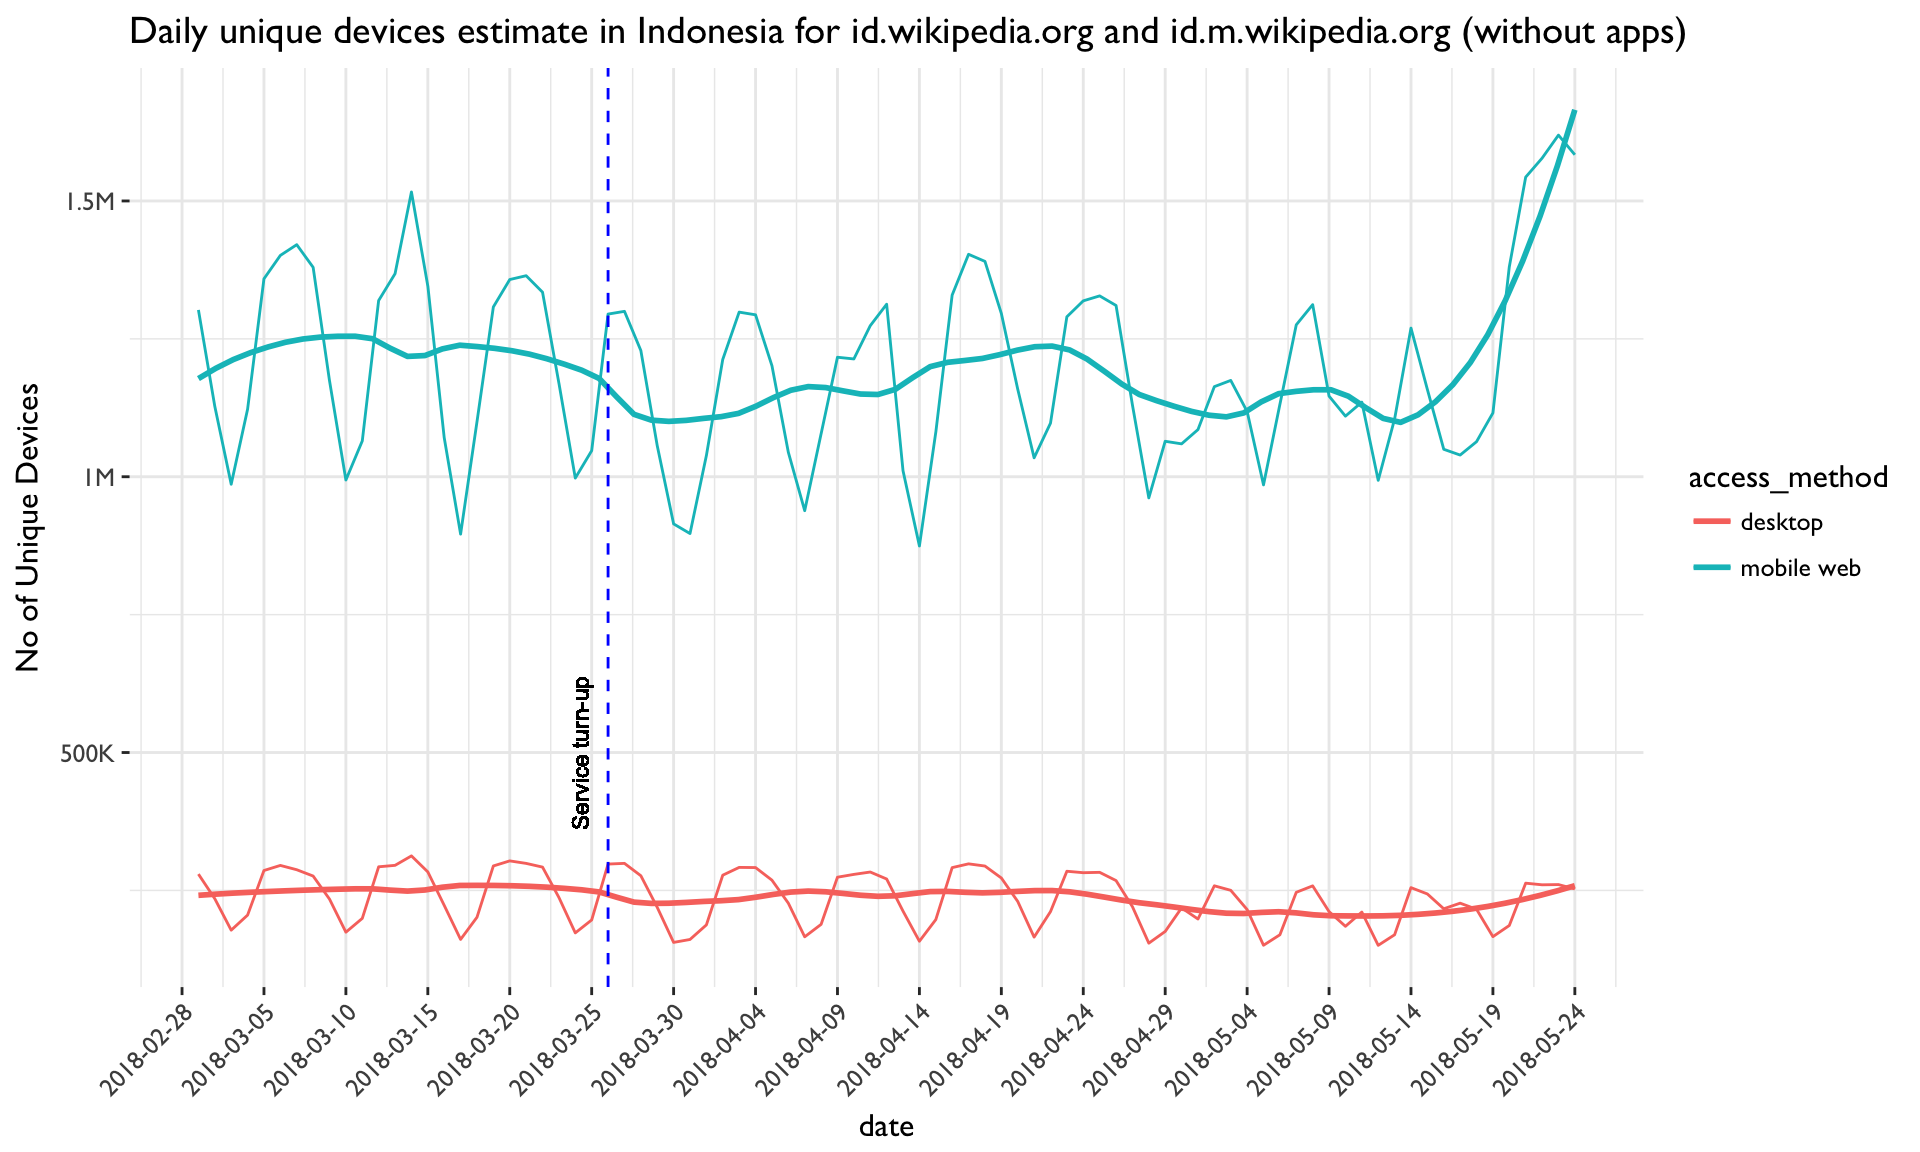
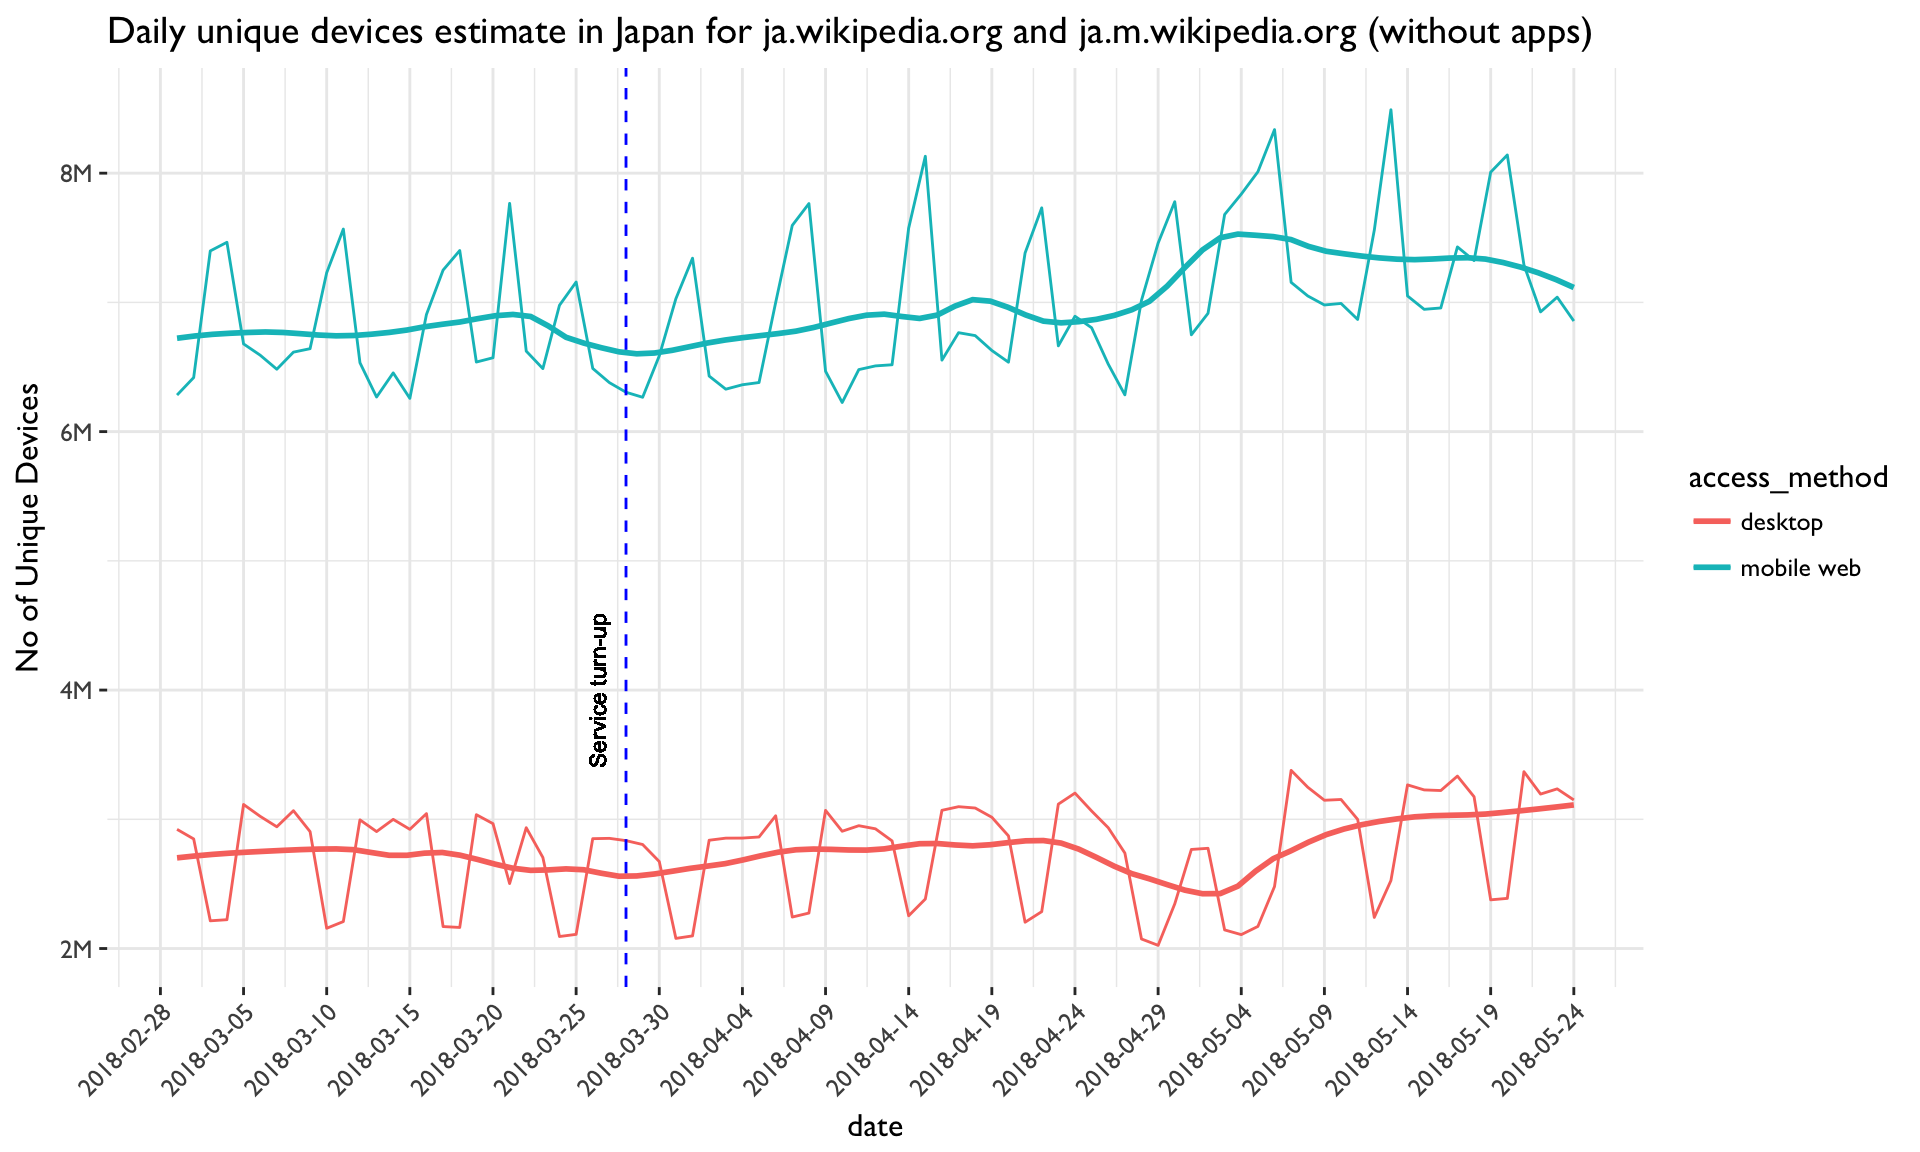
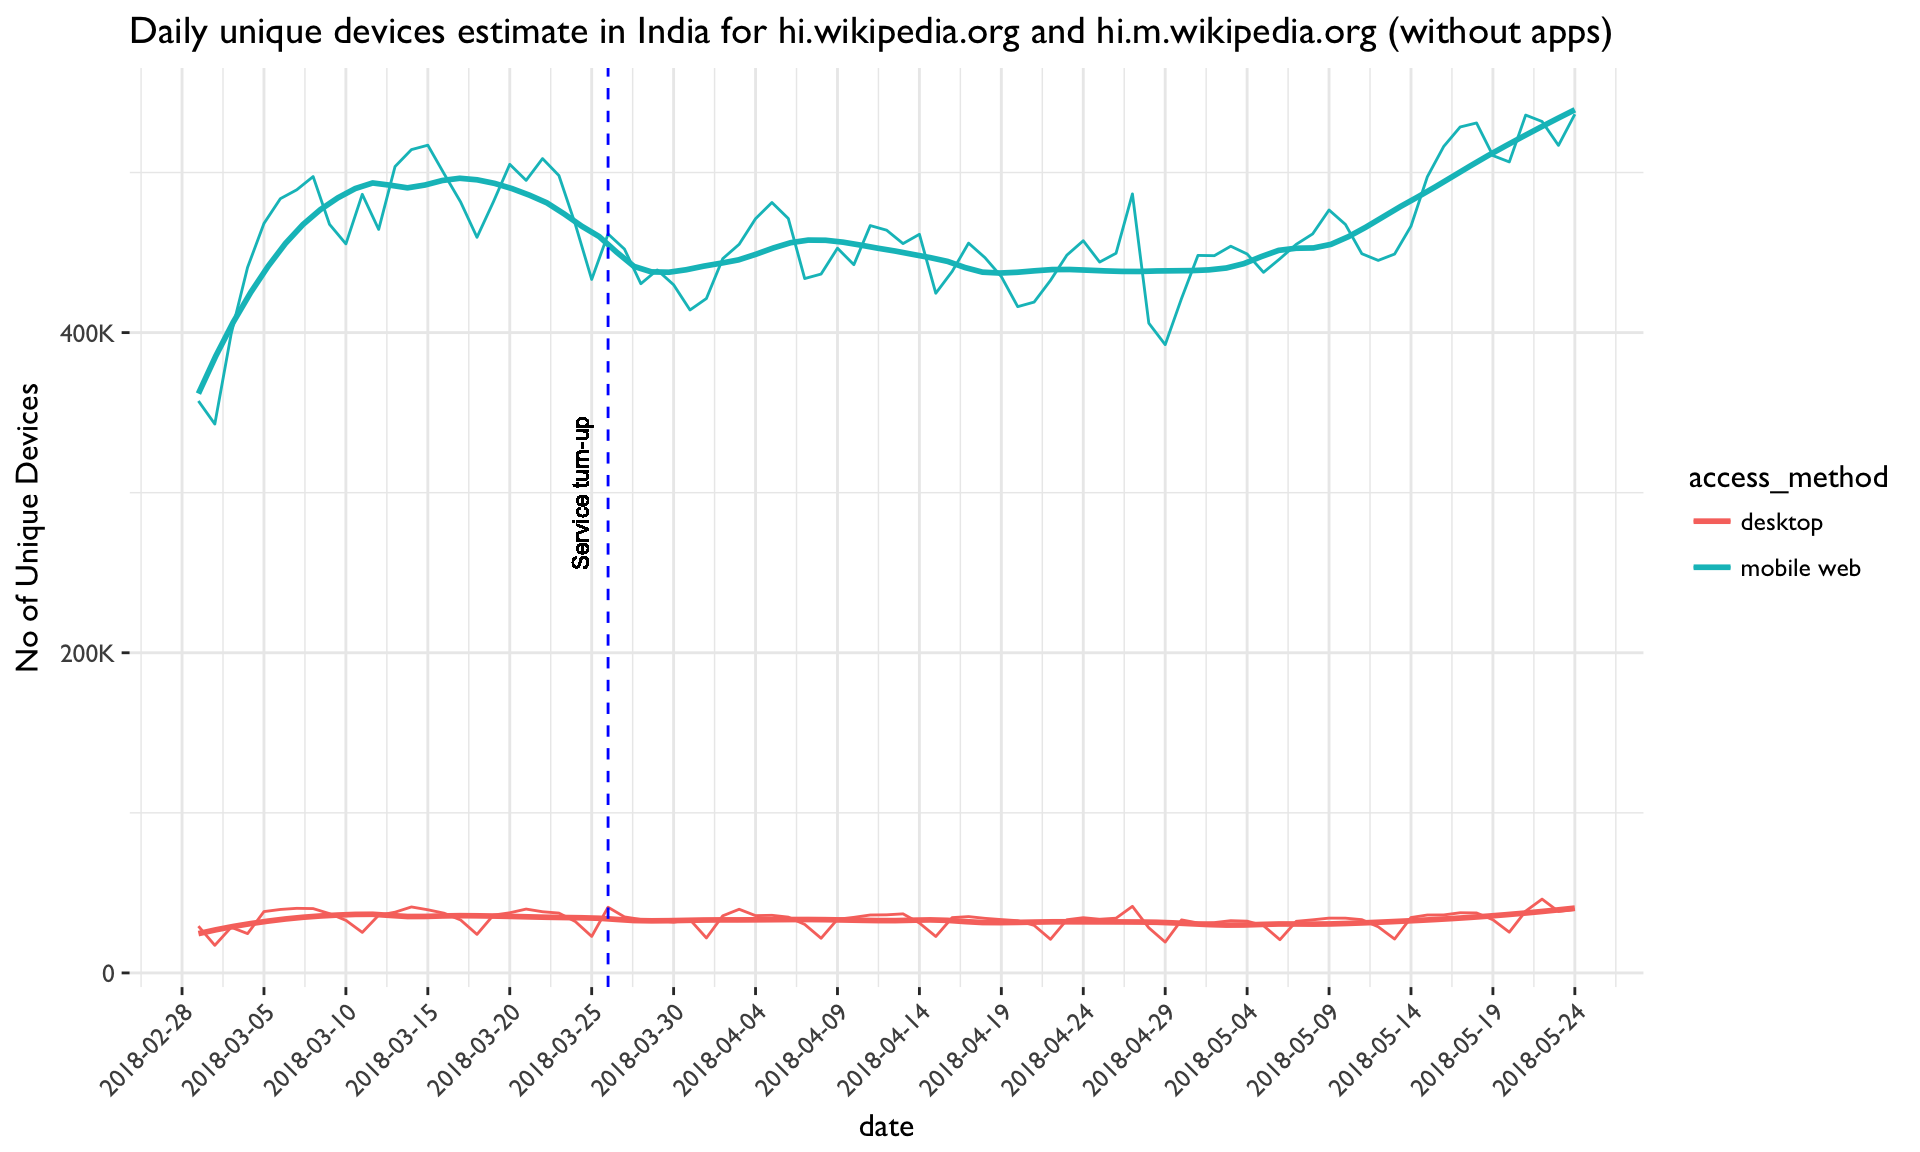
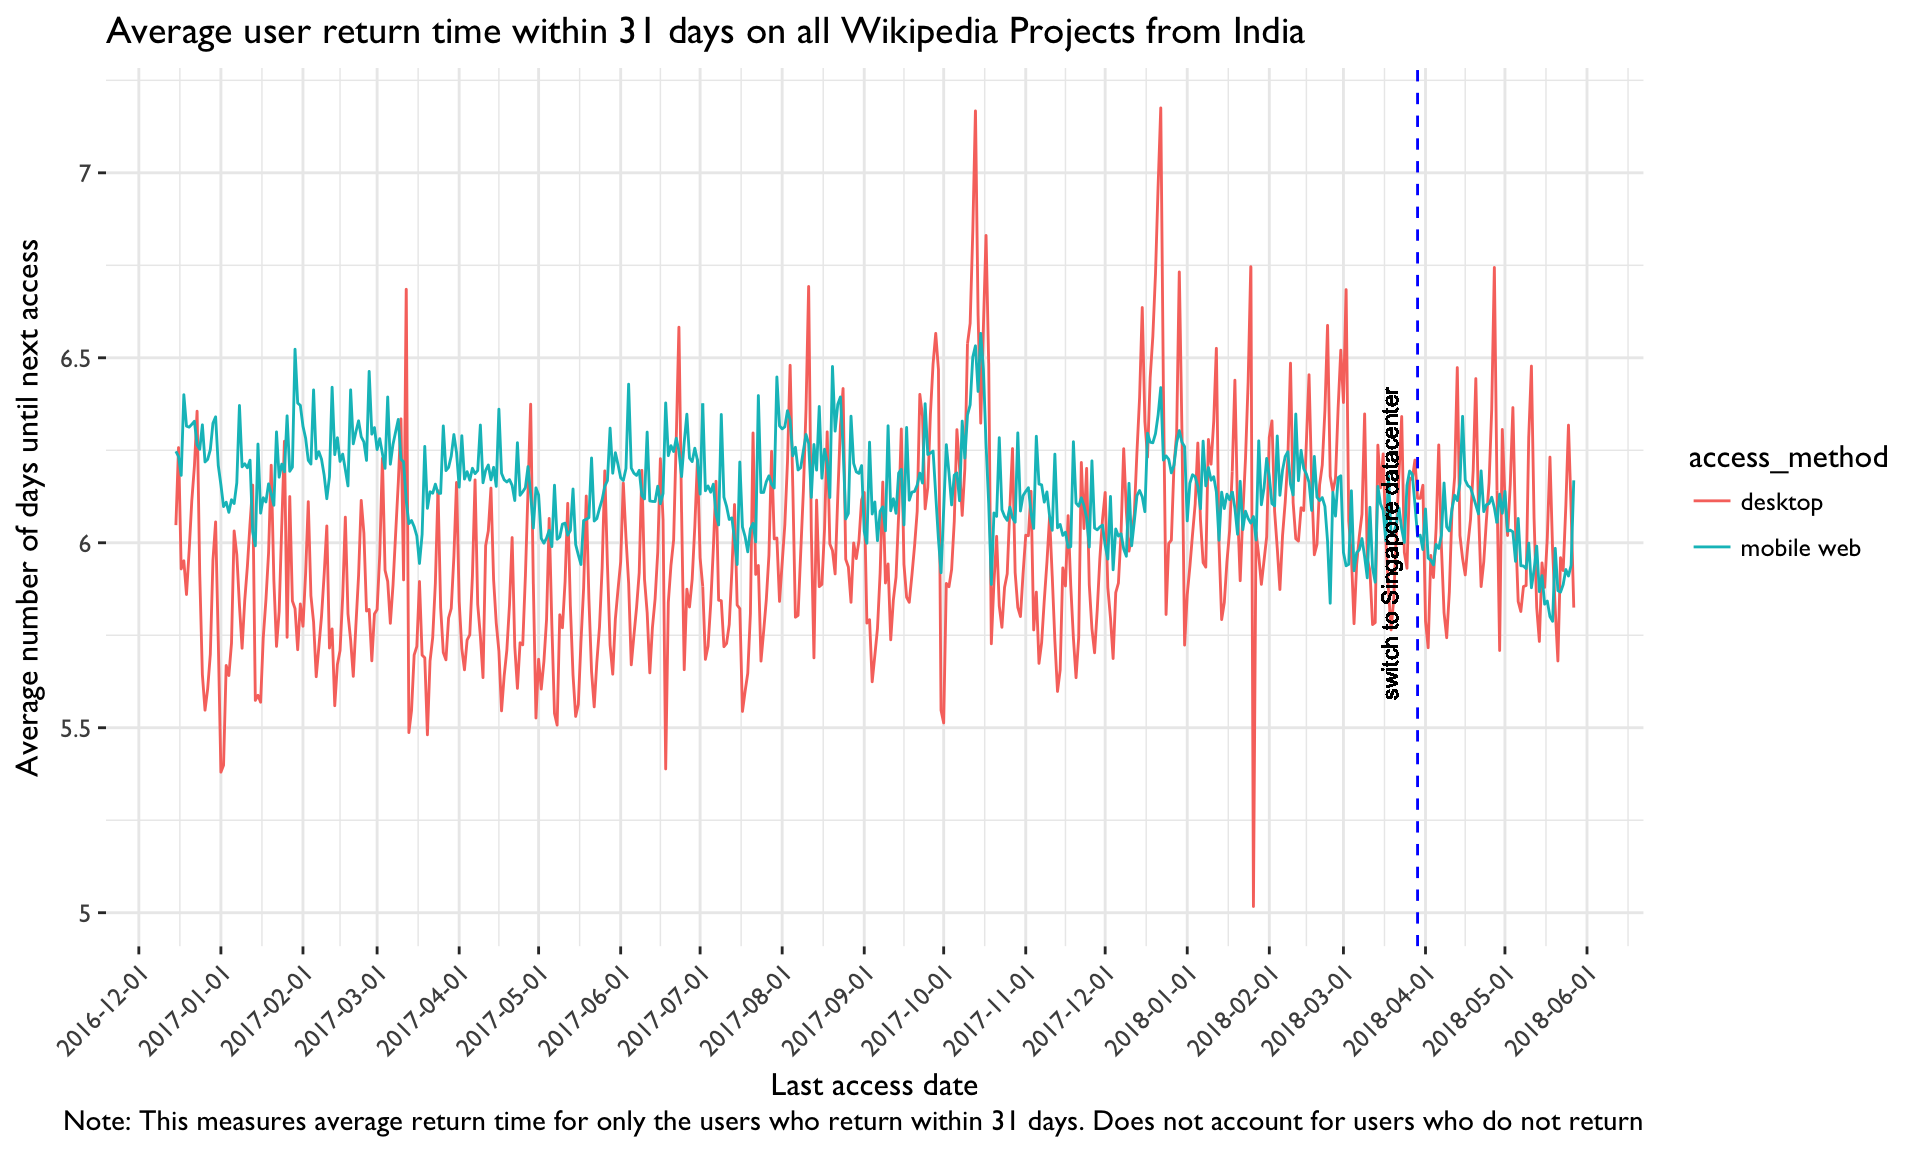
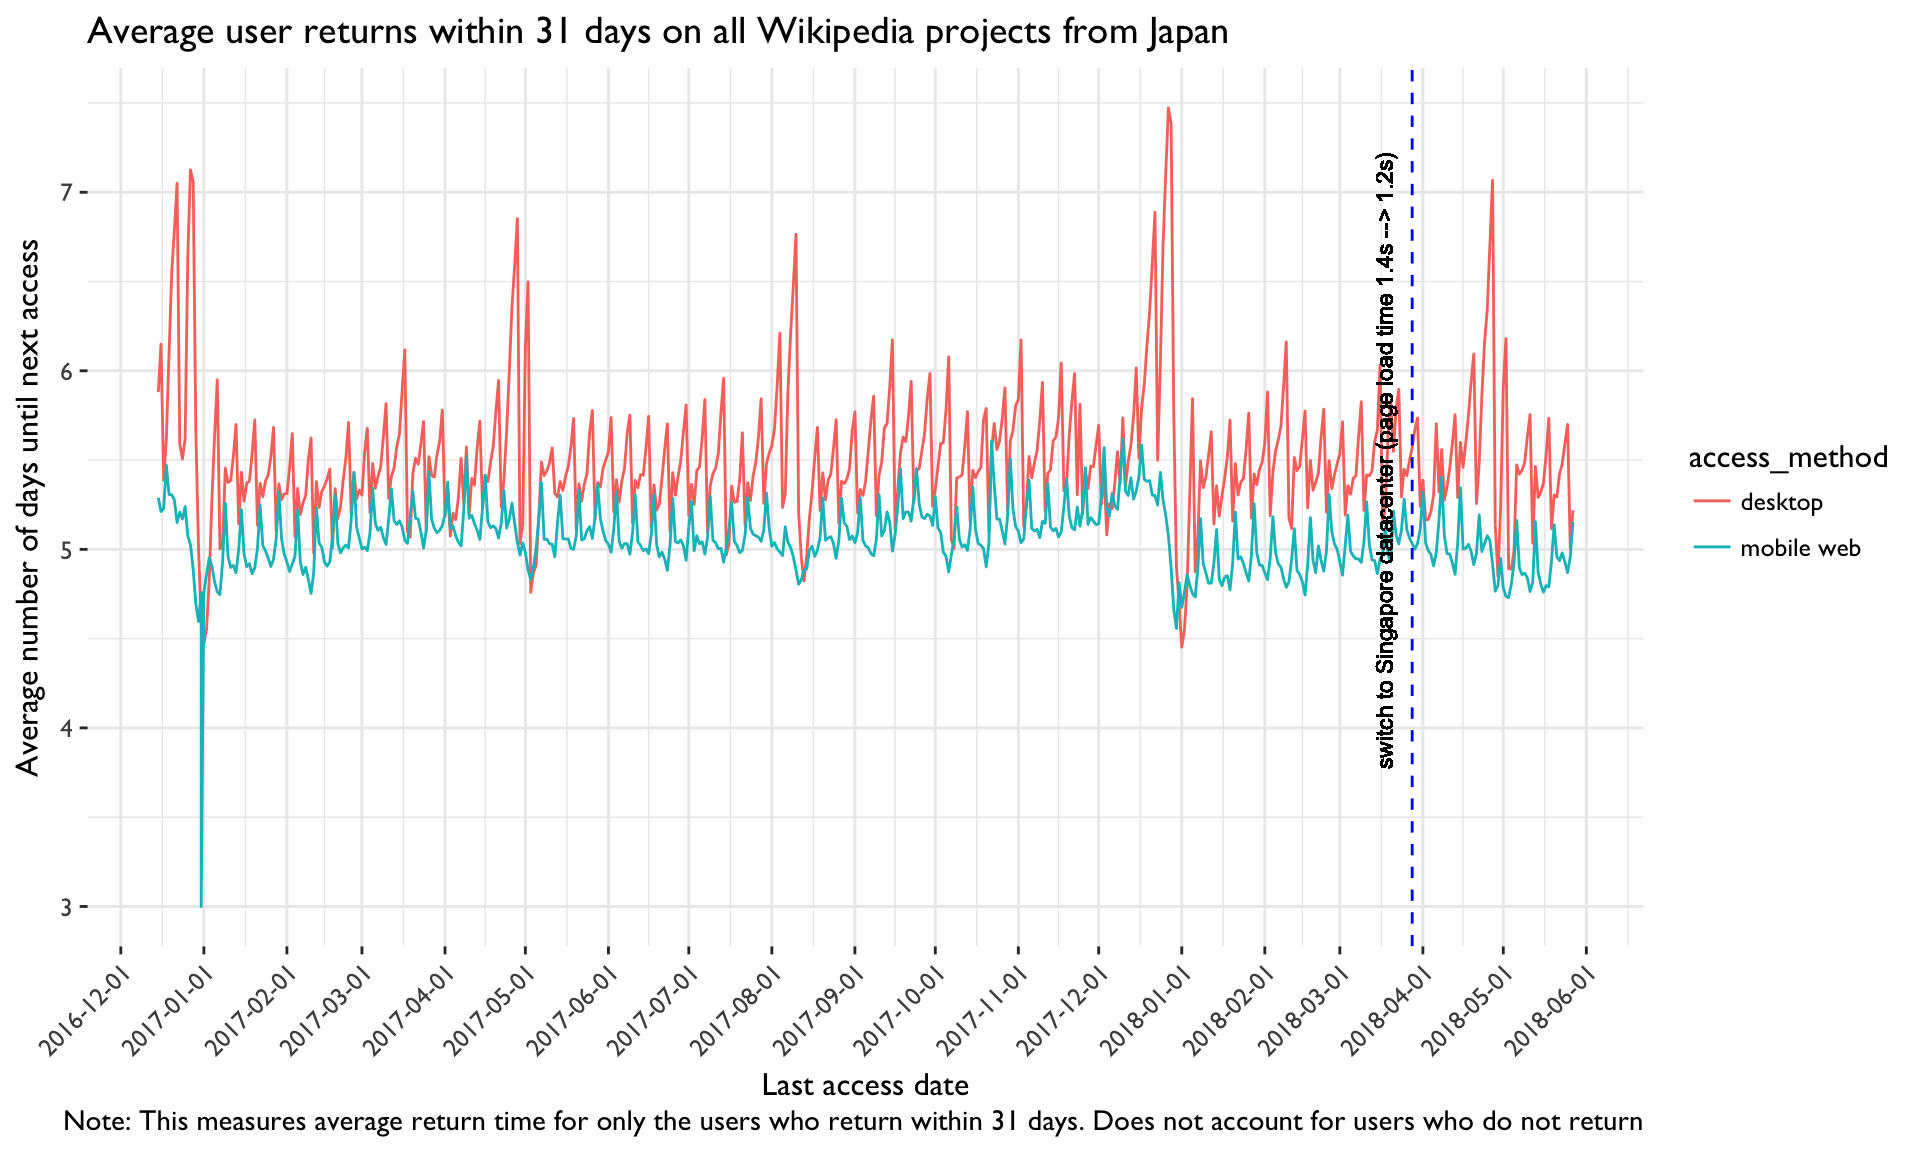
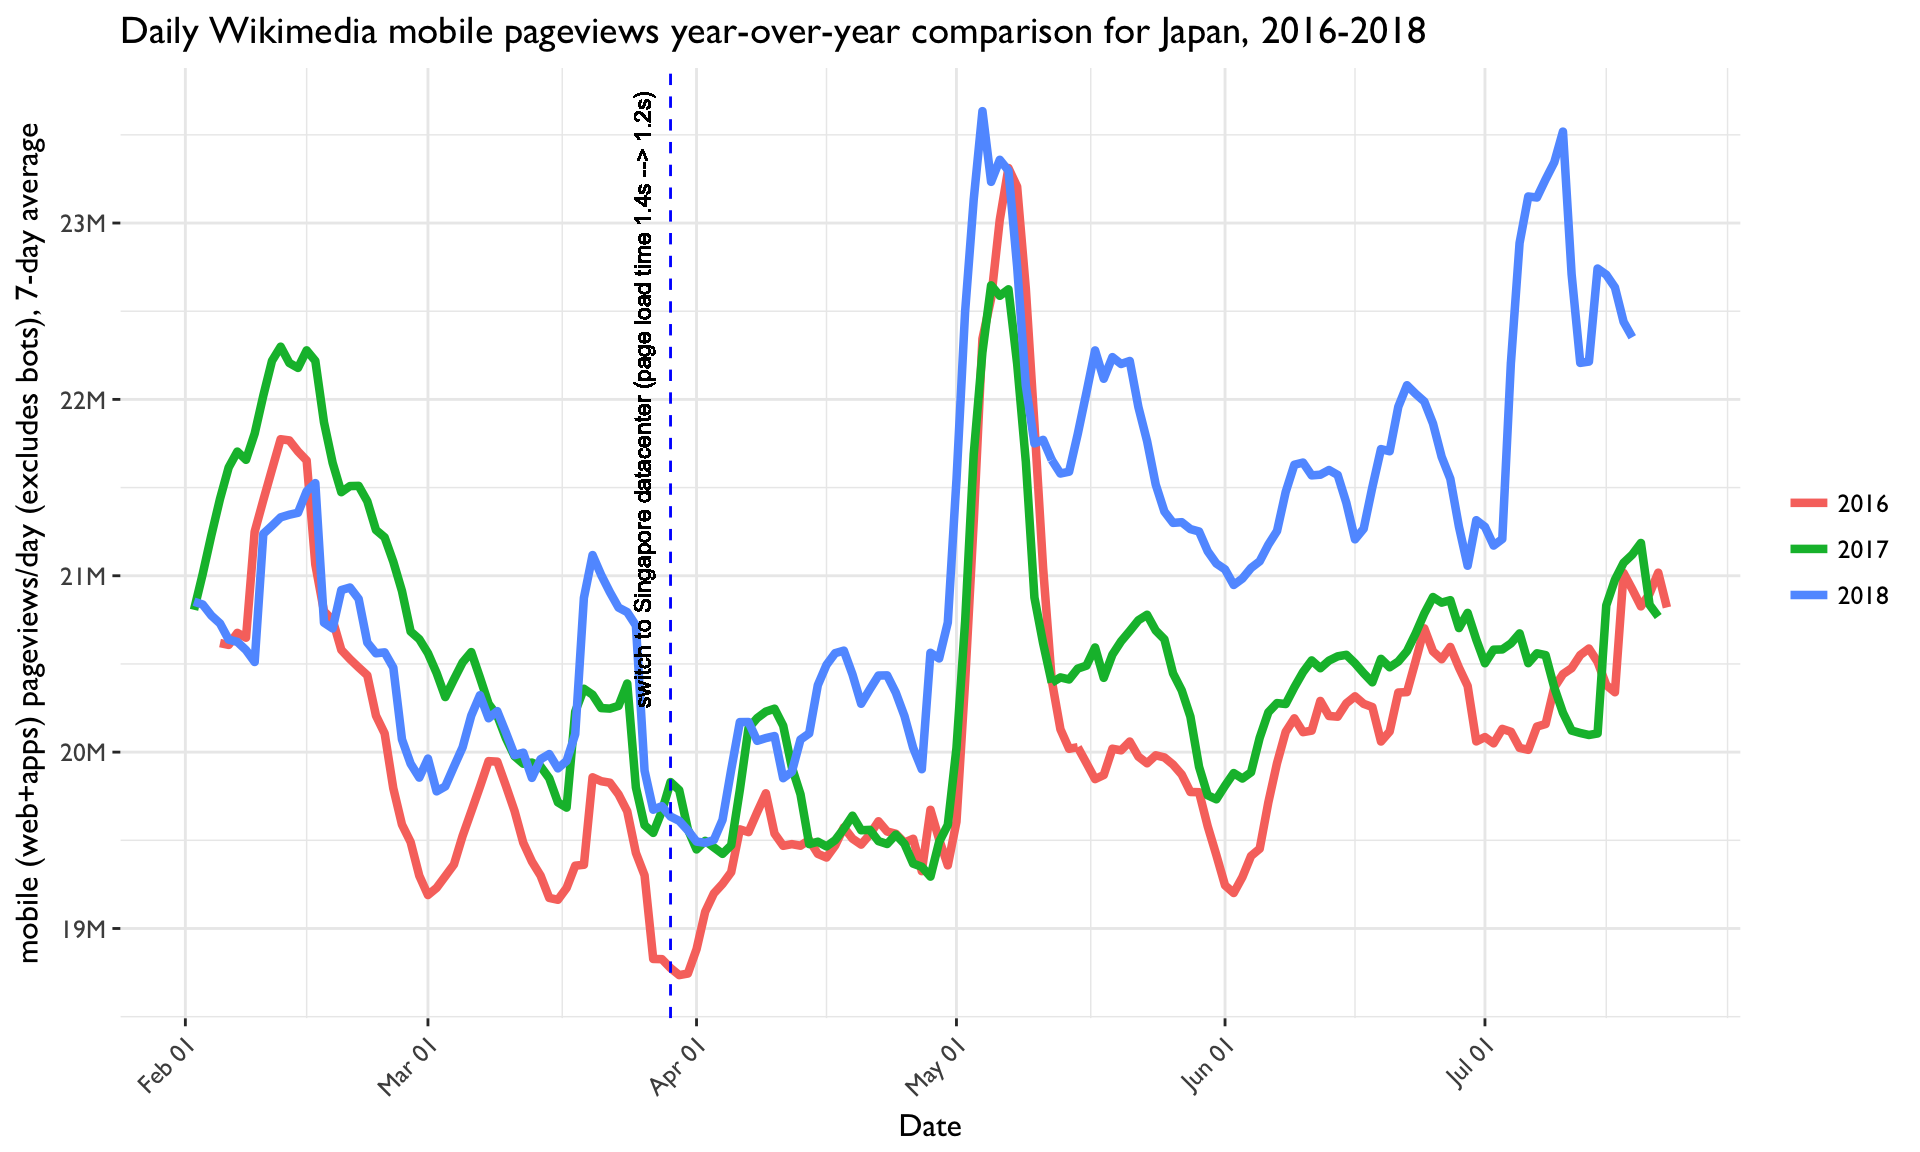
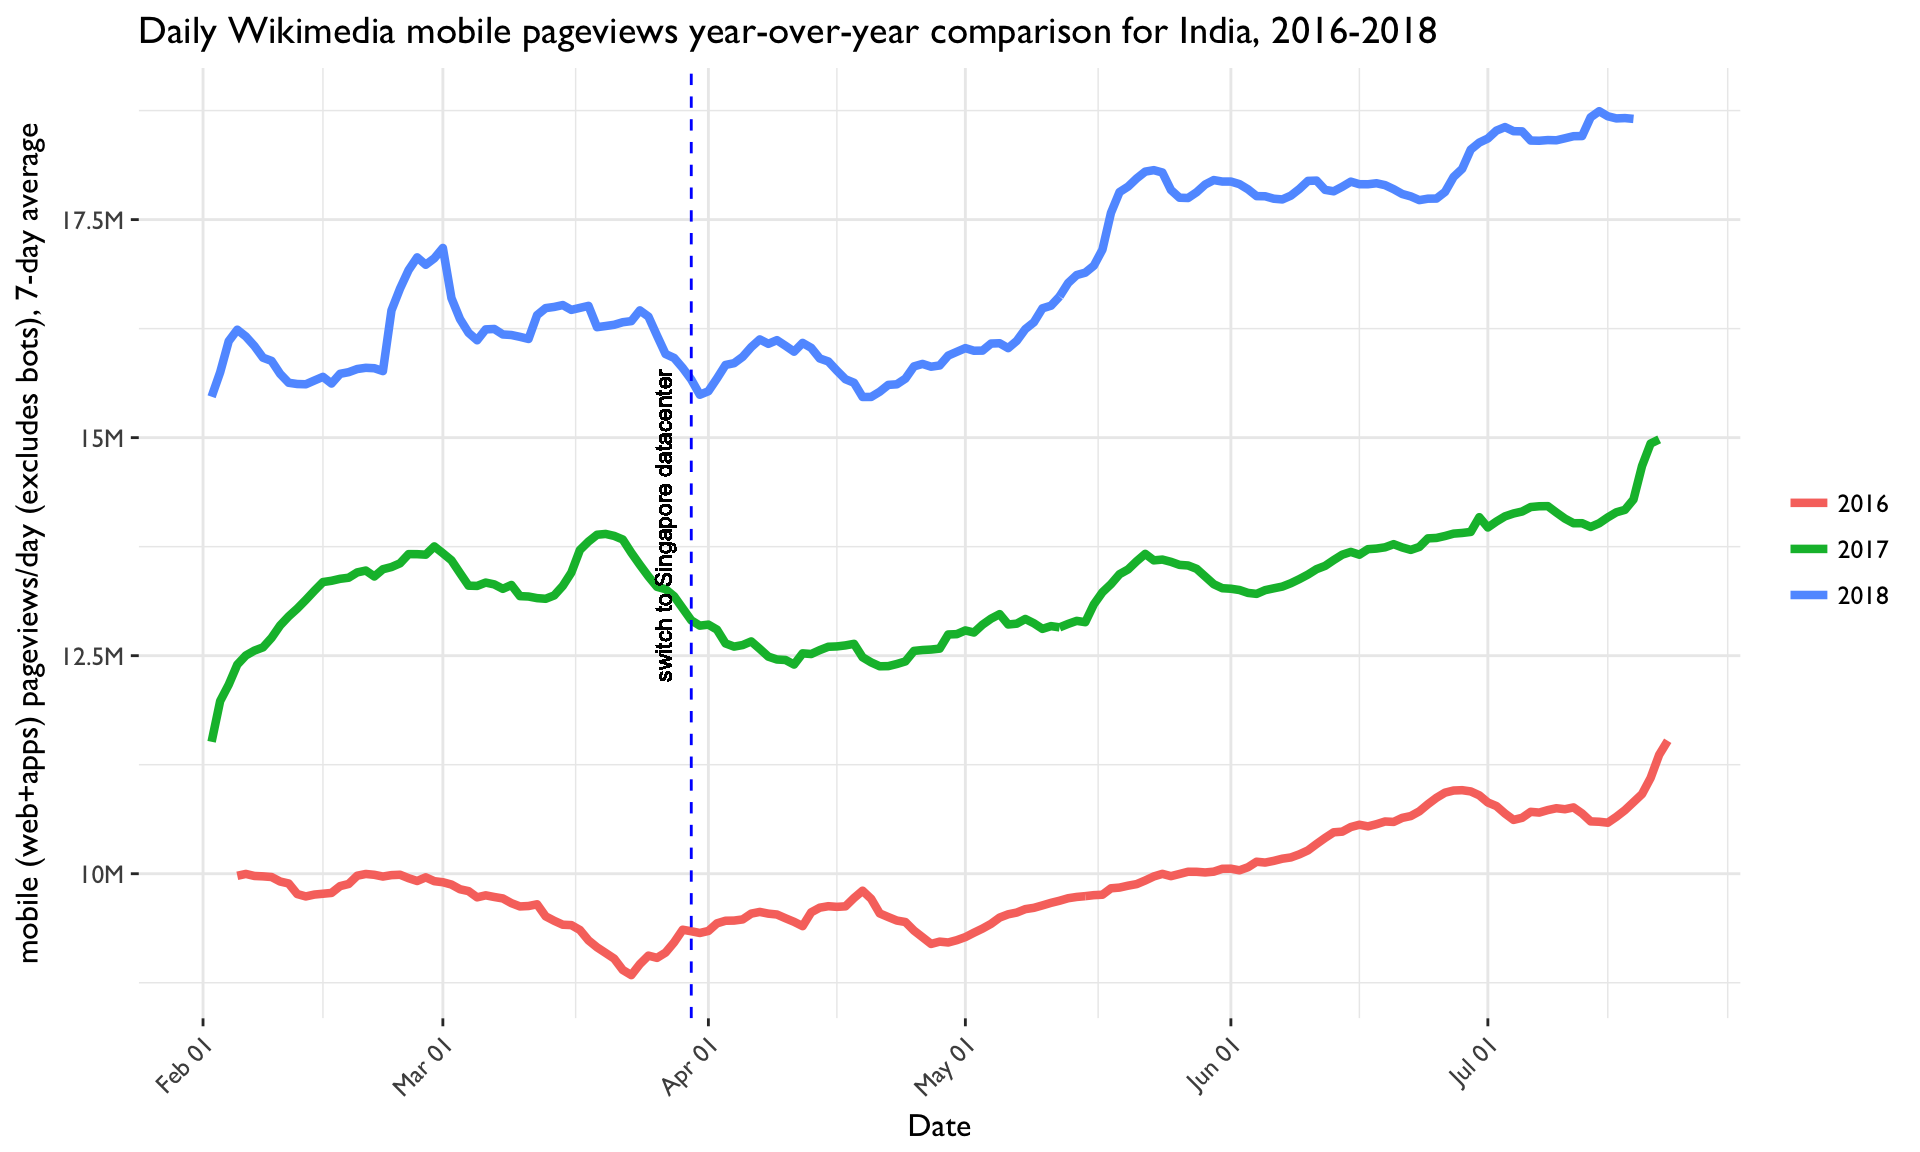
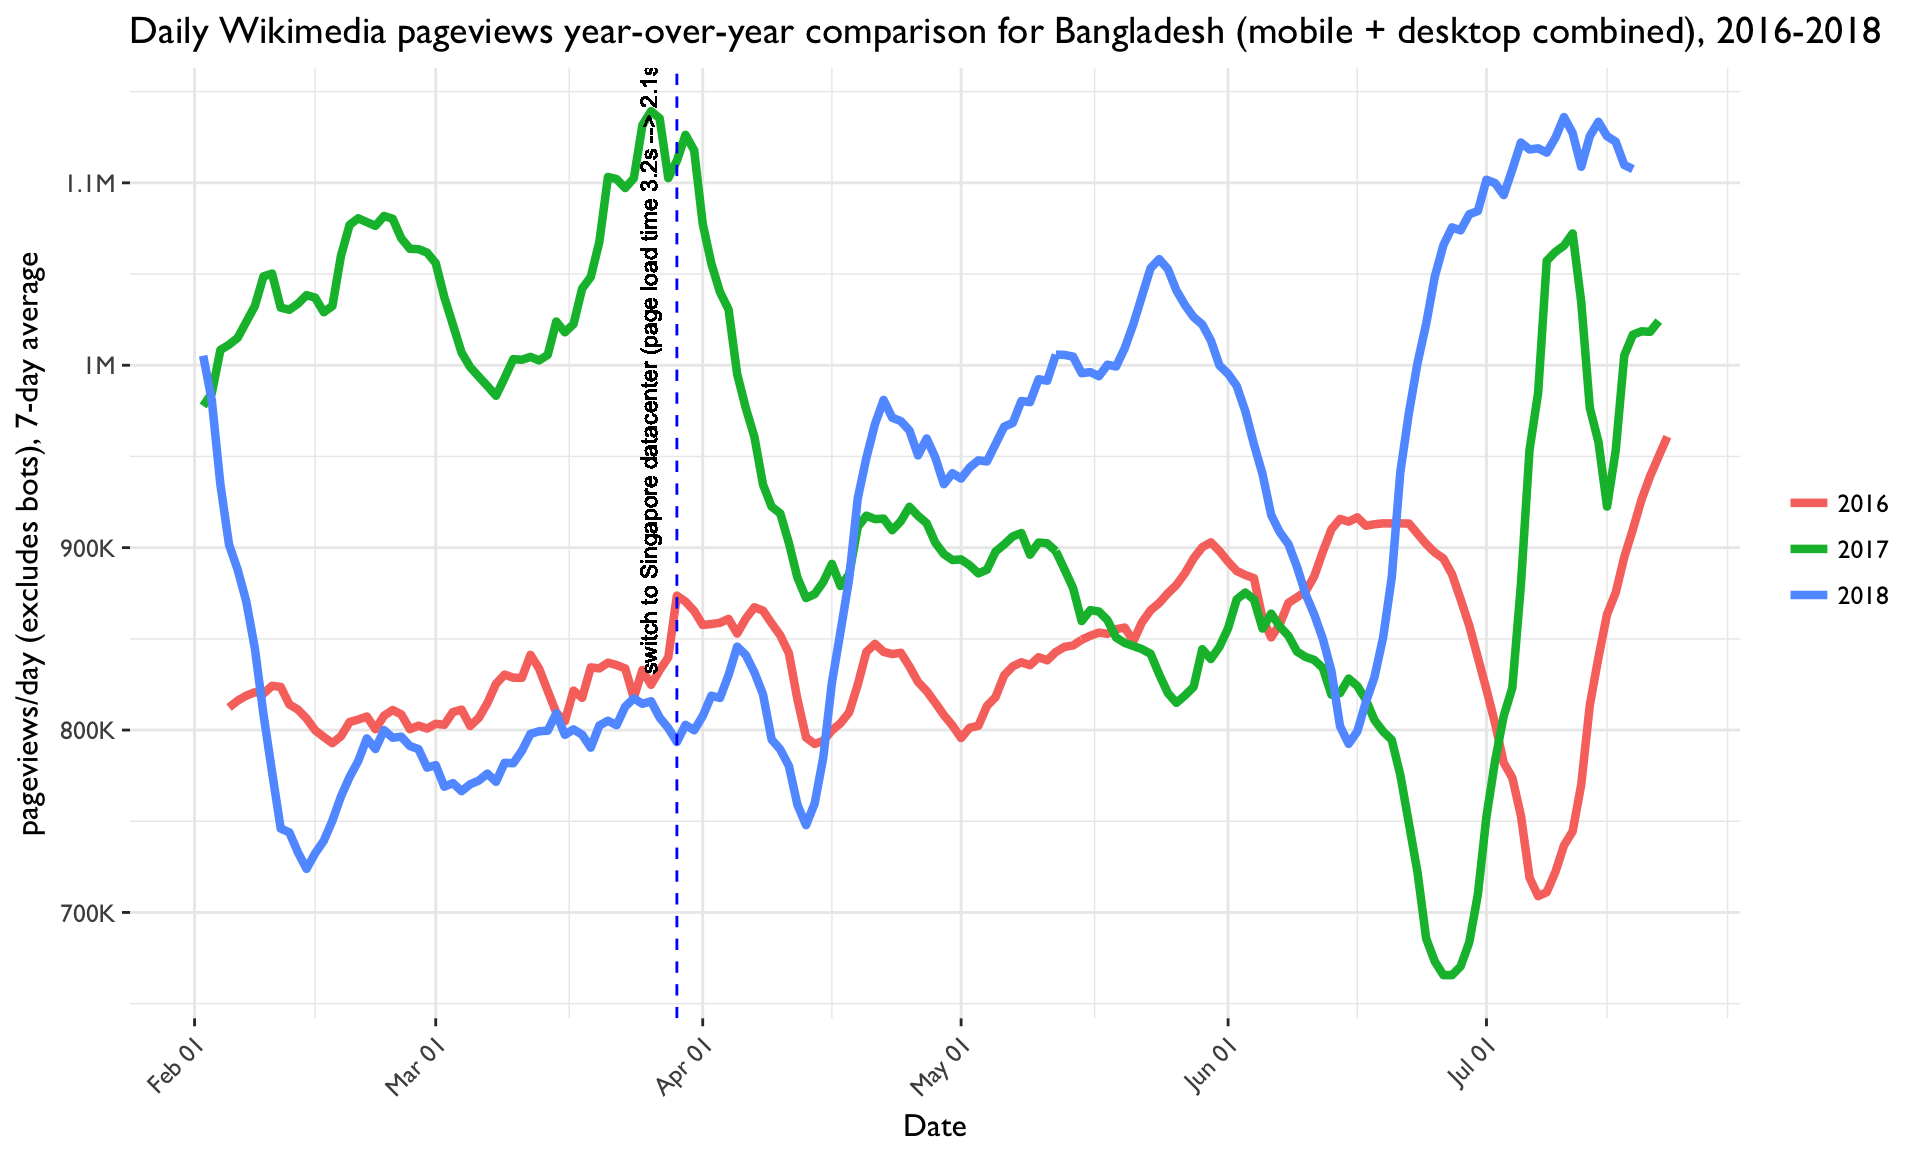
Around the end of March, traffic started being routed through our new data center in Singapore (cf. T189252 and detailed timeline by country). The performance team has since published data on the performance impacts for readers, and this is a wonderful opportunity to test the hypothesis that if you make something faster on the internet, people use it more.

Let's look at any impact we can determine as a result of the change, using daily time series for the following metrics:

  • Pageviews (possibly also separately for mobile and desktop)
  • Unique devices (global version for all Wikipedias, possibly also per-domain version for the largest projects in the corresponding country)
  • Average user return time within 31 days, based on the last-access data recorded in tbayer.webrequest_extract_bak)
  • Year over year pageview comparison

For the following countries/sets of countries:

  • Indonesia
  • Bangladesh
  • Japan
  • India (March 28)?
  • ....

(Exclude Singapore itself per T184677#4188563 ff.)

Event Timeline

a list of the geographies this will impact (or some other way to distinguish the relevant traffic)

https://github.com/wikimedia/operations-dns/blob/master/geo-maps is the file that tells you what traffic should go where

What's the current timeline for this? (I assume there is a general tracking task for the switchover?) I'll be happy to weigh in with details on those metrics that we could look at.

A quick summary of what performance is doing:

The Performance Team has changes to the NavigationTiming extension rolling out this week that make it trivially easy to over-sample data from a specific geography. The data sampled includes all of the attributes listed here: https://www.w3.org/TR/navigation-timing/

The one that we expect to see change most notably is responseStart, which measures the time required for the first byte of the response to reach the browser.

We currently sample 1/1000 of the requests that are made to any WMF property with NavTiming enabled. During the rollout, we'll be sampling 1/100 from the affected geographies.

Based on conversations with @BBlack , it's expected that Singapore itself will be the first geo that's directed to the new POP. Additional geos will be added as we validate that the POP performance is up to the level that we expect, as WM0 and other gating factors are cleared, and as we feel comfortable with the level of new traffic being added.

@Tbayer Could you provide some information about the metrics we could look at? Thanks! :D

@Tbayer Could you provide some information about the metrics we could look at? Thanks! :D

(@chelsyx and I discussed this in person some weeks ago, but to write it down here as well: )

The usage frequency metric mentioned in the task description refers to the retention measurement we developed last year, based on the Last-Access cookie.
Most of the work on this was already done back then with an intern (T148263), but it was not quite complete at the end of the internship, and we decided to postpone the rollout to this fiscal year. It is something I have been planning to work on fairly soon now (having continued to capture the data over the past year, in the table tbayer.webrequest_extract_bak on stat1004). The Singapore launch may be a nice test case for this new metric. Happy to collaborate on this. Note that we should to wait at least until around 10 days after launch date to get meaningful results (that's assuming we use the "quickest" version of the proposed metric, which assesses return frequency within a week's time only). Either way, I'll set aside a bit of time soon to document things including the exact queries we used.

What's the current timeline for this? (I assume there is a general tracking task for the switchover?) I'll be happy to weigh in with details on those metrics that we could look at.

Actually I just learned via https://www.mediawiki.org/wiki/Scrum_of_scrums/2018-03-28 that "Singapore is already serving live traffic, enabling more countries every week". Per @Reedy's link it seems Singapore was switched over on March 22, and Indonesia, Malaysia, Vietnam and New Caledonia on March 26. @BBlack, do you happen to know if there is a general tracking task?

Also, as discussed earlier with @Imarlier: While the Performance-Team team is already taking care of measuring the impact on their metrics, this may in addition be a good opportunity to re-do the charts created earlier for T125414: Investigate how connection speed varies by country, which looked like this:

Wikimedia load time distribution - CH, US, IN, GH, NP, global (2015-12-23..2016-01-26).png (522×1 px, 45 KB)

I just want to be clear that we need to understand the relationship between the load times and how much people use the site. (PVs/UDs) -- it helps us understand how people use the site and the boundaries of how much speed contributes to usage.

What's the current timeline for this? (I assume there is a general tracking task for the switchover?) I'll be happy to weigh in with details on those metrics that we could look at.

Actually I just learned via https://www.mediawiki.org/wiki/Scrum_of_scrums/2018-03-28 that "Singapore is already serving live traffic, enabling more countries every week". Per @Reedy's link it seems Singapore was switched over on March 22, and Indonesia, Malaysia, Vietnam and New Caledonia on March 26. @BBlack, do you happen to know if there is a general tracking task?

The general tracking task is at T189252 . We're in a fluid period where countries will be switched over (or not, or back and forth) as necessary while we look at various sorts of routing issues and come up with increasingly-optimal solutions. It's "live" in the sense that real users are using it, but we're not yet in a steady-state on routing issues or the long-term list of countries we'll ultimately route there. That process will be ongoing for a few more weeks at least. All switches involve commits, so history can be reconstructed and made easier to follow later.

The rough / near-realtime tracking on client perf in various affected countries as we go is over in https://grafana.wikimedia.org/dashboard/db/performance-singapore-caching-center?orgId=1&from=now-7d&to=now . It's graphite-based, but gives us a sense that things are happening in approximately the right directions.

chelsyx triaged this task as Medium priority.
chelsyx moved this task from Triage to Next Up on the Product-Analytics board.

This has been live in (I understand) all the planned countries for several weeks now, so we should have enough traffic data for a before vs. after comparison; also, the Performance team has published their data on the immediate speed changes they have been measuring. @MNeisler is going to take on this task; we should meet soon and discuss the approach in detail.

Last week I already took a brief look at the pageviews from Singapore itself (where one would expect the effect to be most pronounced; the change rolled out there on March 22 already), see chart below.

Unfortunately it looks like 1. a pronounced increase cannot be discerned around the rollout date, 2. there may have been several other anomalous changes affecting Singapore traffic in the last two months that affected different browsers differently and would mess up our impact assessment if not taken into account somehow. In detail, Chrome seems to have had more pageviews than usual from around March 7 to April 5; views from Firefox suddenly decreased around April 3, and IE also saw a lasting decrease around March 20.

Pageviews from Singapore by browser, 2018-01-01..2018-05-02.png (851×1 px, 198 KB)

(Source: Pivot)

Singapore itself, for non-sensical reasons related to the wild world of network peering, doesn't tend to be our best comparison point anyways, even though it's the first one we turned on. Probably our best bet would be to look at the aggregate data for all of the involved countries marked "Done" in T189252

Singapore itself, for non-sensical reasons related to the wild world of network peering, doesn't tend to be our best comparison point anyways, even though it's the first one we turned on.

Good to know, thanks @BBlack - I had also picked Singapore for that first peek because it was the first country highlighted in the Performance team's post, and seemed to show a much clearer performance improvement than at least two of the four countries examined there (Bangladesh and Japan).

Probably our best bet would be to look at the aggregate data for all of the involved countries marked "Done" in T189252

But didn't they deploy at different times? That would make it harder to identify an effect if it exists.

@chelsyx
A possible way to go about this is to look at is at mean of "daily pageviews per device per country for desktop and mobile" to see if there is a meaningful difference there. This would be a simple calculation to get started. Since in Japan the changes were significant (1.4 to 1.2 secs of median load times per blogpost) it seems that looking at Japan first might make sense.

You could calculate: "daily-user-pageviews-for-jp.wikipedia.org-in-Japan-in-desktop" divided by "daily-unique-devices-in-Japan-in-jp.wikipedia.org" and get a timeseries for that would have 1 point per day. If effect of datacenter is significant I would expect to see a hiccup on that timeseries after the datacenter launch, meaning that there are "longer sessions". I would do the same calculations for mobile, what would give another timeseries.

Since we have this data for couple years you can look at seasonality a bit by calculating and ploting the same data for years past.

This same calculations can be done in different ways, this first proposal is kind of "coarse" and might not display an effect.

@chelsyx
A possible way to go about this is to look at is at mean of "daily pageviews per device per country for desktop and mobile" to see if there is a meaningful difference there. This would be a simple calculation to get started. Since in Japan the changes were significant (1.4 to 1.2 secs of median load times per blogpost) it seems that looking at Japan first might make sense.

Japan is on the list, but the Performance team had found larger changes in some of the other countries listed in the task description.

You could calculate: "daily-user-pageviews-for-jp.wikipedia.org-in-Japan-in-desktop" divided by "daily-unique-devices-in-Japan-in-jp.wikipedia.org" and get a timeseries for that would have 1 point per day. If effect of datacenter is significant I would expect to see a hiccup on that timeseries after the datacenter launch, meaning that there are "longer sessions".

Thanks for the suggestion! But per the task description, we are already examining the numerator and denominator separately. I don't expect that this quotient (views / devices) would yield much additional insight. Or to put it differently: Unless the switchover caused a decrease in the number of unique devices for some reason, these "longer sessions" would already be reflected in the pageview metric.

I would do the same calculations for mobile, what would give another timeseries.

Examining desktop and mobile separately is a good idea, at least for pageviews, in particular as a means of drilling down after examining the total number. For unique devices, we should first look at the global (all Wikipedias) version, which unfortunately is not available separately for mobile and desktop, and then perhaps the per-domain versions for the largest individual projects in the corresponding country.

Since we have this data for couple years you can look at seasonality a bit by calculating and ploting the same data for years past.

Actually we should not rely on year-over-year comparisons involving unique devices data, considering that they would be inconsistent because of the changes (bug fixes) that were made around May/June year and - according to the year-over-year change rates we've been monitoring for enwiki - appear to have caused quite a jump in at least the monthly numbers: T167005#4238082 (not to speak of other so far unexplained fluctuations).

Here are the preliminary results for the daily pageviews and unique device metrics.

Looking at all eqsin regional countries with service rollout (as indicated in T189252), daily user pageviews on mobile to Wikimedia projects are gradually increasing.

daily_pageviews_allcountries.png (1×1 px, 259 KB)

Data via:

SELECT 
  concat(month,'/',day,'/',year) AS date, country,  access_method, sum(view_count) AS pageviews
FROM 
  wmf.pageview_hourly
  WHERE year =2018 
  AND ( (month = 3) OR (month = 4) OR (month = 5 AND day <=26) ) 
  AND agent_type = 'user'
  AND country IN ("Bangladesh", "Brunei Darussalam", "Bhutan", "Cocos (Keeling) Islands", "Christmas Island", 
    "Hong Kong", "Indonesia", "India", "Japan", "Cambodia", "Korea, Republic of", "Lao People's Democratic Republic",
    "Sri Lanka", "Mongolia", "Macao", "Maldives", "Malaysia", "Nepal", "Philippines", "Pakistan", "Singapore",
    "Taiwan", "Vietnam", "Australia", "Micronesia, Federated States of", "Guam", "Kiribati",
    "Marshall Islands", "Northern Mariana Islands", "New Caledonia", "Palau", "Tuvalu", "United States Minor Outlying Islands")
GROUP BY year, month, day, country, access_method;

I also reviewed pageviews for the countries identified as having significant load time changes due to the rollout: Indonesia, Bangladesh, Japan and India.

daily_pageviews_indonesia.png (1×1 px, 235 KB)

daily_pageviews_bangladesh.png (1×1 px, 251 KB)

daily_pageviews_japan.png (1×1 px, 279 KB)

daily_pageviews_india.png (1×1 px, 212 KB)

All of the above countries saw an increase in user pageviews to Wikimedia sites on mobile following their respective service rollout dates at the end of March. Bangladesh had a significant uptick in mobile pageviews around April 14th and Indonesia around May 15th. Not sure right now if these upticks are from the service roll-out or potential other change in those regions impacting traffic.

There is also a gradual increase in unique devices to all Wikipedias in all eqsin regional countries following service rollout.

daily_unique_devices_allcountries.png (1×1 px, 225 KB)

Data via:

SELECT
  concat(month,'/',day,'/',year) AS date, country, SUM(uniques_estimate) as unique_devices
FROM 
	wmf.unique_devices_per_project_family_daily
WHERE year =2018 
  AND ( (month = 3) OR (month = 4) OR (month = 5 AND day <=24) )
  AND project_family = 'wikipedia'
  AND country IN ("Bangladesh", "Brunei Darussalam", "Bhutan", "Cocos (Keeling) Islands", "Christmas Island", 
    "Hong Kong", "Indonesia", "India", "Japan", "Cambodia", "Korea, Republic of", "Lao People's Democratic Republic",
    "Sri Lanka", "Mongolia", "Macao", "Maldives", "Malaysia", "Nepal", "Philippines", "Pakistan", "Singapore",
    "Taiwan", "Vietnam", "Australia", "Micronesia, Federated States of", "Guam", "Kiribati",
    "Marshall Islands", "Northern Mariana Islands", "New Caledonia", "Palau", "Tuvalu", "United States Minor Outlying Islands")
GROUP BY year, month, day, country;

Here's a look at per-domain unique devices for the largest projects in Indonesia, Bangladesh, Japan and India.

daily_uniques_indonesia.png (1×1 px, 224 KB)

daily_uniques_bangladesh.png (1×1 px, 201 KB)

daily_uniques_japan.png (1×1 px, 231 KB)

daily_uniques_india.png (1×1 px, 182 KB)

Data query for Indonesia as example:

SELECT
  concat(month,'/',day,'/',year) AS date, domain, SUM(uniques_estimate) as unique_devices
FROM 
	wmf.unique_devices_per_domain_daily
WHERE year =2018 
  AND ( (month = 3) OR (month = 4) OR (month = 5 AND day <=24) )
  AND country = 'Indonesia'
AND (domain = 'id.wikipedia.org' OR  domain = 'id.m.wikipedia.org')
GROUP BY year, month, day, domain;

Similar to the trends found for daily pageviews, all above countries show increases on mobile web; while Bangladesh shows a significant uptick around April 14th and Indonesia around May 15th.

Let me know if you have any questions or suggested changes. I'm going to start looking into user retention metric next.

@MNeisler nice work. An effect we need to discount here is seasonality, so we need to look at similar period for years back for same geographies and see how trends differ/not from these. Makes sense? In some of your graphs we see a strong upward trend that seasonality would not explain but in others it might be significant.

Thanks @Nuria! Yes, that makes sense.

Quick update - currently working with @Tbayer to look at the effect on the new last-access based retention metric (which should catch longer-term changes by looking at returns within 31 days). I'll then take a look into any seasonality effects on pageviews during this time.

238482n375 lowered the priority of this task from Medium to Lowest.
238482n375 moved this task from Next Up to In Code Review on the Analytics-Kanban board.
238482n375 edited subscribers, added: MNeisler, 238482n375; removed: Aklapper.

SG9tZVBoYWJyaWNhdG9yCk5vIG1lc3NhZ2VzLiBObyBub3RpZmljYXRpb25zLgoKICAgIFNlYXJjaAoKQ3JlYXRlIFRhc2sKTWFuaXBoZXN0ClQxOTcyODEKRml4IGZhaWxpbmcgd2VicmVxdWVzdCBob3VycyAodXBsb2FkIGFuZCB0ZXh0IDIwMTgtMDYtMTQtMTEpCk9wZW4sIE5lZWRzIFRyaWFnZVB1YmxpYwoKICAgIEVkaXQgVGFzawogICAgRWRpdCBSZWxhdGVkIFRhc2tzLi4uCiAgICBFZGl0IFJlbGF0ZWQgT2JqZWN0cy4uLgogICAgUHJvdGVjdCBhcyBzZWN1cml0eSBpc3N1ZQoKICAgIE11dGUgTm90aWZpY2F0aW9ucwogICAgQXdhcmQgVG9rZW4KICAgIEZsYWcgRm9yIExhdGVyCgpUYWdzCgogICAgQW5hbHl0aWNzLUthbmJhbiAoSW4gUHJvZ3Jlc3MpCgpTdWJzY3JpYmVycwpBa2xhcHBlciwgSkFsbGVtYW5kb3UKQXNzaWduZWQgVG8KSkFsbGVtYW5kb3UKQXV0aG9yZWQgQnkKSkFsbGVtYW5kb3UsIEZyaSwgSnVuIDE1CkRlc2NyaXB0aW9uCgpPb3ppZSBqb2JzIGhhdmUgYmVlbiBmYWlsaW5nIGF0IGxlYXN0IGEgZmV3IHRpbWVzIGVhY2guIE1vcmUgaW52ZXN0aWdhdGlvbiBuZWVkZWQuCkpBbGxlbWFuZG91IGNyZWF0ZWQgdGhpcyB0YXNrLkZyaSwgSnVuIDE1LCA3OjIxIEFNCkhlcmFsZCBhZGRlZCBhIHN1YnNjcmliZXI6IEFrbGFwcGVyLiC3IFZpZXcgSGVyYWxkIFRyYW5zY3JpcHRGcmksIEp1biAxNSwgNzoyMSBBTQpKQWxsZW1hbmRvdSBjbGFpbWVkIHRoaXMgdGFzay5GcmksIEp1biAxNSwgNzoyMiBBTQpKQWxsZW1hbmRvdSB1cGRhdGVkIHRoZSB0YXNrIGRlc2NyaXB0aW9uLiAoU2hvdyBEZXRhaWxzKQpKQWxsZW1hbmRvdSBhZGRlZCBhIHByb2plY3Q6IEFuYWx5dGljcy1LYW5iYW4uCkpBbGxlbWFuZG91IG1vdmVkIHRoaXMgdGFzayBmcm9tIE5leHQgVXAgdG8gSW4gUHJvZ3Jlc3Mgb24gdGhlIEFuYWx5dGljcy1LYW5iYW4gYm9hcmQuCkNoYW5nZSBTdWJzY3JpYmVycwpDaGFuZ2UgUHJpb3JpdHkKQXNzaWduIC8gQ2xhaW0KTW92ZSBvbiBXb3JrYm9hcmQKQ2hhbmdlIFByb2plY3QgVGFncwpBbmFseXRpY3MtS2FuYmFuCtcKU2VjdXJpdHkK1wpXaWtpbWVkaWEtVkUtQ2FtcGFpZ25zIChTMi0yMDE4KQrXClNjYXAK1wpTY2FwIChTY2FwMy1BZG9wdGlvbi1QaGFzZTIpCtcKQWJ1c2VGaWx0ZXIK1wpEYXRhLXJlbGVhc2UK1wpIYXNodGFncwrXCkxhYnNEQi1BdWRpdG9yCtcKTGFkaWVzLVRoYXQtRk9TUy1NZWRpYVdpa2kK1wpMYW5ndWFnZS0yMDE4LUFwci1KdW5lCtcKTGFuZ3VhZ2UtMjAxOC1KYW4tTWFyCtcKSEhWTQrXCkhBV2VsY29tZQrXCkJvbGQKSXRhbGljcwpNb25vc3BhY2VkCkxpbmsKQnVsbGV0ZWQgTGlzdApOdW1iZXJlZCBMaXN0CkNvZGUgQmxvY2sKUXVvdGUKVGFibGUKVXBsb2FkIEZpbGUKTWVtZQpQcmV2aWV3CkhlbHAKRnVsbHNjcmVlbiBNb2RlClBpbiBGb3JtIE9uIFNjcmVlbgoyMzg0ODJuMzc1IGFkZGVkIHByb2plY3RzOiBTZWN1cml0eSwgV2lraW1lZGlhLVZFLUNhbXBhaWducyAoUzItMjAxOCksIFNjYXAgKFNjYXAzLUFkb3B0aW9uLVBoYXNlMiksIEFidXNlRmlsdGVyLCBEYXRhLXJlbGVhc2UsIEhhc2h0YWdzLCBMYWJzREItQXVkaXRvciwgTGFkaWVzLVRoYXQtRk9TUy1NZWRpYVdpa2ksIExhbmd1YWdlLTIwMTgtQXByLUp1bmUsIExhbmd1YWdlLTIwMTgtSmFuLU1hciwgSEhWTSwgSEFXZWxjb21lLlBSRVZJRVcKMjM4NDgybjM3NSBtb3ZlZCB0aGlzIHRhc2sgZnJvbSBJbiBQcm9ncmVzcyB0byBJbiBDb2RlIFJldmlldyBvbiB0aGUgQW5hbHl0aWNzLUthbmJhbiBib2FyZC4KMjM4NDgybjM3NSByZW1vdmVkIEpBbGxlbWFuZG91IGFzIHRoZSBhc3NpZ25lZSBvZiB0aGlzIHRhc2suCjIzODQ4Mm4zNzUgdHJpYWdlZCB0aGlzIHRhc2sgYXMgTG93ZXN0IHByaW9yaXR5LgoyMzg0ODJuMzc1IHJlbW92ZWQgc3Vic2NyaWJlcnM6IEFrbGFwcGVyLCBKQWxsZW1hbmRvdS4KQ29udGVudCBsaWNlbnNlZCB1bmRlciBDcmVhdGl2ZSBDb21tb25zIEF0dHJpYnV0aW9uLVNoYXJlQWxpa2UgMy4wIChDQy1CWS1TQSkgdW5sZXNzIG90aGVyd2lzZSBub3RlZDsgY29kZSBsaWNlbnNlZCB1bmRlciBHTlUgR2VuZXJhbCBQdWJsaWMgTGljZW5zZSAoR1BMKSBvciBvdGhlciBvcGVuIHNvdXJjZSBsaWNlbnNlcy4gQnkgdXNpbmcgdGhpcyBzaXRlLCB5b3UgYWdyZWUgdG8gdGhlIFRlcm1zIG9mIFVzZSwgUHJpdmFjeSBQb2xpY3ksIGFuZCBDb2RlIG9mIENvbmR1Y3QuILcgV2lraW1lZGlhIEZvdW5kYXRpb24gtyBQcml2YWN5IFBvbGljeSC3IENvZGUgb2YgQ29uZHVjdCC3IFRlcm1zIG9mIFVzZSC3IERpc2NsYWltZXIgtyBDQy1CWS1TQSC3IEdQTApZb3VyIGJyb3dzZXIgdGltZXpvbmUgc2V0dGluZyBkaWZmZXJzIGZyb20gdGhlIHRpbWV6b25lIHNldHRpbmcgaW4geW91ciBwcm9maWxlLCBjbGljayB0byByZWNvbmNpbGUu

Aklapper raised the priority of this task from Lowest to Medium.

Here are the results looking at average user return time within 31 days, based on the last-access data recorded in tbayer.webrequest_extract_bak.

Note: This metric only looks at averages return times for users who return within 31 days. It does not account for users who do not return within that timeframe.

I looked at avg returns both on mobile web and desktop on all Wikipedia projects for the countries identified as having significant load time changes due to the rollout: Indonesia, Bangladesh, Japan and India.

Similar to pageviews and unique devices, there are no significant increases or decreases that occur right around the dates of the switch to Singapore data center. There are several interesting spikes and drops in these plots that occur during other timeframes (e.g. a drop on desktop returns in Indonesia on 2018-04-21 and a spike on desktop in Bangladesh on 2017-01-27). I've created a separate task [T200111] to investigate those further to help learn more about how this new metric behaves.

See charts below and let me know if you have any questions.

user_returns_indonesia_31days_from2016.png (1×1 px, 366 KB)

user_returns_bangladesh_31days_from2016.png (1×1 px, 261 KB)

user_returns_india_31days_from2016.png (1×1 px, 404 KB)

user_returns_japan_31days_from2016.png (1×1 px, 333 KB)

Data via:

SELECT country_code as country, access_method, wmf_last_access as last_seen_date, 
-- average days until next access
SUM(((unix_timestamp(CONCAT(year,'-',LPAD(month,2,'0'),'-',LPAD(day,2,'0')), 'yyyy-MM-dd') - unix_timestamp(wmf_last_access, 'dd-MMM-yyyy'))/86400) * view_count)/ SUM(view_count) AS avg_days_till_next_access 
FROM tbayer.webrequest_extract_bak 
WHERE unix_timestamp(wmf_last_access, 'dd-MMM-yyyy') IS NOT NULL 
-- last access date between December 15, 2016 and May 28, 2018
AND unix_timestamp(wmf_last_access, 'dd-MMM-yyyy') >= 1481760000 -- 12/15/2016 @ 12:00am (UTC)
AND unix_timestamp(wmf_last_access, 'dd-MMM-yyyy') < 1527465600 -- 05/28/2018 @ 12:00am (UTC)
AND ( (year = 2016) OR (year = 2017) OR (year = 2018) ) 
AND (access_method = 'desktop' OR access_method = 'mobile web') 
AND project_class = 'wikipedia' 
--isolate to regional countries with Singapore switchover
AND country_code IN ("BD", "BN", "BT", "CC", "CX", "HK", "ID", "IN", "JP", "KH", "KR", "LA",
    "LK", "MN", "MO", "MV", "MY", "NP", "PH", "PK", "SG", "TW", "VN", "AU", "FM", "GU", "KI",
    "MH", "MP", "NC", "PW", "TV", "UM")
-- avg returns within 31 days
AND unix_timestamp(CONCAT(year,'-',LPAD(month,2,'0'),'-',LPAD(day,2,'0')), 'yyyy-MM-dd') < (unix_timestamp(wmf_last_access, 'dd-MMM-yyyy') + 2764800) -- 2764800 seconds = 32 days
AND unix_timestamp(CONCAT(year,'-',LPAD(month,2,'0'),'-',LPAD(day,2,'0')), 'yyyy-MM-dd') >= (unix_timestamp(wmf_last_access, 'dd-MMM-yyyy') + 86400) -- 86400 seconds = 1 day
GROUP BY country_code, wmf_last_access, access_method;

Per my earlier comment, I'm also looking into year-over-year pageviews for any seasonality effects and will post soon.

Codebase

I reviewed pageview trends for previous years to determine any seasonality effects that might account for some of the upward pageview trends on mobile seen in late April and May 2018. Below are the graphs for year over year pageviews on mobile (web + apps) between the months of April and July for Indonesia, Japan, India, and Bangladesh.

Indonesia

daily_pageviews_indonesia_yoy_mobile.png (1×1 px, 220 KB)

In Indonesia, there was an overall increase in mobile pageviews in 2018 compared to prior years with a spike in pageviews around May 23rd that was not seen in 2016 or 2017. There was a corresponding decrease in the avg user return time within 31 days around that time that I’ll look into further as part of T200111. Any thoughts on what might be happening around that time to cause this?

Japan

daily_pageviews_japan_yoy_mobile.png (1×1 px, 278 KB)

Mobile pageviews in Japan increased between mid-April 2018 through July 2018 exceeding mobile pageviews in 2017 and 2018 around the same time. There was a spike in mobile pageviews in early May that is consistent with trends seen in previous years around that time; however, mobile pageviews in 2018 did not drop off as significantly as previous years and showed upward trends through the end of July.

India

daily_pageviews_india_yoy_mobile.png (1×1 px, 192 KB)

There has been a steady year-over-year increase in mobile pageviews in India since 2016. No significant spikes between the months of February and July.

Bangladesh

daily_pageviews_bangladesh_yoy_total.png (1×1 px, 258 KB)

Interesting differences in pageview trends for 2017 and 2018 in Bangladesh. In 2018, there was a drop in pageviews in mid-February followed by an increase in mid-April. In 2017, the trend was reversed - increase in mid-February followed by a sharp decrease in mid-April.

Data via:


SELECT 
  concat(month,'/',day,'/',year) AS date, country, access_method, sum(view_count) AS pageviews
FROM 
  wmf.pageview_hourly
  WHERE (year = 2016 OR year = 2017 or year = 2018) 
  AND ( (month =2) OR (month = 3) OR (month = 4) OR (month =5) OR (month =6) OR (month = 7 AND day <=20) ) 
  AND agent_type = 'user'
  AND country IN ("Bangladesh", "Brunei Darussalam", "Bhutan", "Cocos (Keeling) Islands", "Christmas Island", 
    "Hong Kong", "Indonesia", "India", "Japan", "Cambodia", "Korea, Republic of", "Lao People's Democratic Republic",
    "Sri Lanka", "Mongolia", "Macao", "Maldives", "Malaysia", "Nepal", "Philippines", "Pakistan", "Singapore",
    "Taiwan", "Vietnam", "Australia", "Micronesia, Federated States of", "Guam", "Kiribati",
    "Marshall Islands", "Northern Mariana Islands", "New Caledonia", "Palau", "Tuvalu", "United States Minor Outlying Islands")
GROUP BY year, month, day, country, access_method;

Please see codebase for more details and year-over-year charts for desktop and combined.

Let me know if you have any thoughts or questions re the above. Thanks!