(Split off from T119798: Vary mobile HTML by connection speed)
Description
Description
Related Objects
Related Objects
- Mentioned In
- T184677: Measure impact of Singapore data center on Wikimedia usage
T134003: Deploy lazy loaded images to a few more wikis
T119798: Vary mobile HTML by connection speed
T125384: Focus on the users that have the worst performance - Mentioned Here
- T119797: Serve low-res images by default to users on slow or metered mobile connections
T119798: Vary mobile HTML by connection speed
Event Timeline
Comment Actions
Below is a list of how speed varied by country (measued as the median of loadEventEnd from the NavigationTiming schema), during the five weeks from Dec 23-Jan 26 . The global median was (EDIT:) 1703 milliseconds during this time (1592 milliseconds during January 27).
| country | median of loadEventEnd (in ms) | # of samples |
| LI | 898.5 | 46 |
| CH | 1084 | 14623 |
| AX | 1093 | 97 |
| DK | 1117 | 22799 |
| SE | 1117 | 40730 |
| PM | 1125 | 5 |
| GG | 1141.5 | 358 |
| LU | 1137.5 | 1432 |
| VA | 1141 | 13 |
| MC | 1240 | 80 |
| NO | 1174 | 22810 |
| NL | 1176 | 47814 |
| BE | 1222 | 20208 |
| JE | 1251 | 607 |
| GI | 1258 | 247 |
| IS | 1296.5 | 2786 |
| FO | 1348.5 | 276 |
| AD | 1354 | 88 |
| DE | 1349 | 74946 |
| FI | 1351 | 23215 |
| CA | 1357 | 250841 |
| GB | 1360 | 535097 |
| KP | 1363 | 3 |
| AT | 1365 | 11504 |
| IM | 1383.5 | 640 |
| CZ | 1405.5 | 14800 |
| SI | 1412.5 | 7950 |
| US | 1412 | 1940015 |
| LT | 1415 | 6350 |
| EE | 1423 | 5503 |
| EU | 1436 | 3380 |
| LV | 1450 | 4099 |
| HU | 1462 | 15524 |
| SM | 1471 | 15 |
| BM | 1477.5 | 310 |
| BG | 1487 | 12137 |
| RU | 1510 | 26957 |
| SK | 1528 | 7439 |
| IL | 1544 | 18647 |
| FR | 1544 | 43388 |
| RO | 1545 | 22943 |
| PT | 1557 | 15301 |
| PL | 1571 | 32921 |
| MT | 1579.5 | 2994 |
| UA | 1612 | 9675 |
| HR | 1655 | 14098 |
| ES | 1671 | 33193 |
| ST | 2207.5 | 4 |
| IT | 1738 | 39487 |
| RS | 1739 | 17211 |
| AW | 1765 | 300 |
| GE | 1768 | 3927 |
| MD | 1769.5 | 1438 |
| JP | 1778 | 21061 |
| BY | 1799 | 1928 |
| GR | 1807 | 25796 |
| IE | 1809 | 37988 |
| KY | 1902 | 302 |
| CW | 1896 | 338 |
| VI | 1908 | 246 |
| KR | 1916 | 15737 |
| MK | 1925 | 4775 |
| PR | 1928 | 4116 |
| BA | 1934 | 5425 |
| MX | 1972 | 26769 |
| TW | 1996.5 | 11924 |
| PA | 2027 | 1679 |
| AE | 2033 | 22980 |
| ME | 2035 | 1282 |
| HK | 2101 | 19492 |
| AM | 2114 | 1486 |
| KZ | 2151 | 1816 |
| QA | 2194 | 5036 |
| BS | 2210 | 932 |
| AL | 2211 | 4187 |
| MF | 2399 | 14 |
| AI | 2218 | 39 |
| NZ | 2219 | 27147 |
| MO | 2230 | 551 |
| TR | 2234.5 | 25154 |
| CR | 2264 | 2414 |
| PF | 2284 | 75 |
| DO | 2297 | 2338 |
| PE | 2324 | 5165 |
| AZ | 2325.5 | 2072 |
| SG | 2348 | 37959 |
| BB | 2373.5 | 898 |
| CY | 2380 | 2559 |
| CO | 2398 | 7156 |
| BQ | 2398 | 41 |
| KW | 2400 | 3770 |
| GL | 2430.5 | 60 |
| SV | 2420.5 | 934 |
| TT | 2419 | 3093 |
| GT | 2422 | 1245 |
| GU | 2439.5 | 530 |
| TC | 2451.5 | 84 |
| UY | 2448 | 1539 |
| AU | 2454 | 142711 |
| MN | 2461 | 1285 |
| CL | 2509 | 7082 |
| BH | 2521.5 | 2248 |
| DM | 2542.5 | 172 |
| SA | 2541.5 | 14716 |
| BR | 2551 | 38881 |
| VG | 2589 | 108 |
| MQ | 2654 | 96 |
| KN | 2616 | 125 |
| EC | 2624.5 | 2334 |
| GW | 2658 | 7 |
| AR | 2669 | 11924 |
| PS | 2669 | 649 |
| SX | 2689 | 93 |
| GD | 2790.5 | 192 |
| JO | 2786 | 2534 |
| HN | 2812.5 | 958 |
| CK | 2930.5 | 20 |
| VN | 2848 | 10189 |
| OM | 2859.5 | 2520 |
| NI | 2865 | 541 |
| CN | 2865 | 18987 |
| TN | 2872.5 | 1770 |
| RE | 2905 | 185 |
| MA | 2907 | 3831 |
| TH | 2913 | 15979 |
| A1 | 3035.5 | 258 |
| CV | 3019 | 55 |
| NC | 3061.5 | 58 |
| WS | 3474 | 18 |
| KG | 3191 | 339 |
| IQ | 3214 | 2463 |
| LC | 3219 | 281 |
| GF | 3231 | 41 |
| AP | 3234 | 1609 |
| TO | 3374.5 | 24 |
| VE | 3283 | 4369 |
| SR | 3290 | 462 |
| GP | 3291 | 139 |
| LB | 3295.5 | 3680 |
| JM | 3376 | 2891 |
| VC | 3399 | 115 |
| MY | 3403 | 41040 |
| AG | 3444 | 238 |
| BN | 3456 | 1156 |
| DZ | 3566 | 2666 |
| EG | 3574 | 8886 |
| BZ | 3638.5 | 410 |
| GY | 3664 | 526 |
| TJ | 3665 | 77 |
| LK | 3669 | 6796 |
| BO | 3822 | 696 |
| ER | 9784.5 | 4 |
| PY | 3861 | 690 |
| MS | 3879 | 5 |
| MP | 3940 | 115 |
| ID | 4005 | 34620 |
| PH | 4034 | 74659 |
| AS | 4096 | 50 |
| KH | 4044 | 1401 |
| ZA | 4049 | 22840 |
| CI | 4064 | 180 |
| YT | 4111 | 11 |
| UZ | 4123 | 451 |
| IR | 4204 | 11935 |
| FJ | 4251.5 | 566 |
| HT | 4279 | 191 |
| SC | 4307 | 117 |
| RW | 4347 | 281 |
| MZ | 4412 | 267 |
| GQ | 4436 | 7 |
| AO | 4490 | 558 |
| ML | 4632 | 60 |
| PW | 4590 | 16 |
| MU | 4590 | 2132 |
| BD | 4592 | 10430 |
| MV | 4607 | 749 |
| LA | 4655.5 | 268 |
| SN | 4670 | 259 |
| AF | 4717 | 463 |
| PK | 4730.5 | 30474 |
| DJ | 4744 | 169 |
| KE | 4796 | 4651 |
| GA | 4930.5 | 42 |
| IN | 4835 | 319293 |
| BT | 4910 | 169 |
| MG | 5040 | 154 |
| VU | 4996 | 29 |
| ET | 5046.5 | 1100 |
| CD | 5081 | 109 |
| LY | 5106 | 447 |
| NA | 5263 | 491 |
| ZW | 5334 | 795 |
| TM | 5382 | 81 |
| SL | 5802 | 54 |
| CG | 5702 | 33 |
| KM | 5723 | 3 |
| UG | 5735 | 1074 |
| SY | 5779 | 388 |
| SB | 5794 | 39 |
| SZ | 5909.5 | 44 |
| MH | 5929 | 17 |
| NG | 5930 | 8362 |
| MM | 5996.5 | 1820 |
| GH | 6112.5 | 2456 |
| FM | 6273 | 26 |
| PG | 6216 | 213 |
| TZ | 6353.5 | 2110 |
| MR | 6391 | 45 |
| CM | 6573 | 369 |
| ZM | 6620 | 644 |
| BI | 6632 | 27 |
| BW | 6753.5 | 502 |
| NP | 6794 | 3341 |
| LR | 7133.5 | 146 |
| TL | 7030 | 51 |
| TG | 7450 | 41 |
| MW | 7501 | 203 |
| BJ | 7519 | 79 |
| IO | 7557 | 7 |
| SO | 7597 | 343 |
| YE | 7655 | 285 |
| CF | 8667.5 | 4 |
| GM | 7719 | 81 |
| SD | 7979 | 639 |
| CU | 8173.5 | 138 |
| BF | 8272 | 39 |
| LS | 8788 | 75 |
| FK | 8991 | 19 |
| GN | 9265 | 33 |
| TD | 9573 | 9 |
| SS | 9820 | 27 |
| NU | 43772 | 2 |
| A2 | 10568 | 98 |
| NE | 10827.5 | 30 |
| NR | 15372 | 1 |
| KI | 23877 | 5 |
| WF | 106161 | 1 |
Queries used (BTW the method to calculate medians is adapted from JonK:
SET @rownum = 0
SELECT AVG(loadEventEnd) AS median_loadEventEnd FROM
  (SELECT (@rownum:= @rownum +1) AS row_number, loadEventEnd FROM (
    SELECT event_loadEventEnd AS loadEventEnd FROM log.NavigationTiming_15033442 WHERE timestamp LIKE '20160127%' AND event_loadEventEnd IS NOT NULL AND wiki = 'enwiki' ORDER BY loadEventEnd) AS unnumberedlist
  ORDER BY loadEventEnd) AS numberedlist
INNER JOIN
  (SELECT COUNT(*) AS total_rows FROM log.NavigationTiming_15033442 WHERE timestamp LIKE '20160127%' AND event_loadEventEnd IS NOT NULL AND wiki = 'enwiki') AS row_counting
ON 1=1
WHERE
numberedlist.row_number >= row_counting.total_rows/2 AND
numberedlist.row_number <= row_counting.total_rows/2+1

SET @rownum = 0
SELECT numberedlist.country, AVG(numberedlist.loadEventEnd) AS median_loadEventEnd, AVG(rows_per_country.total_rows) AS samples FROM
  (SELECT IF(@prev <> ordered_data.country, @rownum:=1, @rownum:= @rownum +1) AS row_number, ordered_data.loadEventEnd, @prev:= ordered_data.country, ordered_data.country AS country FROM (
       SELECT event_loadEventEnd AS loadEventEnd, event_originCountry AS country
       FROM log.NavigationTiming_15033442
       WHERE timestamp BETWEEN '20151223' AND '20160127' AND event_loadEventEnd IS NOT NULL AND wiki = 'enwiki'
       ORDER BY country, loadEventEnd) ordered_data
  ORDER BY country, loadEventEnd) AS numberedlist
INNER JOIN
  (SELECT COUNT(*) AS total_rows, event_originCountry AS country FROM log.NavigationTiming_15033442
  WHERE timestamp BETWEEN '20151223' AND '20160127' AND event_loadEventEnd IS NOT NULL AND wiki = 'enwiki' GROUP BY country)
  AS rows_per_country
ON numberedlist.country = rows_per_country.country
WHERE
numberedlist.row_number >= rows_per_country.total_rows/2 AND
numberedlist.row_number <= rows_per_country.total_rows/2+1
GROUP BY numberedlist.country
ORDER BY numberedlist.loadEventEnd
(edited to add:)
There are some sorting errors in the list (e.g. CF should be further down), also for the mobile version below. The reason is not clear to me; for now I'm assuming that the values are correct and MySQL/MariaDB just messed up the last ORDER BY.
(edited to add:)
SELECT AVG(loadEventEnd) AS median_loadEventEnd FROM
  (SELECT (@rownum:= @rownum +1) AS row_number, loadEventEnd FROM (
    SELECT event_loadEventEnd AS loadEventEnd FROM log.NavigationTiming_15033442 WHERE timestamp BETWEEN '20151223' AND '20160127' AND event_loadEventEnd IS NOT NULL AND wiki = 'enwiki' ORDER BY loadEventEnd) AS unnumberedlist
  ORDER BY loadEventEnd) AS numberedlist
INNER JOIN
  (SELECT COUNT(*) AS total_rows FROM log.NavigationTiming_15033442 WHERE timestamp BETWEEN '20151223' AND '20160127' AND event_loadEventEnd IS NOT NULL AND wiki = 'enwiki') AS row_counting
ON 1=1
WHERE
numberedlist.row_number >= row_counting.total_rows/2 AND
numberedlist.row_number <= row_counting.total_rows/2+1

median_loadEventEnd
1703.0000Comment Actions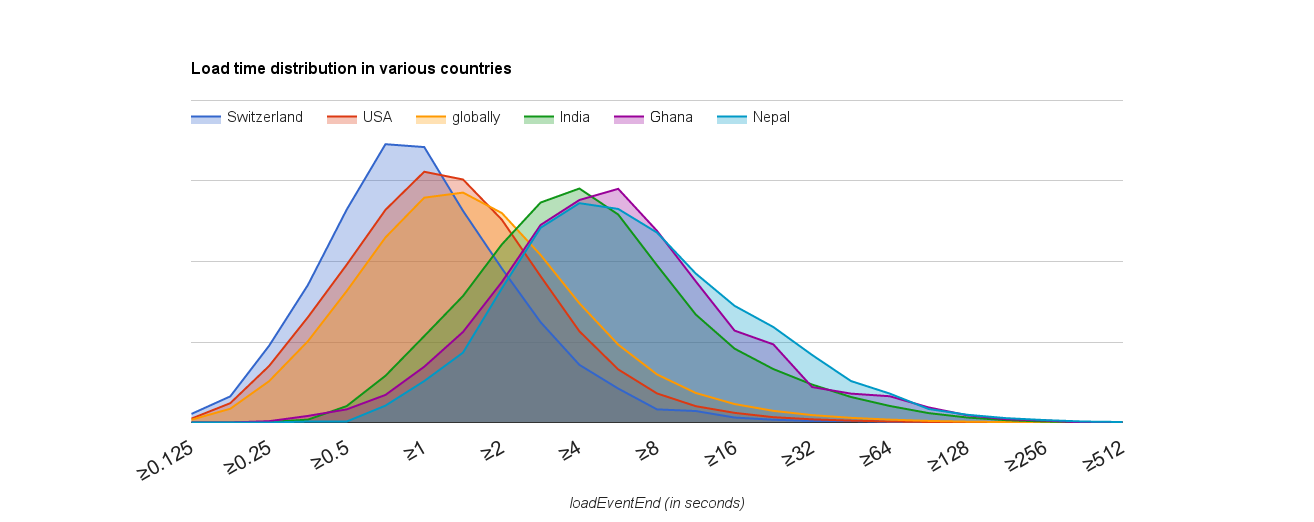
(with some slight rounding errors due to sampling and presentation)
...and here is a chart showing the distribution of loadEventEnd globally and for some of the slowest and fastest countries:
(with some slight rounding errors due to sampling and presentation)
Comment Actions
Thanks, Tilman. For my own edification, what tool did you use to create the chart? It looks like Google Charts, but I am not sure. It is clear and crisp.
Comment Actions
Thanks, Tilman. For my own edification, what tool did you use to create the chart? It looks like Google Charts, but I am not sure. It is clear and crisp.
Sorry, meant to add the details for this one too: The spreadsheet with the chart and the source data is here (you can change the country names in the green cells to generate the same chart for a different set of countries). Data obtained via:
SELECT FLOOR(LOG2(event_loadEventEnd/1000)*2)/2 AS bucket, event_originCountry AS country, COUNT(*) FROM log.NavigationTiming_15033442 WHERE timestamp BETWEEN '20151223' AND '20160127' AND event_loadEventEnd IS NOT NULL AND wiki = 'enwiki' GROUP BY bucket, country ORDER BY bucket, country
I restricted it to enwiki per your rationale at T119797#1853006 , but not yet to the mobile site - starting the queries for that now, too.
Comment Actions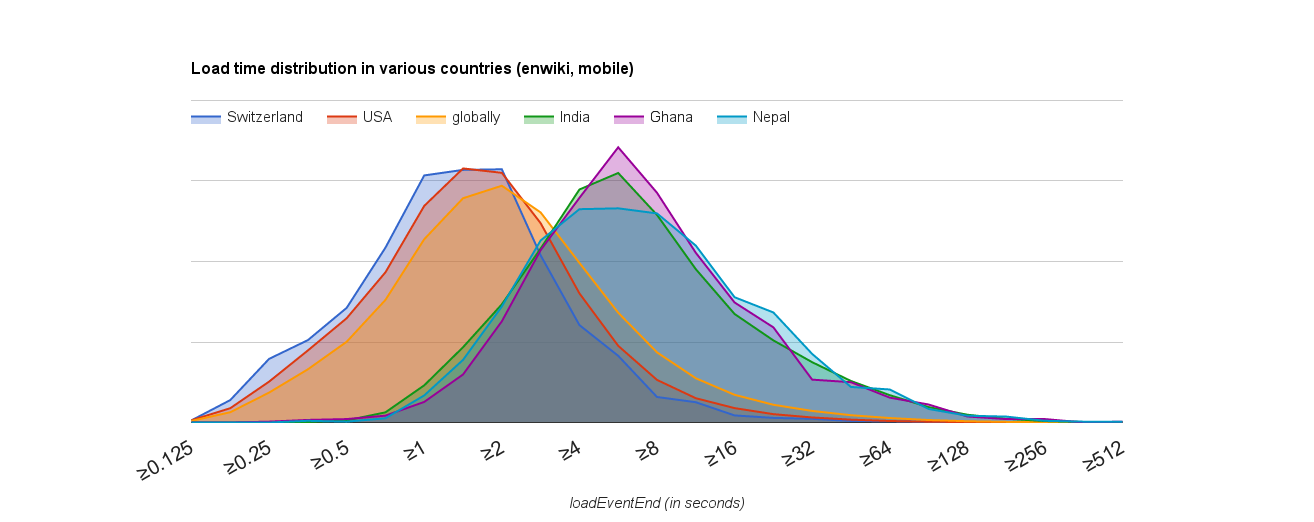
And here is the analogous data and chart restricted to the mobile site (based on seven weeks' worth of data, i.e. two more than above):
loadEventEnd on en.m.wikipedia.org (during Dec 22, 2015 to Feb 8, 2016):
Global median: 2310ms
Chart showing the distribution of loadEventEnd globally and for some of the slowest and fastest countries:
Median speed by country:
| country | median_loadEventEnd | samples |
| PM | 598 | 1 |
| LI | 1086 | 14 |
| GG | 1325 | 158 |
| MC | 1523.5 | 28 |
| DK | 1538 | 8144 |
| NO | 1559 | 9682 |
| SE | 1561 | 16285 |
| GI | 1567 | 103 |
| JE | 1574.5 | 316 |
| CH | 1622 | 5239 |
| LU | 1652 | 518 |
| ST | 6763 | 2 |
| GB | 1738 | 313000 |
| IM | 1793 | 354 |
| NL | 1838 | 17331 |
| US | 1871 | 1215635 |
| IS | 1879 | 925 |
| CA | 1905 | 119779 |
| FO | 1912 | 87 |
| AW | 1983 | 172 |
| BE | 2123 | 5447 |
| FI | 2192 | 9177 |
| BM | 2277.5 | 126 |
| DE | 2210 | 25235 |
| LV | 2229 | 1075 |
| AD | 2291.5 | 38 |
| AT | 2276 | 4135 |
| GL | 2370.5 | 30 |
| LT | 2295 | 1601 |
| SI | 2317 | 2403 |
| EE | 2334 | 1423 |
| PF | 2353 | 25 |
| GW | 3601 | 4 |
| CK | 2373 | 9 |
| FR | 2377.5 | 11928 |
| PR | 2387 | 2580 |
| JP | 2398 | 7123 |
| IE | 2402 | 24651 |
| HU | 2408 | 3883 |
| KY | 2432.5 | 174 |
| VI | 2436 | 127 |
| IL | 2477 | 6123 |
| CZ | 2502.5 | 3066 |
| SK | 2533 | 2051 |
| AI | 2731.5 | 18 |
| MT | 2582.5 | 936 |
| PT | 2615 | 3756 |
| BS | 2624 | 591 |
| RO | 2624 | 7121 |
| AE | 2625 | 12059 |
| ES | 2633 | 12031 |
| MD | 2639.5 | 358 |
| MX | 2646 | 13211 |
| BG | 2655.5 | 3156 |
| UA | 2673 | 2210 |
| IT | 2687 | 15971 |
| HR | 2687.5 | 4930 |
| PL | 2727 | 7512 |
| SM | 2737 | 1 |
| RU | 2763.5 | 6082 |
| CW | 2849.5 | 198 |
| GE | 2854 | 871 |
| RS | 2866 | 4915 |
| KR | 2868 | 5996 |
| KW | 2885 | 2464 |
| GR | 2888 | 7430 |
| BA | 2902 | 1850 |
| QA | 2913 | 2681 |
| AX | 2962 | 28 |
| BH | 2943 | 1547 |
| SX | 2986 | 47 |
| ME | 2988.5 | 550 |
| AL | 2987 | 2034 |
| NZ | 2989 | 13390 |
| SG | 2991 | 20477 |
| DO | 3011 | 1261 |
| TC | 3117 | 52 |
| HK | 3061 | 6804 |
| BY | 3095 | 440 |
| MK | 3113.5 | 1666 |
| AU | 3117 | 80976 |
| TW | 3120 | 3432 |
| PA | 3169 | 912 |
| GU | 3174 | 305 |
| AZ | 3227.5 | 1032 |
| MO | 3263.5 | 204 |
| MN | 3268.5 | 388 |
| AM | 3282 | 468 |
| CY | 3303 | 1041 |
| TR | 3371 | 8794 |
| CR | 3384 | 1286 |
| SA | 3377 | 8524 |
| KN | 3383 | 53 |
| BB | 3393 | 519 |
| CO | 3440.5 | 3150 |
| PS | 3511 | 242 |
| GT | 3480 | 663 |
| MQ | 3547.5 | 42 |
| TT | 3500 | 1655 |
| EC | 3539 | 874 |
| EU | 3560 | 77 |
| HN | 3580 | 500 |
| CV | 5532.5 | 20 |
| JO | 3625 | 1456 |
| SV | 3634 | 462 |
| KZ | 3650 | 766 |
| VG | 3678 | 59 |
| CL | 3698 | 2352 |
| MF | 3737 | 9 |
| BR | 3782 | 12098 |
| PE | 3799 | 1633 |
| MP | 3850.5 | 54 |
| NC | 4196 | 14 |
| IQ | 3840.5 | 1594 |
| NI | 3848 | 265 |
| SR | 3875.5 | 342 |
| MS | 4376 | 4 |
| OM | 3910 | 1569 |
| LB | 3998 | 2392 |
| RE | 4007 | 59 |
| GP | 4121 | 68 |
| MA | 4120.5 | 1648 |
| LC | 4136.5 | 150 |
| GD | 4216 | 84 |
| DM | 4144 | 75 |
| AS | 4276 | 18 |
| UY | 4160 | 547 |
| BQ | 4473 | 16 |
| VC | 4207 | 75 |
| GF | 4373 | 16 |
| AR | 4289 | 3728 |
| TH | 4372 | 7043 |
| BN | 4398 | 741 |
| AG | 4458.5 | 176 |
| TN | 4484.5 | 514 |
| VN | 4491 | 3249 |
| BZ | 4522 | 215 |
| MY | 4526.5 | 23834 |
| PW | 4530 | 3 |
| EG | 4637.5 | 4092 |
| KG | 4666 | 198 |
| SC | 4695 | 56 |
| JM | 4737 | 1799 |
| CN | 4760 | 5650 |
| TO | 4795 | 5 |
| TJ | 5062 | 44 |
| VE | 4986 | 1290 |
| SL | 5235.5 | 26 |
| BO | 5121 | 367 |
| ZA | 5162 | 16995 |
| ID | 5172.5 | 21464 |
| HT | 5235 | 113 |
| MZ | 5242 | 165 |
| FM | 5714 | 6 |
| YT | 6228 | 4 |
| LK | 5310 | 3710 |
| DZ | 5318 | 856 |
| PY | 5357 | 335 |
| AO | 5372 | 437 |
| GY | 5496 | 283 |
| MV | 5621 | 459 |
| MG | 5626 | 59 |
| KH | 5642 | 793 |
| A1 | 5848 | 96 |
| BT | 5727 | 128 |
| CG | 5702 | 15 |
| LA | 5755 | 169 |
| PH | 5765 | 30807 |
| IR | 5773.5 | 5192 |
| MU | 5782 | 1051 |
| SB | 5887.5 | 24 |
| GQ | 12629.5 | 2 |
| PK | 5957 | 17408 |
| FJ | 6049 | 391 |
| WS | 6080 | 7 |
| FK | 8118.5 | 8 |
| CI | 6263 | 97 |
| UZ | 6370.5 | 210 |
| CU | 6489 | 12 |
| LY | 6471 | 193 |
| AF | 6568 | 242 |
| MM | 6553 | 1685 |
| KE | 6607.5 | 2946 |
| CD | 6649 | 55 |
| ZW | 6786 | 335 |
| DJ | 6809 | 53 |
| BD | 6846 | 5272 |
| IN | 6976 | 194134 |
| AP | 7485 | 96 |
| PG | 7196.5 | 168 |
| CM | 7246 | 209 |
| TL | 7254 | 27 |
| NG | 7282 | 7258 |
| ML | 7321 | 29 |
| SZ | 7468.5 | 32 |
| SY | 7387 | 237 |
| NA | 7427 | 296 |
| SN | 7478 | 122 |
| RW | 7533.5 | 130 |
| GH | 7546 | 1880 |
| IO | 7553 | 3 |
| ZM | 7579 | 445 |
| MR | 7999 | 20 |
| GA | 7673.5 | 24 |
| NP | 7692.5 | 1904 |
| BJ | 7873 | 60 |
| TZ | 7788 | 1581 |
| UG | 7792 | 667 |
| TM | 7891 | 52 |
| ET | 7957 | 352 |
| TD | 8888.5 | 6 |
| MW | 8423 | 169 |
| BW | 8450.5 | 328 |
| GM | 8588 | 52 |
| VU | 9895 | 8 |
| BF | 8864 | 25 |
| LR | 8942 | 99 |
| SO | 9029 | 156 |
| BI | 9038 | 15 |
| SD | 9101 | 544 |
| YE | 9412 | 208 |
| NE | 9460 | 21 |
| SS | 10196.5 | 20 |
| GN | 9922 | 25 |
| MH | 9963 | 9 |
| NU | 10134 | 1 |
| LS | 10759 | 59 |
| KI | 17703 | 2 |
| TG | 13524 | 14 |
| A2 | 12675 | 26 |
(I'll see to make this into a nice color-coded world map.)
Queries used:
Global median:
SET @rownum = 0;
SELECT AVG(loadEventEnd) AS median_loadEventEnd FROM
  (SELECT (@rownum:= @rownum +1) AS row_number, loadEventEnd FROM (
    SELECT event_loadEventEnd AS loadEventEnd FROM log.NavigationTiming_15033442 WHERE timestamp BETWEEN '20151222' AND '20160209' AND event_loadEventEnd IS NOT NULL AND wiki = 'enwiki' AND event_mobileMode IS NOT NULL ORDER BY loadEventEnd) AS unnumberedlist
  ORDER BY loadEventEnd) AS numberedlist
INNER JOIN
  (SELECT COUNT(*) AS total_rows FROM log.NavigationTiming_15033442 WHERE timestamp BETWEEN '20151222' AND '20160209' AND event_mobileMode IS NOT NULL AND event_loadEventEnd IS NOT NULL AND wiki = 'enwiki') AS row_counting
ON 1=1
WHERE
numberedlist.row_number >= row_counting.total_rows/2 AND
numberedlist.row_number <= row_counting.total_rows/2+1;
Median per country:
SET @prev ='init';
SET @rownum = 0;
SELECT numberedlist.country, AVG(numberedlist.loadEventEnd) AS median_loadEventEnd, AVG(rows_per_country.total_rows) AS samples FROM
  (SELECT IF(@prev <> ordered_data.country, @rownum:=1, @rownum:= @rownum +1) AS row_number, ordered_data.loadEventEnd, @prev:= ordered_data.country, ordered_data.country AS country FROM (
       SELECT event_loadEventEnd AS loadEventEnd, event_originCountry AS country
       FROM log.NavigationTiming_15033442
       WHERE timestamp BETWEEN '20151222' AND '20160209' AND event_loadEventEnd IS NOT NULL AND wiki = 'enwiki' AND event_mobileMode IS NOT NULL
       ORDER BY country, loadEventEnd) ordered_data
  ORDER BY country, loadEventEnd) AS numberedlist
INNER JOIN
  (SELECT COUNT(*) AS total_rows, event_originCountry AS country FROM log.NavigationTiming_15033442
  WHERE timestamp BETWEEN '20151222' AND '20160209' AND event_loadEventEnd IS NOT NULL AND wiki = 'enwiki' AND event_mobileMode IS NOT NULL GROUP BY country)
  AS rows_per_country
ON numberedlist.country = rows_per_country.country
WHERE
numberedlist.row_number >= rows_per_country.total_rows/2 AND
numberedlist.row_number <= rows_per_country.total_rows/2+1
GROUP BY numberedlist.country
ORDER BY numberedlist.loadEventEnd;
Distribution per country:
SELECT FLOOR(LOG2(event_loadEventEnd/1000)*2)/2 AS bucket, event_originCountry AS country, COUNT(*) FROM log.NavigationTiming_15033442 WHERE timestamp BETWEEN '20151222' AND '20160209' AND event_loadEventEnd IS NOT NULL AND wiki = 'enwiki' AND event_mobileMode IS NOT NULL GROUP BY bucket, country ORDER BY bucket, country
The spreadsheet with the source data and chart is here, again with an easily changeable country selection.
Comment Actions
To recap some of the off-Phab discussion about this:
There are various other interesting directions one can explore about this data from here on. We should figure out what the most important questions are for the purpose of informing actual product decisions. One early thought was to quantify how much connection speed varies among readers in a particular (or in the average) country (using a suitable dispersion measure, e.g. median absolute deviation), but that doesn't seem too relevant right now. For pursuing the idea of using geolocation information to decide whether to serve a version optimized for slow connections, one could define a threshold speed, above which we assume that that version is the better choice for the reader; we could then quickly find all countries where (say) more than 90% of pageviews occur with a slower speed. Etc.
Comment Actions
My 2 cents:
If you want to evaluate actual loading speeds you also need to take a look at the 90th percentile as performance-wise you want to examine the loading event if most of resources come from cache (median) and if is a complete fresh request (90th percentile). The latency distribution is bimodal.
Without those two numbers you cannot know if improvements in performance are truly effective. Or even, what performance really is.
Comment Actions
Thanks Nuria - I already read your thoughtful and interesting Wikitech notes, including the observation that "latency is bimodal"before running these queries. It is however my understanding that on Wikimedia sites, considerably more than 90% of pageviews are cached (96-98% at one point in late 2014), i.e. that this assumption about the 90th percentile is not true on our case. The distribution graphs above appear to confirm this: while that second uncached mode may surely exist, it is not clearly discernable globally and for these example countries, at least not at these resolutions and sample sizes. Anyway, I'll let the performance team weigh in, who have the most experience in measuring this kind of thing and have been relying on medians quite frequently.
Comment Actions
I've covered some of the above data in a recent tech talk, and took the occasion to visualize the country data in two maps:
https://commons.wikimedia.org/wiki/File:Median_Wikipedia_page_load_times_by_country_(mobile,_enwiki,_Dec_2015-Feb_2016).svg https://commons.wikimedia.org/wiki/File:Median_Wikipedia_page_load_times_by_country_(desktop%2Bmobile,_enwiki,_Dec_2015-Jan_2016).svg
Comment Actions
@Tbayer: Really Nice Maps! Would love a link to the talk if any.
It is however my understanding that on Wikimedia sites, considerably more than 90% of pageviews are cached (96-98% at one point in late 2014), i.e. that this assumption about the 90th percentile is not true on our case
This is incorrect, I am talking about client side caching. not server side. Server side you are correct, our requests are cached to a high degree. Client side no, our users request data (just like any web user) with a mix of full and cold caches. Think that every time we deploy a new javascript version of a file every user needs to fetch it and use it until we update it again. This fetching times are going to show on a 90th percentile, not a median. Let me know if this makes sense.
Comment Actions
Yes, from my perspective it was all done some months ago ;)
@ori , I assume you don't need anything else here currently? Happy to do followup analyses as needed. (There have been some other uses for this data since, e.g. here.)
Thanks! The complete slides are here in case they didn't cross your path in the meantime: https://commons.wikimedia.org/wiki/File:New_readership_data_(Wikimedia_Foundation_Tech_Talk).pdf
It is however my understanding that on Wikimedia sites, considerably more than 90% of pageviews are cached (96-98% at one point in late 2014), i.e. that this assumption about the 90th percentile is not true on our case
This is incorrect, I am talking about client side caching. not server side. Server side you are correct, our requests are cached to a high degree. Client side no, our users request data (just like any web user) with a mix of full and cold caches. Think that every time we deploy a new javascript version of a file every user needs to fetch it and use it until we update it again. This fetching times are going to show on a 90th percentile, not a median. Let me know if this makes sense.
The percentage quoted was actually correct ;) but yes, I was talking about server-side caching, and I agree that client-side caching should be taken into account too. That however also means that the "Latency is bimodal" claim was too simplistic in another sense as well (two different kind of caching would correspond to four modes instead of two).
In any case, as we have seen here, it is at odds with the actual data from the English Wikipedia. I have left a comment on the talk page of the Wikitech documentation page: https://wikitech.wikimedia.org/wiki/Talk:Performance/Analytics#.22Latency_is_bimodal.22.2C_and_caching . As before, I guess that the performance team may have other valuable insights.
Comment Actions
That however also means that the "Latency is bimodal" claim was too simplistic in another sense as well (two different kind of caching would correspond to four modes >instead of two).
Given the percentage of our backend caching (i.e. we end up serving mostly from varnish >90% of the time) the signal you are most likely to see is the bimodality due to frontend caching. So, no, you would not see four modes easily in our data. In enwiki you are bundling up all users all countries and thus the bimodality is affected by connection speeds. Makes sense? That doesn't mean that the median is a good representation overall of our user base. Reduce your analysis to users with similar connections and locations and you will see the difference. These are well known issues that affect any website deployed globally, not just enwiki.
See: https://www.igvita.com/2012/04/04/measuring-site-speed-with-navigation-timing/
Comment Actions
Marking as Resolved. @Tbayer Thanks for the data! This is now on Radar/Tracking in both our workboards, so nothing further is happening.