Page MenuHomePhabricator

Text cluster is being hit with an average of 1.8k PURGE requests per second per host
Open, MediumPublic

Description

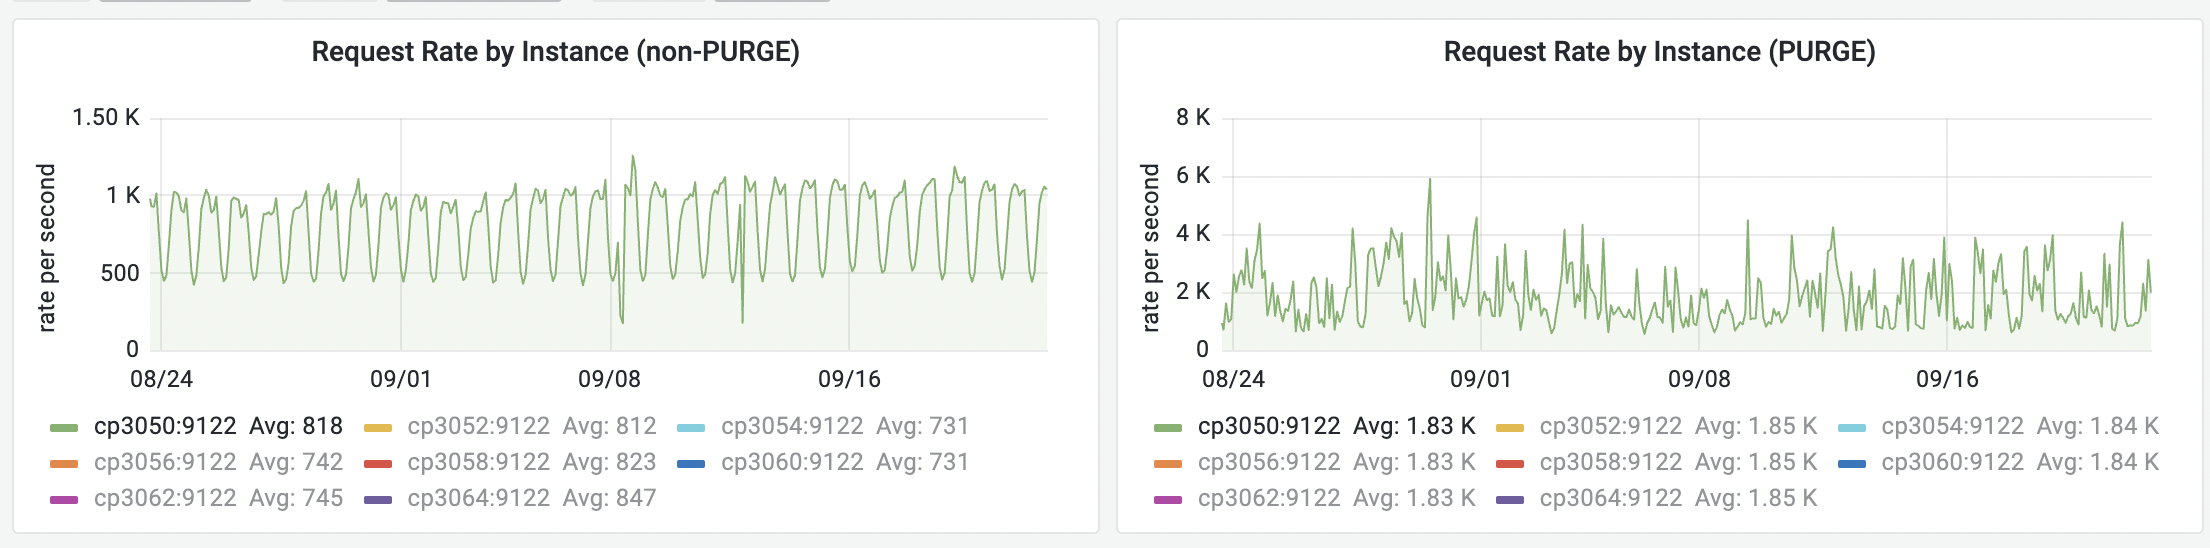
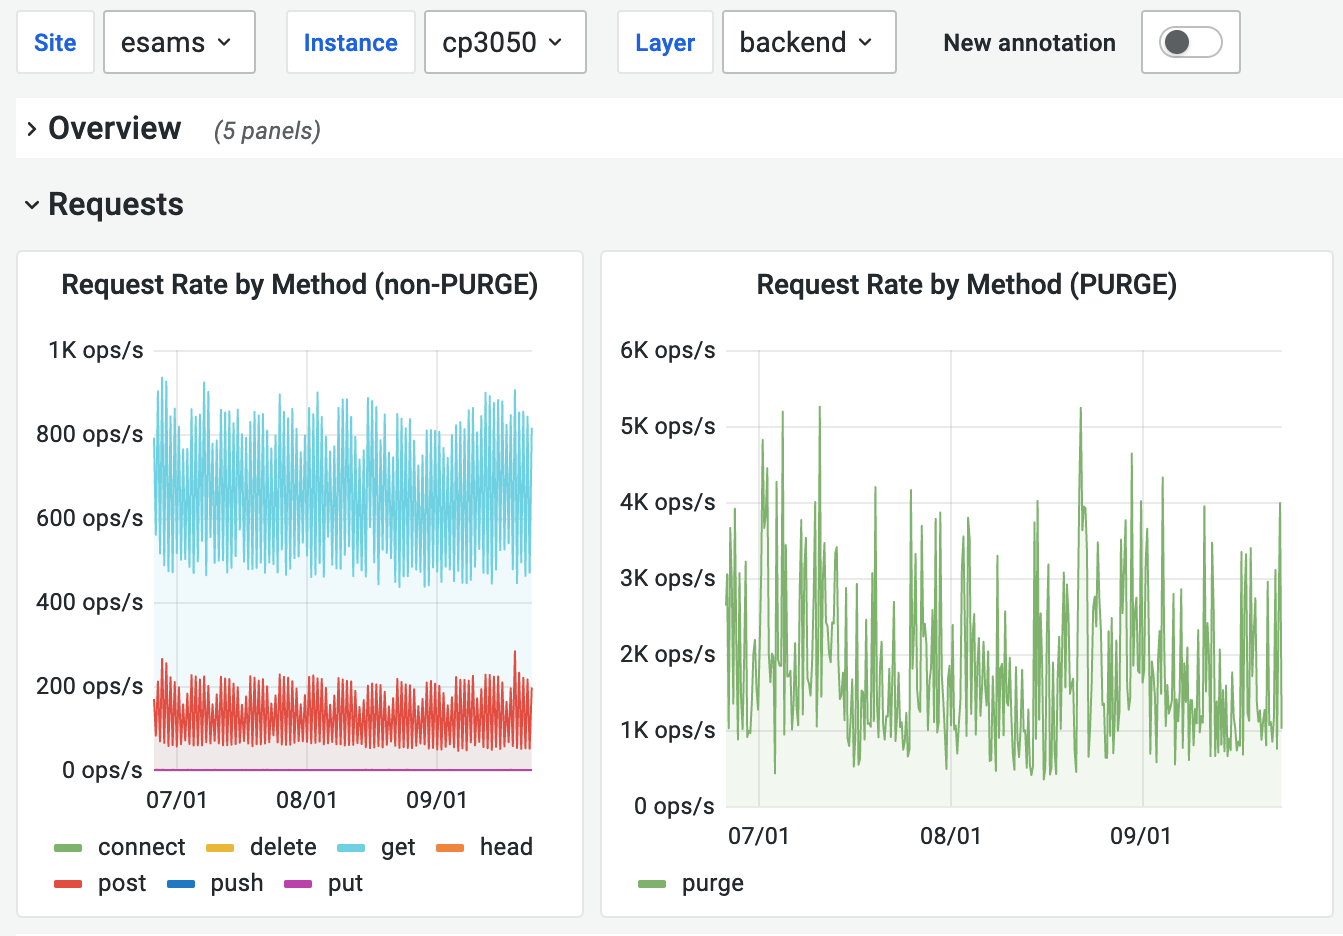
Varnish/ATS are processing on average 1.8k PURGE requests per second on the text cluster. To put this into perspective, ATS handles more PURGE requests than GETs per server on any DC and it's not uncommon to see PURGE requests matching and exceeding the volume of GET requests being handled by varnish in a busy DC like eqiad

An initial 60 seconds capture on one of the test host showed the following top 10 hostnames:

sort purge.log |uniq -c | sort -rn | head -10
 52670 commons.wikimedia.org
 34983 commons.m.wikimedia.org
 34533 tr.wikipedia.org
 25459 en.wikipedia.org
  9296 en.m.wikipedia.org
  1710 de.wikipedia.org
  1584 www.wikidata.org
  1446 m.wikidata.org
   990 uk.wikipedia.org
   825 fr.wikipedia.org

A following 300 seconds capture on the same host shows

$ sort purge.log |uniq -c | sort -rn | head -10
  91377 en.wikipedia.org
  54596 he.wikipedia.org
  15094 en.m.wikipedia.org
  10590 www.wikidata.org
  10590 m.wikidata.org
   9060 he.m.wikipedia.org
   8972 commons.wikimedia.org
   8434 fr.wikipedia.org
   8016 pl.wikipedia.org
   7230 de.wikipedia.org

non-PURGE requests VS PURGE requests hitting ats@cp3050 during the last 30 days:

image.png (548×2 px, 612 KB)

Event Timeline

Vgutierrez triaged this task as Medium priority.Sep 22 2022, 2:48 PM
Vgutierrez renamed this task from Text cluster is being hit with an average of 1.8k PURGE requests per second to Text cluster is being hit with an average of 1.8k PURGE requests per second per host.Sep 23 2022, 8:11 AM

The schema https://schema.wikimedia.org/repositories//primary/jsonschema/resource_change/1.0.0.json allows to include the root event's timestamp causing the PURGE request. Considering that the CDN has a max cap on TTL set at 24h we could safely exclude PURGEs generated by events older than this TTL. Sadly mediawiki and rest base don't currently set root event information:

{"$schema":"/resource_change/1.0.0","meta":{"uri":"http://en.wikipedia.org/api/rest_v1/page/mobile-sections-remaining/File_talk%3ABookworm_Adventures.jpg/414315846","stream":"resource-purge","domain":"en.wikipedia.org","dt":"2022-09-16T08:44:30.651Z","id":"d00a1cae-359b-11ed-b732-295dce798348","request_id":"d00a1caf-359b-11ed-b732-295dce798348"}}
{"$schema":"/resource_change/1.0.0","meta":{"uri":"https://de.m.wikipedia.org/wiki/Vegemite","request_id":"1ffc9449-0501-458d-b39c-12ae655bcd08","id":"93b223d4-270d-454c-bdf9-0f4265b419ee","dt":"2022-09-16T05:49:02Z","domain":"de.wikipedia.org","stream":"resource-purge"},"tags":["mediawiki"]}

non-PURGE requests VS PURGE requests hitting ats@cp3050 during the last 30 days:

image.png (548×2 px, 612 KB)

Which dashboard is this from? (There's quite a few in Grafana for "frontend", "traffic", "ATS" or "Varnish").

I was able to find one a bit like the above for one specific server, Grafana: ATS Instance Drilldown, cp3050.

Screenshot 2022-09-23 at 14.34.23.png (936×1 px, 174 KB)

This appears fairly stable over the past three months. Has something changed that makes this a specific issue today? What threshold should we aim for? What would the cost be of maintaining current levels as-is? (e.g. infrastructure improvements).

Past issues:

General open issue:

The dashboard is https://grafana.wikimedia.org/d/kHk7W6OZz/ats-cluster-view?orgId=1&var-site=esams&var-layer=backend&var-cluster=text&from=now-30d&to=now.
We also have a purged specific dashboard showing data per instance: https://grafana.wikimedia.org/d/RvscY1CZk/purged?orgId=1.

We are aware that this isn't a new issue @Krinkle, this task is the consequence of @Ladsgroup and myself talking during the SRE Summit in Prague. Happy to tag this as a duplicate of T250205 if required, but it seems that not only MW is responsible for a big amount of PURGEs but rest base as well

@Krinkle Note that it's not mediawiki, 88% of the purges are something like domain.org/api/rest_v1/ and coming from restbase.