We should track the mean time to merge, probably per repo?, so we can see trends and the effects of changes to eg test coverage or hardware changes.
Version: wmf-deployment
Severity: enhancement
| greg | |
| Jul 16 2014, 5:14 PM |
| F2362837: render-5.png | |
| Aug 25 2015, 8:54 PM |
| F2362908: render-6.png | |
| Aug 25 2015, 8:54 PM |
| F2332350: render-4.png | |
| Aug 24 2015, 8:21 PM |
| F14483: mwcore-postmerge-zuul-mean-time.png | |
| Nov 22 2014, 3:37 AM |
We should track the mean time to merge, probably per repo?, so we can see trends and the effects of changes to eg test coverage or hardware changes.
Version: wmf-deployment
Severity: enhancement
| Status | Subtype | Assigned | Task | ||
|---|---|---|---|---|---|
| Resolved | greg | T107905 Create KPIs for #releng-201516-Q2 | |||
| Resolved | hashar | T108750 Implement "Jenkins/Zuul queue wait" KPI | |||
| Resolved | hashar | T70113 Alert when Zuul/Gearman queue is stalled | |||
| Resolved | hashar | T70114 Track and graph mean time to merge |
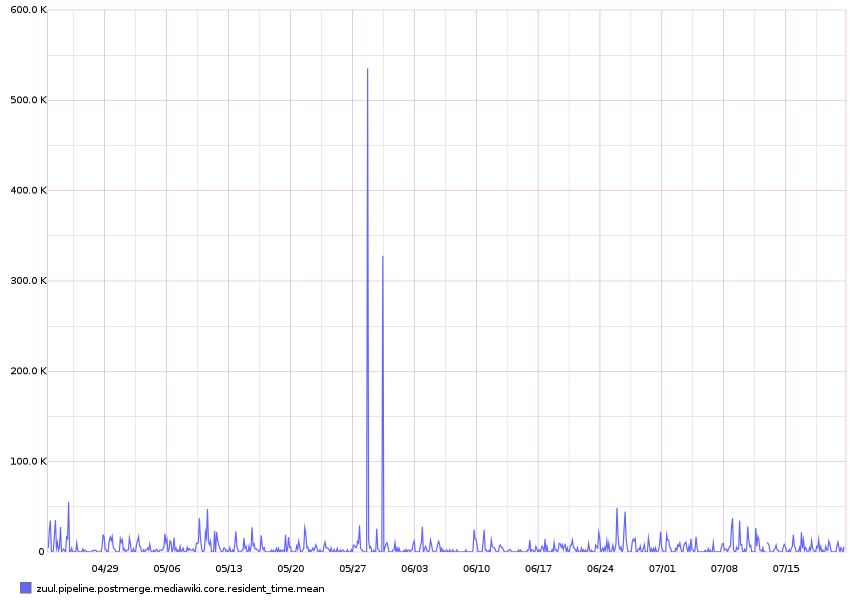
Created attachment 15992
Mean time spent in Zuul/Jenkins by Mediawiki core changes after they are merged
Zuul reports a bunch of metrics to Graphite over statsd. The metrics are described at : http://ci.openstack.org/zuul/statsd.html#metrics
One of them is the time spent by a change in a the queue (which is Zuul overhead + the time to build all the jobs).
We could graph somewhere the meantime of jobs triggered after a merge. Though I am not sure how helpful it is going to be. The metric is zuul.pipeline.postmerge.mediawiki.core.resident_time.mean
The attached graphs represents the last three months. The URL is http://graphite.wikimedia.org/render/?width=856&height=600&_salt=1405949992.208&from=-3months&target=zuul.pipeline.postmerge.mediawiki.core.resident_time.mean
The time to run jobs depends on number of jobs executing on the server. Zuul/Jenkins would hold them until a slot is free up. So that is not very representative.
Attached:
The resident_time metric reported by Zuul is the time delta between the change entering a pipeline and it leaving it (regardless of success). So that is related.
We have years of history! A couple of examples over the last two years for the gate-and-submit pipeline:
The same solely for mediawiki/core https://graphite.wikimedia.org/render/?width=960&height=563&_salt=1440446658.234&from=-2years&connectedLimit=&drawNullAsZero=true&lineMode=connected&target=zuul.pipeline.gate-and-submit.mediawiki.core.resident_time.upper
I am not very confident in graphite/statsd aggregation, but that gives a rough idea.
You can even find out something happened early April 2015 that slowed down the mediawiki-core gate which went from less than 200 seconds to 500 seconds:
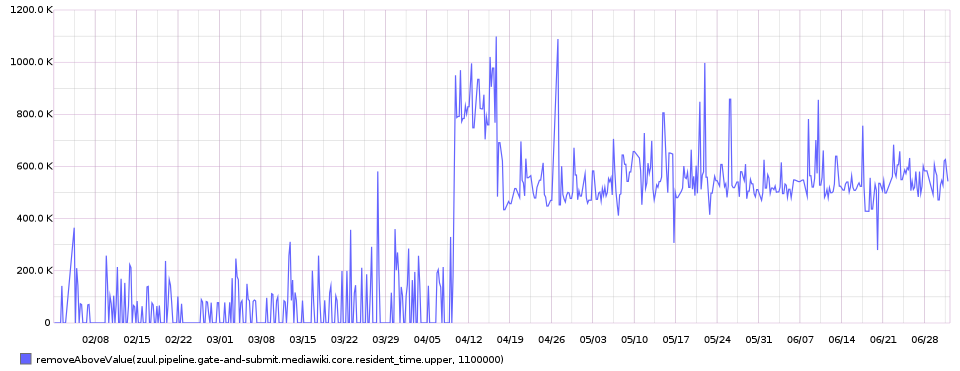
That is due to the switch from a real server + sqlite to labs instance + mysql.
I am pretty sure the mean/lower/upper aggregate are wrong in Graphite. They seem to always use average for consolidation :-(
Additional note: I am not sure what resident_time is. Potentially that is the different between enqueue and dequeue time. If a change is reenqueued in the gate-and-submit pipeline, that might well be a new item and thus the enqueue time would be reset ...
I looked a bit more at it. When a change enter a Zuul pipeline, the time is saved. When the change leave the pipeline (the jobs are completed and the job reported, the change is dequeued ...) Zuul emits a timer metric to statsd in miliseconds.
For the gate-and-submit pipeline, the timer is available in Graphite under zuul.pipeline.gate-and-submit.resident_time. Statsd buffer the metrics over a minute and report back the lower and upper value (potentially mean, stddev, percentiles and median as well but that apparently does not work).
By scaling the value by 0.001 we can thus get the min/max time in seconds changes takes over a period of time.
A lame experiment over 3 months:

We might care about how fast the gate process job, but for the sake of an exercise lets look at the slowness which is what people usually complains about. The next graph shows over a month:
The worth is 2480 seconds or 40 minutes around August 20th, I can probably track that specific change. Maybe a percentile would be more useful.

conclusion
It seems Zuul provides potentially useful metrics. I would need help to figure out what we really want to measure / track / report.
A change staying 40 minutes could be because it had to be rerun a few time if changes ahead of it in the gate queue failed for some reason. Zuul dequeue the falling change and rebuild all the changes behind again.
The mediawiki core job that runs PHPUnit under Zend, takes 7-10 minutes IIRC (that is available in zuul statsd), making it faster would definitely improve this metric.
I assigned to Antoine to run point, but now I'm unassigning. I'll let @hashar, @dduvall, and @zeljkofilipin figure it out :)