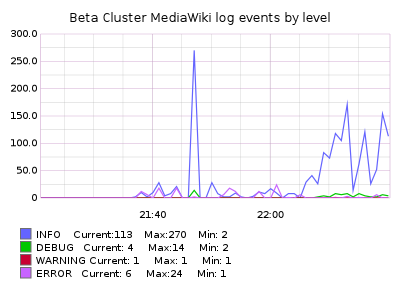
@bd808 observes that there exists a class of cluster issues that Logstash is especially good at disclosing -- namely, any issue that results in a spike in the volume of log messages sent on a particular channel. If the rate of log records per channel were forwarded to Graphite, we could easily set up anomaly-detection-based alerting. LogStash apparently has a Graphite sink that makes this straightforward to do: https://www.elastic.co/guide/en/logstash/current/plugins-outputs-graphite.html
Description
Description
Details
Details
| Subject | Repo | Branch | Lines +/- | |
|---|---|---|---|---|
| logstash: Count MediaWiki log events with statsd | operations/puppet | production | +107 -1 |
Event Timeline
Comment Actions
Change 230233 had a related patch set uploaded (by BryanDavis):
logstash: Count MediaWiki log events with statsd
Comment Actions
On the gerrit patch @fgiunchedi wrote:
I'm assuming the statsd ruby client underneath will send a statsd sample for each line? depending on the volume it might pose problems, see also T89857#1519939
@bd808 responded:
Based on what I'm seeing in logstash for the last 48 hours I think we can expect this to record 750-900 events per second. Looking at the plugin itself (https://github.com/logstash-plugins/logstash-output-statsd/blob/master/lib/logstash/outputs/statsd.rb), I would guess that these events are sent individually to the statsd endpoint (no batching).
The metrics being generated here are unique to Logstash so we could aggregate them with a dedicated statsd endpoint. They will be coming from three Logstash frontends so we do need a single point of aggregation rather than allowing each Logstash host to have its own local statsd. That could be changed by inserting an identifier for the collecting Logstash host into the metric names ("logstash.$HOST.rate.mediawiki.$CHANNEL.$LEVEL") at a cost of 3x data storage and slightly more complicated queries to generate graphs from the aggregate data.
I've been thinking about this a bit more and have an idea that might not suck:
On each host that is running Logstash we could also provision a statsite service configured to flush every 1s (or 10s) using a flush script that knows how to relay data to another statsite service. These would be pointed at the central statsdlb/statsite service. Since the metrics we are looking to record here are simple counts, having multiple layers of aggregation won't hurt anything.
Comment Actions
@fgiunchedi said on the patch that 1k/s wasn't too horrible of an event rate so no fancy gymnastics will be required \o/
Comment Actions
Change 230233 merged by Filippo Giunchedi:
logstash: Count MediaWiki log events with statsd
Comment Actions
Change 231704 had a related patch set uploaded (by BryanDavis):
Add icinga alert for anomalous logstash.rate.mediawiki.memcached.ERROR.count