Page MenuHomePhabricator

High number of (session) redis connection failures
Closed, ResolvedPublic

Assigned To
Authored By
hoo
Jul 26 2015, 4:50 PM
Referenced Files
F281697: graph3.png
Jul 29 2015, 1:17 AM
F281693: graph1.png
Jul 29 2015, 1:17 AM
F281695: graph2.png
Jul 29 2015, 1:17 AM
F272670: screenshot_kdwfeQ.png
Jul 27 2015, 8:50 AM
F272666: screenshot_8RTsG4.png
Jul 27 2015, 8:50 AM

Description

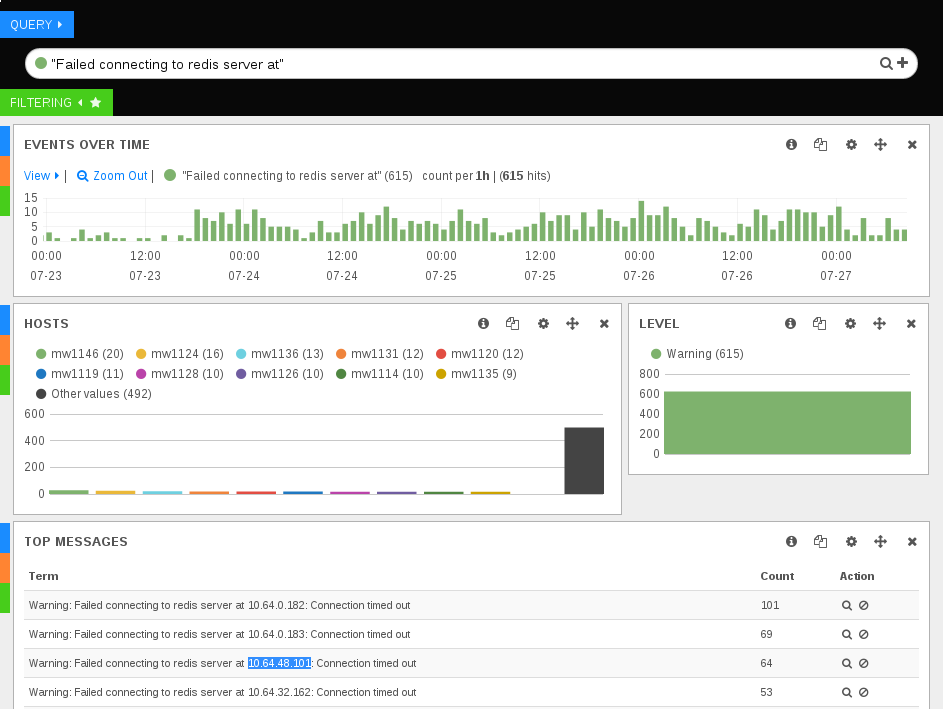
The number of connection timeouts to the session redis servers (which are on the mc* boxes) is worryingly high, lately.

hoo@fluorine:/a/mw-log$ zgrep -c 'Failed connecting to redis server' archive/hhvm.log-201507*
archive/hhvm.log-20150701.gz:0
archive/hhvm.log-20150702.gz:0
archive/hhvm.log-20150703.gz:2
archive/hhvm.log-20150704.gz:1
archive/hhvm.log-20150705.gz:0
archive/hhvm.log-20150706.gz:0
archive/hhvm.log-20150707.gz:2
archive/hhvm.log-20150708.gz:0
archive/hhvm.log-20150709.gz:1
archive/hhvm.log-20150710.gz:1
archive/hhvm.log-20150711.gz:1
archive/hhvm.log-20150712.gz:1
archive/hhvm.log-20150713.gz:0
archive/hhvm.log-20150714.gz:0
archive/hhvm.log-20150715.gz:0
archive/hhvm.log-20150716.gz:0
archive/hhvm.log-20150717.gz:0
archive/hhvm.log-20150718.gz:1
archive/hhvm.log-20150719.gz:0
archive/hhvm.log-20150720.gz:6
archive/hhvm.log-20150721.gz:5
archive/hhvm.log-20150722.gz:9
archive/hhvm.log-20150723.gz:117
archive/hhvm.log-20150724.gz:514
archive/hhvm.log-20150725.gz:597
archive/hhvm.log-20150726.gz:670

This might be related to T102199.

Event Timeline

hoo raised the priority of this task from to Needs Triage.
hoo updated the task description. (Show Details)
hoo added a project: acl*sre-team.
hoo added subscribers: hoo, ori.
ori triaged this task as Unbreak Now! priority.Jul 26 2015, 9:08 PM
ori set Security to None.
ori added a subscriber: aaron.

the increase seem to jump at 20150723-18:00 according to logstash:

screenshot_8RTsG4.png (709×943 px, 58 KB)

also a jump in redis clients:

screenshot_kdwfeQ.png (491×857 px, 129 KB)

that seems to coincide with 1.25wmf16 1.25wmf15 ?

23:02 logmsgbot: catrope Synchronized wmf-config/InitialiseSettings.php: Enable geo feature usage tracking on all wikis (duration: 00m 12s)
21:19 hashar: is already a nice improvement
20:33 twentyafterfour: deployed hotfix for T106716, restarted apache on iridium
18:46 logmsgbot: catrope Synchronized php-1.26wmf15/resources/src/mediawiki.less/mediawiki.ui/mixins.less: Unbreak quiet button styles (duration: 00m 13s)
18:10 logmsgbot: twentyafterfour rebuilt wikiversions.cdb and synchronized wikiversions files: all wikis to 1.26wmf15
17:56 logmsgbot: jynus Synchronized wmf-config/db-codfw.php: Repooling es2004 after hardware maintenance (duration: 00m 11s)
17:56 logmsgbot: jynus Synchronized wmf-config/db-eqiad.php: Repooling es2004 after hardware maintenance (duration: 00m 12s)
17:38 legoktm: running foreachwikiindblist /home/legoktm/largebutnotenwiki.dblist populateContentModel.php --ns=all --table=page
16:27 ori: restarted hhvm on mw1221
16:16 logmsgbot: thcipriani Finished scap: SWAT: Add azb interwiki sorting, Add Southern Luri, and Fix name of S and W Balochi (duration: 06m 13s)

I am going to depool db1035, it happens around the same time and it is giving me connections errors too. Jobs (redis) on that host are failing me.

1{
2 "_index": "logstash-2015.07.27",
3 "_type": "mediawiki",
4 "_id": "AU7O0VKNFf0qJil09ybj",
5 "_score": null,
6 "_source": {
7 "message": "Error connecting to 10.64.16.24: Can't connect to MySQL server on '10.64.16.24' (4)",
8 "@version": 1,
9 "@timestamp": "2015-07-27T09:21:39.730Z",
10 "type": "mediawiki",
11 "host": "mw1004",
12 "level": "ERROR",
13 "tags": [
14 "syslog",
15 "es",
16 "es",
17 "normalized_message_untrimmed"
18 ],
19 "channel": "wfLogDBError",
20 "url": "/rpc/RunJobs.php?wiki=mgwiktionary&type=recentChangesUpdate&maxtime=30&maxmem=300M",
21 "ip": "127.0.0.1",
22 "http_method": "POST",
23 "server": "127.0.0.1",
24 "referrer": null,
25 "uid": "d2c87ba",
26 "process_id": 22722,
27 "wiki": "mgwiktionary",
28 "db_server": "10.64.16.24",
29 "db_name": "mgwiktionary",
30 "db_user": "wikiuser",
31 "method": "DatabaseMysqlBase::open",
32 "error": "Can't connect to MySQL server on '10.64.16.24' (4)",
33 "normalized_message": "Error connecting to 10.64.16.24: Can't connect to MySQL server on '10.64.16.24' (4)"
34 },
35 "sort": [
36 1437988899730
37 ]
38}

I depooled db1035 at 10:07 and it solved the database issues, but I think it is unrelated to this issue, my apologies:

$ grep -c '2015-07-27 07:' redis.log 
0
$ grep -c '2015-07-27 08:' redis.log 
26
$ grep -c '2015-07-27 09:' redis.log 
54
$ grep -c '2015-07-27 10:' redis.log 
54
$ grep -c '2015-07-27 11:' redis.log 
51
$ grep -c '2015-07-27 12:' redis.log 
49
$ grep 'Failed connecting to redis server' hhvm.log | grep -c "Jul 27 07"
0
$ grep 'Failed connecting to redis server' hhvm.log | grep -c "Jul 27 08"
9
$ grep 'Failed connecting to redis server' hhvm.log | grep -c "Jul 27 09"
18
$ grep 'Failed connecting to redis server' hhvm.log | grep -c "Jul 27 10"
21
$ grep 'Failed connecting to redis server' hhvm.log | grep -c "Jul 27 11"
22
$ grep 'Failed connecting to redis server' hhvm.log | grep -c "Jul 27 12"
13

Change 227353 had a related patch set uploaded (by Ori.livneh):
Revert "Conversion to using getMainStashInstance()"

https://gerrit.wikimedia.org/r/227353

Change 227354 had a related patch set uploaded (by Ori.livneh):
Revert "Conversion to using getMainStashInstance()"

https://gerrit.wikimedia.org/r/227354

Change 227354 merged by jenkins-bot:
Revert "Conversion to using getMainStashInstance()"

https://gerrit.wikimedia.org/r/227354

Looks like the hhvm.log errors at "Connection timed out" (from https://github.com/facebook/hhvm/blob/master/hphp/system/php/redis/Redis.php). That's from the PHP C fsockopen() wrapper.

I don't see the "too many clients" error, and the graphs show very low conns/server, so even 1k ulimit can't be the issue there.

I have a vague idea that https://phabricator.wikimedia.org/rEABF9ffa4003226c46813dfd6616ce173252b1f258c2 was surfacing a problem that already existed more often. It's probably best to leave it reverted for the moment, especially to get an idea if the rate of failure decreases linearly with the decrease in requests. I have a feeling it won't (in a good way), but that's just a guess. I was able to correlate a couple instances of these failures on flourine with a redis server I was strace'ing. I have put the logs for that on mc1004:/tmp# /home/rush/redisfailures.txt I don't see a smoking gun there.

Failures that are shown...or not shown in that strace -o file from flourines view:

2015-07-27 22:13:41 mw1125 enwiki redis INFO: Could not connect to server 10.64.0.183 {"private":false}
2015-07-27 22:17:21 mw1126 eswiki redis INFO: Could not connect to server 10.64.0.183 {"private":false}

Using a really simple redis client on mw1145 and a few mw* hosts I was able to generate some failures per 100K requests. Generally 5-8 failures to connect on a timeout of 1s, which go away as I increase the timeout to 2 or 3 seconds in general. What is the timeout in production for our redis client?

Still a bit sick and I'm out of ideas for the moment. Maybe this digging will lead someone else to something.

Edit few notes from irc:

per ori commands for redis did plummet on the revert

http://ganglia.wikimedia.org/latest/graph.php?r=2hr&z=xlarge&c=Memcached+eqiad&h=mc1004.eqiad.wmnet&jr=&js=&v=781260801&m=total_commands_processed&vl=commands&ti=total_commands_processed

Also I was only able to mock the failure to connect errors from mw* hosts, I tried from the mc* host to itself (even teh same ip) and it never happened.

we could run a redis server with a higher verbosity logging format.

Is that graph supposed to be instantaneous_ops_per_sec? I would expect a total_commands_processed graph to just be non-decreasing except on restarts.

Is that graph supposed to be instantaneous_ops_per_sec? I would expect a total_commands_processed graph to just be non-decreasing except on restarts.

Good point. I believe this is being collected based on config at modules/redis/templates/redis.pyconf.erb and from what I can see it is collecting the correct param but it must be providing a delta at collection time. So I think this is somewhat of a hybrid between osp_per_second and total_commands_proc.

Another view of the drop yesterday http://ganglia.wikimedia.org/latest/graph.php?r=week&z=xlarge&c=Memcached+eqiad&h=mc1004.eqiad.wmnet&jr=&js=&v=330103469&m=total_connections_received&vl=connections&ti=total_connections_received

Problem outline:

On july 23rd redis connection failures in prod jumped by an order of magnitude

Current thoughts:

I'm at a stopping point here where I think we need to (re)consider a few courses of action. It seems our memcache timeout in prod is 250ms and our redis timeout is not set and the default is 1s. mc also uses nutcracker which does some of the heavy lifting re: connection pooling. There are a number of things recently that have been transitioned from mc to redis.

I have a basic client to test connection stability to redis and it looks like:

At 1s timeout to redis (current)

`root@mw1145:~# time python redis_ping.py 10.64.0.182 100000
2015-07-28 18:04:50.603766 False
2015-07-28 18:05:53.026698 False
2015-07-28 18:05:54.176192 False
2015-07-28 18:06:02.526792 False
2015-07-28 18:06:08.590672 False
2015-07-28 18:06:30.068330 False
total 100000 success 99994 fail 6

real	1m51.521s
user	0m16.586s
sys	0m10.152s
root@mw1145:~# time python redis_ping.py 10.64.0.184 100000
2015-07-28 18:06:45.906544 False
2015-07-28 18:07:06.393795 False
2015-07-28 18:07:17.574715 False
2015-07-28 18:07:44.790226 False
2015-07-28 18:07:45.932216 False
2015-07-28 18:08:04.931007 False
2015-07-28 18:08:32.525274 False
2015-07-28 18:08:45.969720 False
2015-07-28 18:08:49.650869 False
total 100000 success 99991 fail 9

real	2m14.066s
user	0m16.456s
sys	0m10.080s
root@mw1145:~# nano redis_ping.py
root@mw1145:~# time python redis_ping.py 10.64.0.184 100000
2015-07-28 18:09:38.737441 False
2015-07-28 18:10:05.662665 False
2015-07-28 18:10:16.266753 False
2015-07-28 18:10:28.006834 False
2015-07-28 18:10:29.010556 False
2015-07-28 18:10:47.050115 False
2015-07-28 18:10:49.234414 False
total 100000 success 99993 fail 7

real	1m55.245s
user	0m16.496s
sys	0m10.151s

At 2s timeout to redis...

root@mw1145:~# time python redis_ping.py 10.64.0.184 100000
total 100000 success 100000 fail 0

real	1m46.648s
user	0m16.302s
sys	0m10.051s

root@mw1145:~# time python redis_ping.py 10.64.0.182 100000
total 100000 success 100000 fail 0

real	1m49.580s
user	0m16.142s
sys	0m10.108s`

I think a portion of the mc->redis migration is related to T97620: Convert various core/extension cache users to ReplicatedBagOStuff and https://phabricator.wikimedia.org/T88493#1414536 and on down in the service of T88493

The order of magnitude jump in redis connection errors happened on the 23rd when https://phabricator.wikimedia.org/diffusion/MW/browse/wmf%252F1.26wmf15/ hit the wikipedias but https://gerrit.wikimedia.org/r/#/c/221885/5 isn't far behind.

https://gerrit.wikimedia.org/r/#/c/221885/
https://gerrit.wikimedia.org/r/#/c/221889/

If I break down the errors by mc* host https://phabricator.wikimedia.org/P1076#4926 it does seem interesting that 5 of the top 7 offenders are in rack A5. That switch seems to be somewhat suspect in terms of buffering and connection rate handling, but I don't think it's purely indicative of isolation of failure since it is so spread around otherwise.

I think the general theme here is the aggregate change in usage pattern for redis has resulted in a large increase in failures. This is probably due to a combination of factors at the heart but primarily connection pool handling and buffering that a large timeout smooths over.

We could:

  1. explore nutcracker'ing redis traffic and hope the connection pooling helps this in teh same way it seems to be for memcache T107178
  2. raise the timeout in prod for a short exporatory period to see if failures reduce and if so it probably indicates we need to back out much of the https://phabricator.wikimedia.org/diffusion/MW/browse/wmf%252F1.26wmf15/ mc->redis migrations
  3. pull back much of the recent redis load from the 23rd and do more testing pre-prod
  4. explore tuning redis live in prod

It seems like redis in general needs more tuning and testing at scale for the use cases coming down the line. Hopefully I'm wrong and there is some easier and obvious solution.

explore nutcracker'ing redis traffic and hope the connection pooling helps this in the same way it seems to be for memcache T107178

Yes, let's give it a shot. We have wanted to try it anyway. I made the requisite changes to the production nutcracker configuration already.

Change 227620 had a related patch set uploaded (by Ori.livneh):
Switch over the 'sessions' ObjectCache to nutcracker

https://gerrit.wikimedia.org/r/227620

Change 227620 merged by jenkins-bot:
Switch over the 'sessions' ObjectCache to nutcracker

https://gerrit.wikimedia.org/r/227620

I configured MediaWiki to use Nutcracker for connections to the sessions redis cluster a little over an hour ago. We have not had an error since, and the rate of edit failures due to loss of session data is down relative to its value pre-switchover.

The redis metrics in ganglia show a higher number of overall active connections, but the rate at which new connections are coming in has dropped to zero. This is expected; it means Nutcracker's connections are indeed persistent.

graph1.png (308×586 px, 31 KB)

graph2.png (457×781 px, 44 KB)

graph3.png (457×781 px, 30 KB)

ori claimed this task.

Change 227353 abandoned by Ori.livneh:
Revert "Conversion to using getMainStashInstance()"

Reason:
Per Aaron

https://gerrit.wikimedia.org/r/227353