Page MenuHomePhabricator

Audit groups of metrics in Graphite that allocate a lot of disk space
Closed, ResolvedPublic

Description

New report as of 2017/06/21. eventstreams is tracked at T160644: Eventstreams graphite disk usage already

root@graphite1001:/var/lib/carbon/whisper# du -hcs /var/lib/carbon/whisper/* | grep G | sort -rn
433G	/var/lib/carbon/whisper/eventstreams
199G	/var/lib/carbon/whisper/servers
199G	/var/lib/carbon/whisper/instances
137G	/var/lib/carbon/whisper/ores
71G	/var/lib/carbon/whisper/MediaWiki
50G	/var/lib/carbon/whisper/zuul
46G	/var/lib/carbon/whisper/varnishkafka
35G	/var/lib/carbon/whisper/frontend
Event Timeline

fgiunchedi claimed this task.
fgiunchedi raised the priority of this task from to Needs Triage.
fgiunchedi updated the task description. (Show Details)
fgiunchedi added a project: acl*sre-team.
fgiunchedi changed Security from none to None.
fgiunchedi subscribed.

another potential avenue of investigation from hashar

>    I have some examples related to continuous integration:

>   A) jenkins.ci , emitted by Jenkins, metrics namespaced as follow:

>     - job_name (roughly 4000 jobs)
>     - build status (4: success, failure, aborted, unstable)

>    Each having percentiles, count, max, mean, rate etc (12 entries)


good catch! looks like these shouldn't get additional metrics calculated by statsd, that would cut it by 12x. definitely worth investigating what's going on

to find out what files have been created recently we can exploit the fact that carbon-cache logs whenever it creates a new file. reqstats is there but seems a minority:

root@tungsten:/var/log/upstart# zgrep  -F 'creating ' /var/log/upstart/carbon_cache-*.gz | cut -d' ' -f8 | sort | grep -i reqstats
/var/lib/carbon/whisper/reqstats/2_wikipedia_org/pageviews.wsp
/var/lib/carbon/whisper/reqstats/5yojb4_en_wikipedia_org/pageviews.wsp
/var/lib/carbon/whisper/reqstats/Mai_wikipedia_org/pageviews.wsp
/var/lib/carbon/whisper/reqstats/Mai_wikipedia_org/tp50.wsp
/var/lib/carbon/whisper/reqstats/Mai_wikipedia_org/tp99.wsp
/var/lib/carbon/whisper/reqstats/action_wikipedia_org/pageviews.wsp
/var/lib/carbon/whisper/reqstats/bn_m__wikipedia_org/pageviews.wsp
/var/lib/carbon/whisper/reqstats/crsio_org/pageviews.wsp
/var/lib/carbon/whisper/reqstats/crsio_org/tp50.wsp
/var/lib/carbon/whisper/reqstats/crsio_org/tp99.wsp
/var/lib/carbon/whisper/reqstats/during_World_War_IIwikipedia_org/pageviews.wsp
/var/lib/carbon/whisper/reqstats/edits/2013_wikipedia_org/tp99.wsp
/var/lib/carbon/whisper/reqstats/edits/EN_wikipedia_org/edit.wsp
/var/lib/carbon/whisper/reqstats/edits/action_wikipedia_org/edit.wsp
/var/lib/carbon/whisper/reqstats/edits/fa_m_wikivoyage_org/submits.wsp
/var/lib/carbon/whisper/reqstats/edits/mai_wikipedia_org/edit.wsp
/var/lib/carbon/whisper/reqstats/edits/title_wikipedia_org/tp99.wsp
/var/lib/carbon/whisper/reqstats/el_wikiipedia_org/pageviews.wsp
/var/lib/carbon/whisper/reqstats/en_wikiquosity_org/pageviews.wsp
/var/lib/carbon/whisper/reqstats/hi__wikipedia_org/pageviews.wsp
/var/lib/carbon/whisper/reqstats/mai_wikipedia_org/pageviews.wsp
/var/lib/carbon/whisper/reqstats/norb_rulez_org/pageviews.wsp
/var/lib/carbon/whisper/reqstats/pap_m_wikibooks_org/tp50.wsp
/var/lib/carbon/whisper/reqstats/philipminhparish_org/pageviews.wsp
/var/lib/carbon/whisper/reqstats/sfair_org/pageviews.wsp
/var/lib/carbon/whisper/reqstats/wpDestFile_wikipedia_org/pageviews.wsp
/var/lib/carbon/whisper/reqstats/www_NL_wikipedia_org/pageviews.wsp
/var/lib/carbon/whisper/reqstats/www_echolalie_org/pageviews.wsp
/var/lib/carbon/whisper/reqstats/www_ietf_org/pageviews.wsp
/var/lib/carbon/whisper/reqstats/www_ja_wikiipedia_org/pageviews.wsp
/var/lib/carbon/whisper/reqstats/www_sugarlabs_org/pageviews.wsp
/var/lib/carbon/whisper/reqstats/www_urbansim_org/pageviews.wsp
/var/lib/carbon/whisper/reqstats/www_veteranosracingferrol_org/pageviews.wsp
/var/lib/carbon/whisper/reqstats/www_wikimania_org/tp50.wsp
/var/lib/carbon/whisper/reqstats/www_wikimania_org/tp99.wsp
/var/lib/carbon/whisper/reqstats/www_za_wikiversity_org/pageviews.wsp
/var/lib/carbon/whisper/reqstats/zh_wikipedia_orgzh_wikipedia_org/pageviews.wsp
/var/lib/carbon/whisper/reqstats/zhqvcrgkqodjbfyeuxdqaiqzx_org/pageviews.wsp
root@tungsten:/var/log/upstart#

another potential avenue of investigation from hashar

>    I have some examples related to continuous integration:

>   A) jenkins.ci , emitted by Jenkins, metrics namespaced as follow:

>     - job_name (roughly 4000 jobs)
>     - build status (4: success, failure, aborted, unstable)

>    Each having percentiles, count, max, mean, rate etc (12 entries)


good catch! looks like these shouldn't get additional metrics calculated by statsd, that would cut it by 12x. definitely worth investigating what's going on

so the solution here would be to separate build status from build time, status is fine being a different metric but build-time shouldn't be tied to the status as a metric, that greatly reduces the number of metrics

also note that the zuul/jenkins stats are pushed twice, e.g.

/var/lib/carbon/whisper/jenkins/ci/mwext-CentralNotice-testextension/FAILURE/count.wsp
/var/lib/carbon/whisper/zuul/pipeline/test/job/mwext-CentralNotice-testextension/FAILURE/count.wsp

and account for ~half of all metrics created daily.

I took a look at the jenkins statsd plugin and it seems fairly easy to change it not to differentiate timings based on the build status but only on the job name:

diff --git a/src/main/java/org/jenkinsci/plugins/statsd/StatsdListener.java b/src/main/java/org/jenkinsci/plugins/statsd/StatsdListener.java
index 2409d1b..ce00eb0 100644
--- a/src/main/java/org/jenkinsci/plugins/statsd/StatsdListener.java
+++ b/src/main/java/org/jenkinsci/plugins/statsd/StatsdListener.java
@@ -46,7 +46,8 @@ public class StatsdListener extends RunListener<Run> {
         jobName = jobName.replaceAll("\\/", "-");
         jobName = jobName.replaceAll("[^a-zA-Z_\\-0-9]", "");
 
-        String metricName = prefix + '.' + jobName + '.' + result;
+        String metricResultName = prefix + '.' + jobName + '.' + result;
+        String metricTimingName = prefix + '.' + jobName;
 
         LOGGER.log(Level.INFO, "StatsdListener: config: " + config);
         LOGGER.log(Level.INFO, "StatsdListener: job: " + jobName + ", result: " + result +
@@ -54,8 +55,8 @@ public class StatsdListener extends RunListener<Run> {
 
         try {
             StatsdClient statsd = new StatsdClient(host, port);
-            statsd.increment(metricName);
-            statsd.timing(metricName, (int)duration);
+            statsd.increment(metricResultName);
+            statsd.timing(metricTimingName, (int)duration);
         } catch (UnknownHostException e) {
             LOGGER.log(Level.WARNING, "StatsdListener Unknown Host: ", e);
         } catch (IOException e) {

We can most probably remove the Statsd plugin from Jenkins. I have created the sub task T1278: Remove statsd plugin from Jenkins

In T1075#22250, @hashar wrote:

We can most probably remove the Statsd plugin from Jenkins. I have created the sub task T1278: Remove statsd plugin from Jenkins

I think there might be some value in having those, but not as many. Note that also zuul metrics are basically duplicating those in jenkins, not sure exactly what generates those, zuul itself?

/var/lib/carbon/whisper/jenkins/ci/mwext-CentralNotice-testextension/FAILURE/count.wsp
/var/lib/carbon/whisper/zuul/pipeline/test/job/mwext-CentralNotice-testextension/FAILURE/count.wsp
In T1075#22250, @hashar wrote:

We can most probably remove the Statsd plugin from Jenkins. I have created the sub task T1278: Remove statsd plugin from Jenkins

I think there might be some value in having those, but not as many. Note that also zuul metrics are basically duplicating those in jenkins, not sure exactly what generates those, zuul itself?

@hashar any ideas on this?

I think there might be some value in having those, but not as many. Note that also zuul metrics are basically duplicating those in jenkins, not sure exactly what generates those, zuul itself?

/var/lib/carbon/whisper/jenkins/ci/mwext-CentralNotice-testextension/FAILURE/count.wsp
/var/lib/carbon/whisper/zuul/pipeline/test/job/mwext-CentralNotice-testextension/FAILURE/count.wsp

I finally looked at the usage of Graphite jenkins.ci metrics. Turns out they are not used from anywhere. The bug report to add them was: Jenkins: report metrics to statsdhttps://bugzilla.wikimedia.org/show_bug.cgi?id=55412 .

The reason was to generate graphs of the executors queues, but it turns out the Java plugin does not collect them ( https://bugzilla.wikimedia.org/show_bug.cgi?id=55988 ). So instead I added a Ganglia monitor which runs a python script to collect data out of the Jenkins REST API.

I have uninstalled the plugin ( T1278 ), still have to restart Jenkins but it is not an ideal time to do (there is some long running jobs going on which I don't want to abort). Whenever Jenkins is restarted, we can delete the whole 'jenkins.ci.' metrics hierarchy and reclaim the disk space.

For Zuul, the metrics are used to generate dashboards on the Zuul status page at https://integration.wikimedia.org/zuul/ , so we need to keep them. That being said, we probably do not need metrics for each jobs / results, unfortunately Zuul does not have support to finely select which metrics to send. Can be patched and proposed upstream.

Jenkins no more emits to statsd under jenkins.ci which can now be deleted entirely.

fgiunchedi lowered the priority of this task from High to Medium.Jan 12 2015, 5:08 PM

downgrading to normal since we've mitigated the biggest growth.
still pending zuul patching which now has over 93k disting metrics and totalling 100+ GB

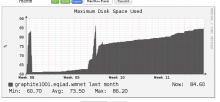
still occurring, big jump in disk used on graphite1001 some weeks ago:

screenshot_9hDSzT.png (276×594 px, 24 KB)

graphite1001:/var/lib/carbon/whisper$ du -hcs * | sort -h
0       irc
2.3M    test
5.6M    deploy
12M     gerrit
18M     VisualEditor
54M     jvm_memory
108M    scap
186M    ocg
195M    eventlogging
249M    parsoid
318M    carbon
978M    HHVM
1.3G    ve
2.3G    kafka
2.4G    restbase
3.3G    statsd
4.1G    cassandra
4.7G    swift
6.2G    frontend
13G     mw
42G     zuul
46G     varnishkafka
58G     jobrunner
78G     MediaWiki
78G     reqstats
341G    servers
680G    total

so servers is the biggest offender, which could match up with the growth of turning up MW in codfw (on average ~380MB/server, i.e. ~380 metrics/server)

graphite1001:/var/lib/carbon/whisper$ du -hcs servers/* | sort -h | tail -20
1.3G    servers/ms-be1015
1.3G    servers/ms-be2001
1.3G    servers/ms-be2002
1.3G    servers/ms-be2003
1.3G    servers/ms-be2004
1.3G    servers/ms-be2005
1.3G    servers/ms-be2006
1.3G    servers/ms-be2007
1.3G    servers/ms-be2008
1.3G    servers/ms-be2009
1.3G    servers/ms-be2010
1.3G    servers/ms-be2011
1.3G    servers/ms-be2012
1.3G    servers/ms-be2013
1.3G    servers/ms-be2015
1.4G    servers/ms-be2014
2.1G    servers/labstore2001
2.6G    servers/labstore1002
4.0G    servers/labstore1001
341G    total
graphite1001:/var/lib/carbon/whisper$ du -hcs servers/labstore1001/* | sort -h
4.5M    servers/labstore1001/vmstat
5.6M    servers/labstore1001/loadavg
12M     servers/labstore1001/cpu
16M     servers/labstore1001/memory
61M     servers/labstore1001/network
81M     servers/labstore1001/diskspace
3.8G    servers/labstore1001/iostat
4.0G    total

the iostat hierarchy seems the biggest offender, 48% of total servers

graphite1001:/var/lib/carbon/whisper$ du -hcs servers/*/iostat | sort -h | tail -10
996M    servers/ms-be2012/iostat
1.1G    servers/ms-be2003/iostat
1.1G    servers/ms-be2011/iostat
1.1G    servers/ms-be2013/iostat
1.1G    servers/ms-be2014/iostat
1.1G    servers/ms-be2015/iostat
2.0G    servers/labstore2001/iostat
2.6G    servers/labstore1002/iostat
3.8G    servers/labstore1001/iostat
229G    total

and we count both partitions and underlying devices, however just the partitions accounts for ~half of the total iostat space:

graphite1001:/var/lib/carbon/whisper$ du -hcs servers/*/iostat/sd*[0-9] | tail -5
31M     servers/zirconium/iostat/sda1
31M     servers/zirconium/iostat/sda2
31M     servers/zirconium/iostat/sdb1
31M     servers/zirconium/iostat/sdb2
127G    total

so I think it makes sense to consider just disks i.e. sd* but not the partitions within those (sw raid and lvm would still be graphed of course)

Change 197509 had a related patch set uploaded (by Filippo Giunchedi):
diamond: stop collecting disk partitions stats

https://gerrit.wikimedia.org/r/197509

Change 197509 merged by Filippo Giunchedi:
diamond: stop collecting disk IO stats for partitions

https://gerrit.wikimedia.org/r/197509

Change 358903 had a related patch set uploaded (by Filippo Giunchedi; owner: Filippo Giunchedi):
[operations/puppet@production] graphite: introduce graphite::whisper_cleanup

https://gerrit.wikimedia.org/r/358903

Change 358903 merged by Filippo Giunchedi:
[operations/puppet@production] graphite: introduce graphite::whisper_cleanup

https://gerrit.wikimedia.org/r/358903

Change 358910 had a related patch set uploaded (by Filippo Giunchedi; owner: Filippo Giunchedi):
[operations/puppet@production] role: cleanup zuul data in graphite

https://gerrit.wikimedia.org/r/358910

fgiunchedi renamed this task from something (reqstats?) puts many different metrics into graphite, allocating a lot of disk space to Something puts many different metrics into graphite, allocating a lot of disk space.Jun 21 2017, 2:17 PM

Mentioned in SAL (#wikimedia-operations) [2017-06-25T09:00:53Z] <elukey> Executing 'sudo -u _graphite find /var/lib/carbon/whisper/eventstreams/rdkafka -type f -mtime +15 -delete' on graphite1001 to free some space (/var/lib/carbon filling up) - T1075

Seen today: icinga-wm: PROBLEM - carbon-cache too many creates on graphite1001 is CRITICAL: CRITICAL: 1.67% of data above the critical threshold [1000.0]

Mostly rdkafka plus some 'instances' metrics, I spot checked a couple log files: /var/log/carbon/carbon-cache\@{a,b,c}/creates.log

@ArielGlenn thanks! yeah the eventstreams/rdkafka task is T160644, instances is also supposed to move to labmon in T143405

Change 358910 merged by Filippo Giunchedi:
[operations/puppet@production] role: cleanup CI data in graphite

https://gerrit.wikimedia.org/r/358910

Krinkle renamed this task from Something puts many different metrics into graphite, allocating a lot of disk space to Audit groups of metrics in Graphite that allocate a lot of disk space.Jul 8 2017, 1:56 AM
Krinkle subscribed.

Resolving this old task, individual big users are tracked separately