Page MenuHomePhabricator

Investigate Oct 3 outage of the Parsoid cluster due to high cpu usage + high memory usage (sharp spike in both) around 08:35 UTC
Closed, ResolvedPublic

Assigned To
Authored By
Joe
Oct 3 2015, 9:36 AM
Referenced Files
F2665063: oct03.parsoid.cpu.spike.png
Oct 7 2015, 11:40 PM
F2663673: pasted_file
Oct 7 2015, 7:05 AM
F2663648: pasted_file
Oct 7 2015, 6:56 AM
F2663635: pasted_file
Oct 7 2015, 6:56 AM
F2663471: pasted_file
Oct 7 2015, 5:43 AM
F2663409: pasted_file
Oct 7 2015, 5:06 AM
F2663405: pasted_file
Oct 7 2015, 5:05 AM
F2663368: pasted_file
Oct 7 2015, 4:57 AM

Description

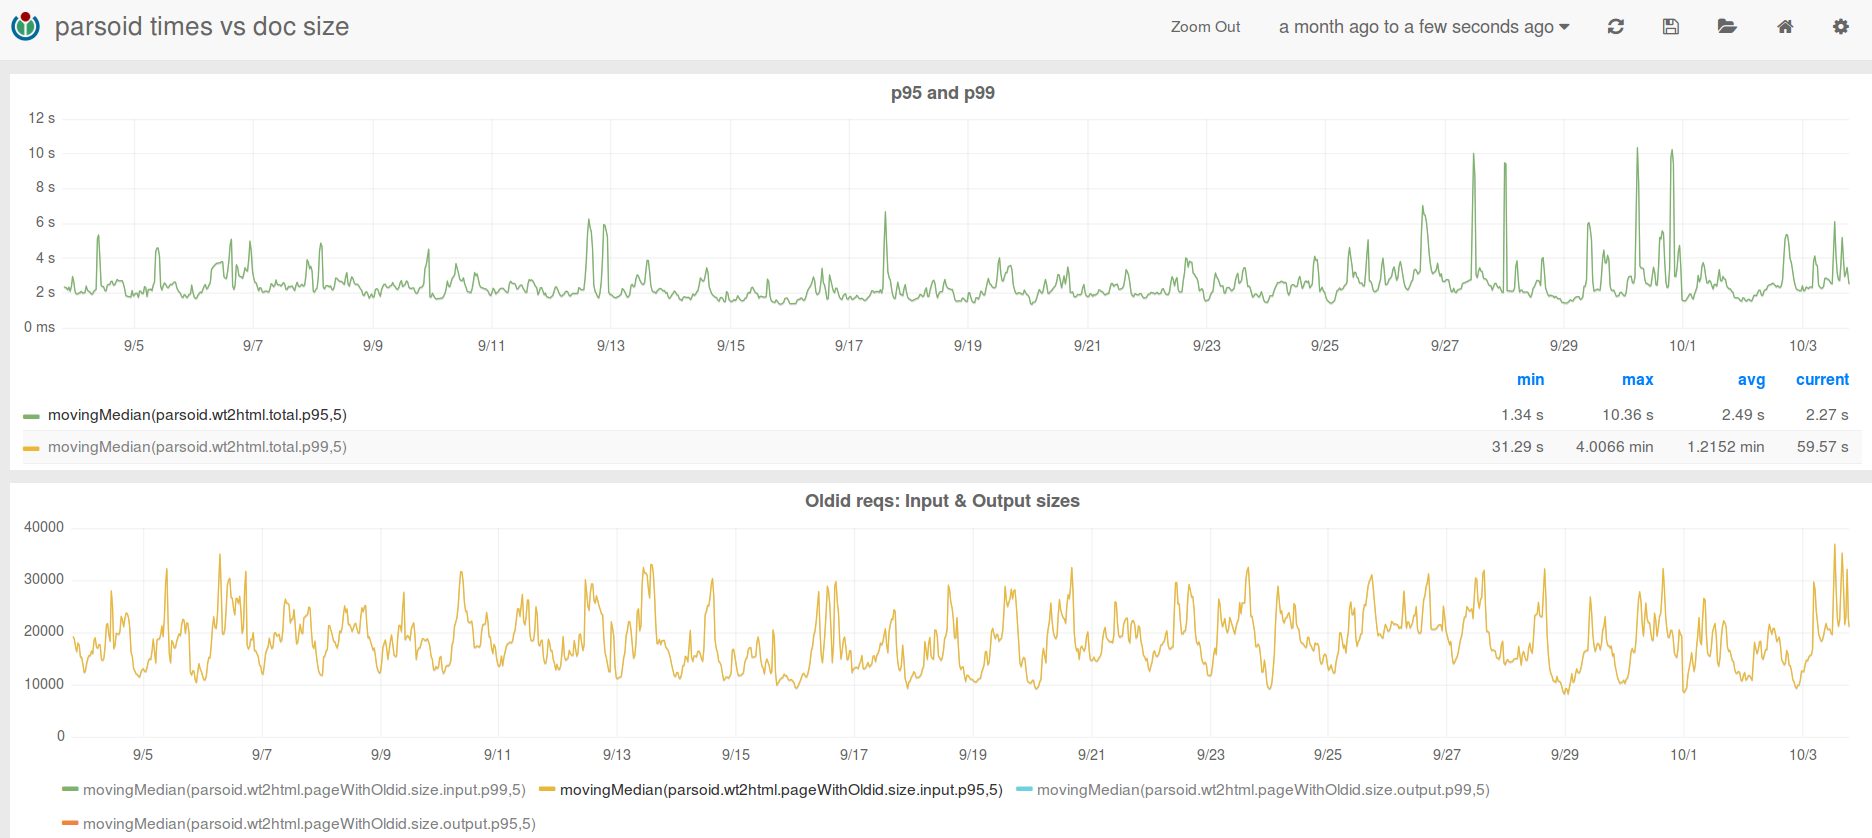
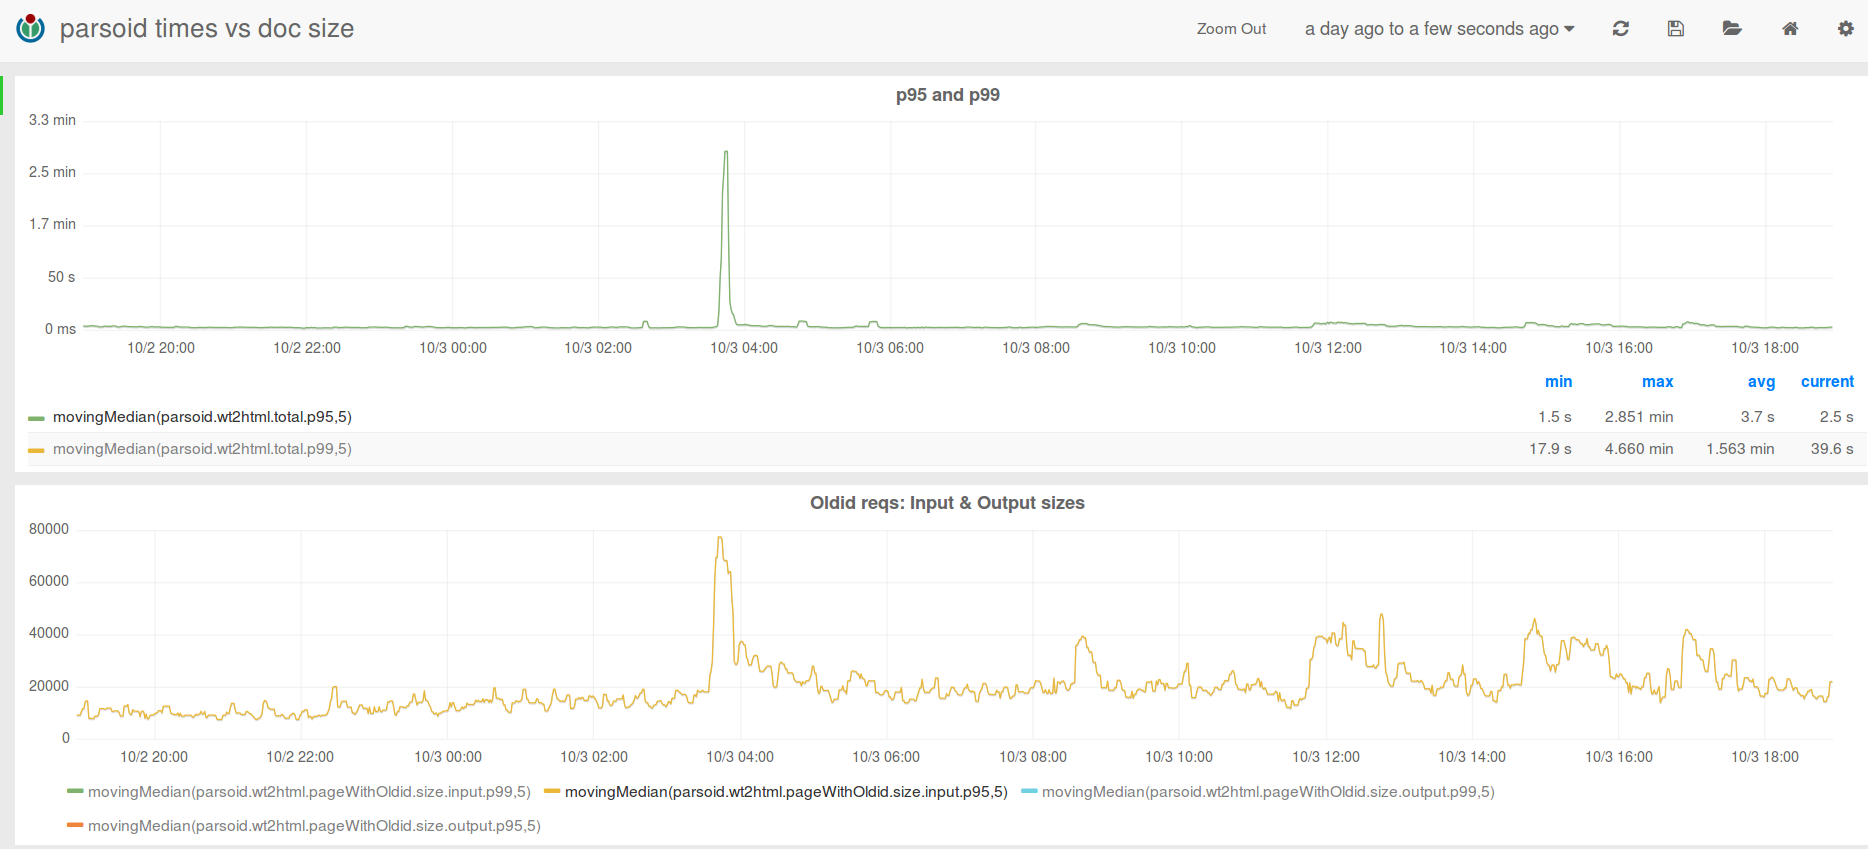
This morning I found all the parsoid servers under a sudden, very high CPU load. Restarting one of them did the trick of retaking it to a normal state, so I got some time to investigate

I found that, unsurprisingly, all the processes were stuck in some part of tokenizer.utils; but I got no clear indication of where in the code they were all stuck. Here is an example:

nodejs debug 127.0.0.1:5858
connecting... ok
debug> pause
break in /srv/deployment/parsoid/deploy/src/lib/mediawiki.tokenizer.utils.js:210
 208 				) && input.substr(pos, 5) === '{{!}}';
 209 			case '}':
 210 				return counters.template && input[pos + 1] === "}";
 211 			case ':':
 212 				return counters.colon &&
debug> bt
#0 mediawiki.tokenizer.utils.js:210:1
#1 undefined:19803:21
#2 PegTokenizer._processText mediawiki.tokenizer.peg.js:313:30
#3 PegTokenizer.process mediawiki.tokenizer.peg.js:226:7
#4 ParserPipeline.process mediawiki.parser.js:482:21
#5 ParserPipeline.process mediawiki.parser.js:482:21
#6 Util.processContentInPipeline mediawiki.Util.js:1158:12
#7 ext.Cite.js:55:8
#8 Ref.handleRef ext.Cite.js:121:2
#9 b native v8natives.js:1607:30

watching the master process, it was endlessly receiving timeout messages from the worker.

Since it's the weekend and we're having customer impact, I did restart the parsoids in the end.

Event Timeline

Joe raised the priority of this task from to High.
Joe updated the task description. (Show Details)
Joe added projects: Parsoid, acl*sre-team.
Joe subscribed.

Weird. Happened to be up early before heading out for the day (Saturday), but results of some quick investigation.

Looking at https://logstash.wikimedia.org/#/dashboard/elasticsearch/parsoid-cpu-timeouts .. there is a spike in timeouts around the time when the servers were all clogged up, but there is no title that is standing out. But, given that all workers got seized up => I would have expected the same title clogging all workers, and the timeout handling should have killed them all eventually. So, something really bad must have happened preventing the timeouts from even getting registered here. Or, alternatively ... it is some template common to all these titles logged on kibana which when tokenized threw the PEG js tokenizer in a loop.

Results of this sed command on wtp1001

$ cut -f12 -d"," /var/log/parsoid/parsoid.log | sed 's/:..\..*$//g;' | grep "10-03" | sort | uniq -c | less
...
    176 "time":"2015-10-03T08:35
     75 "time":"2015-10-03T08:36
     50 "time":"2015-10-03T08:37
     23 "time":"2015-10-03T08:38
     18 "time":"2015-10-03T08:39
     17 "time":"2015-10-03T08:40
     24 "time":"2015-10-03T08:41
      6 "time":"2015-10-03T08:42
      9 "time":"2015-10-03T08:43
      5 "time":"2015-10-03T08:44
     74 "time":"2015-10-03T08:45
    237 "time":"2015-10-03T08:46
...

So, if we cannot discern a pattern in the titles logged in Kibana (that timed out), we can look closer tomorrow or Monday at the titles logged around the slow activity period there (8:35 - 8:46). This should be reproducible locally as well.

But, thanks Joe for the initial investigation and the restarts.

From a mail thread:

Latencies are still up, and p99 from RESTBase's POV is often at the configured timeout of 2 minutes (see attached graph).

pasted_file (1×1 px, 476 KB)

On Sat, Oct 3, 2015 at 9:50 PM, Gabriel Wicke <gwicke@wikimedia.org> wrote:
The outage coincided with high memory usage (see attached graph). Right now, I still see parsoid processes frequently use > 1G RSS. IIRC, normal memory usage is closer to 300M.

pasted_file (430×747 px, 47 KB)

@Joe wrote:

The high memory footprint was a consequence rather than a cause of the outage - the problem was that all node processes were hanging up consuming 100% of their cpu in loops inside the tokenizer code, for some reason I didn't investigate more (it is the weekend afterall, and I looked mainly at resolving the outage). I suppose correlating the requests to parsoid at the time of the outage could do the trick - something clearly took the whole cluster by storm in a very short timespan.

I am unsure that current latencies at the 99th percentile are related to the earlier outage directly - surely worth investigating anyways.

Not saying that the outage was caused by memory usage, but one thing to keep in mind that it's often hard to separate CPU usage and memory usage. Node processes nearing the default heap limit of ~1.8G tend to spend most time in last-ditch stop-the-world GCs, and this isn't visible when attaching the node debugger.

Check http://grafana.wikimedia.org/#/dashboard/db/parsoid-times-vs-doc-size ... and you will find a few different interesting tidbits:

  1. The outage corresponds to a spike in the p95 input size (wikitext). If you zoom out to a 2-day period, you also see that the p95 input sizes have been higher than usual. If you zoom out to a 7-day window, that is still true. If you zoom out to a 30-day window, you see cyclical behavior in sizes (which makes sense -- corresponds to the edit cycle) but for today, you see a spike that is yet to come down.
  1. The p99 times seen today have an extremely strong correlation with the p99 output size (10MB and higher). So, I suspect the tree builder, and our DOM passes are groaning under the size of the output doc -- this is definitely worth investigating and fixing. If you zoom out to a 30 day window, you will see that these p99 output spikes are unique to this last week (starting Sep 27th). That explains the high p99 values seen this week (batching was enabled on the 29th, so, it is unrelated to batching -- just happens to be a coincidence).

So, I think these explain what we've seen this week (higher p99 times than usual). Plus, I think the outage can be identified if we look at the pages that were being parsed around that time. I may or may not get to this tonight (feeling a little tired and exhausted) -- it doesn't seem highly critical but something I / we might investigate tomorrow / this week.

Will save screenshots and upload them later .. but the dashboard should still be helpful if you are looking at this today.

If you look at the p99 size vs. latency graphs, similarly-sized documents were processed with reasonable latency and no outage before, for example one fairly large batch around Sept 13th.

pasted_file (1×1 px, 486 KB)

One possible explanation could be that batching is likely to increase the number of tokens in flight (and memory) as they are processed in a batch:

On Tue, Jul 7, 2015 at 10:15 PM, Gabriel Wicke <gwicke@wikimedia.org> wrote:

  1. Parsoid end: batching of API requests (T45888: expand N transclusions in 1 MW API request)
    • - potential for higher peak memory usage and increased gc pressure (could offset the benefits from Parsoid-side reduction in API overheads)

One of the reasons for introducing incremental tokenization was to bound the number of tokens in flight, and thus peak memory usage. Incidentally, replacing setImmediate with nextTick as discussed in https://gerrit.wikimedia.org/r/#/c/243229/ would effectively disable incremental tokenization, and further drive up peak memory usage.

Reg. GC pressure because of increased tokens in flight due to batch, that is a possibility I hadn't thought about .. so, worth investigating. But, yes, gerrit 243229 is not +2ed because it needs further discussion. However, right now, the reason gerrit 243229 came into being is because Tim found that the average batch size is 2.4 (although as we also discussed on IRC, average batch size data might be hiding variations).

But, one thing that seems clear is that the shape of the p95 output size graph is an extremely accurate predictor of the shape of the p95 times (I am actually quite surprised by this -- see attached graph)

p95.time.vs.size.5.months.png (846×1 px, 274 KB)

This is less so with p99 timings, possibly because of inefficiencies in our dom post-processing passes, the html tree builder, or even plain GC pressure. It is possible that in this context, batching could be adding additional GC pressure.

I am less convinced that the outage was caused by batching since the outage was across all nodes, and I would have expected batching-induced GC-pressure related outage to be limited to one or two nodes and spread out across time, rather than be a synchronized event. My suspicion is the tokenizer still (which is what Joe seems to be suggesting as well). Anyway, rather than continue speculation, I think we'll know more when we look at the pages -- possible tomorrow evening or much more likely Monday.

And, the reason I am surprised by the graph I pasted above is because of what it seems to be saying:

it doesn't matter how many API calls you are making. It doesn't matter how many transclusions there are, It doesn't matter what the input size is. All that matter is the output size. All those only matter insofaras they determine the output size. So, that indicates that DOM building and processing is a big part of determining p95 parsing latencies.

Well, all of those other things correlate with output size. I wouldn't get too misled by that. A page can contain a single template inclusion, which then expands to 100s of kb of wikitext. So it doesn't seem surprising that *output size* is a truer measure of page complexity than input size.

"Wikitext size", accumulated over all transclusions, I'd expect to be just as correlated with processing time (and output size). The question is whether the relationship is linear (not much to be done there) or quadratic, etc---which indicates we might have additional algorithm work to do.

And if accumulated wikitext input size does *not* correlate with output size, its worth investigating what in our DOM representation might cause that blowup.

Finally, note that the fast expansion of hygenic templates would allow us to decouple processing time with accumulated input size; we'd expect typical processing to be more closely correlated with the simple measure of input wikitext size in that case.

Even though we're " sure" batching has nothing to do with this, I think we should turn batching off in the Monday deploy and verify its innocence experimentally.

<tangent>At this point, this is a tangent to the subject of the ticket (and I am responsible for the tangent, but one final clarification and we can take this on IRC and mailing list discussion).

You are right that I made too much of that correlation in my tired state.

That said, here is what I was thinking when I wrote that: there is a lot of work that happens in the peg tokenizer and there is a whole lot of API calls that we make that are not a function of output size. Neither of that is a function of output size (if output = c * total-wikitext for a "fixed" c or for all pages, then peg would technically be, but see more below about that). So, where does that all that variance go? Definitely, part of it is because of async work that hides the API latencies quite well. Besides that, there is a lot of processing that happens after async 2 stage.

I think you are also arguing that the output size is a constant size factor of the fully expanded wikitext input size (which is true for most wikitext constructs). But, data-mw size is dependent on # of transclusions. So, the output size is not likely a fixed constant across all pages.

Anyway TL:DR; is overall, I would have expected some variance between the output size and the times there but the really tight fit threw me off.
</tangent>

I am okay with turning off batching to see what that does to p99 timings but that doesn't tell us anything about the outage we had which is what we still need to resolve. We'll still have to dig into the specific pages that were being parsed in that time period. I am baffled by the lack of obvious clear evidence in Kibana, i.e. the fact there is no repetitive parsing of a set of pages that were repeatedly timing out. Those cause transient (< 1 hour usually) CPU spikes (this happened twice in early September because of large pages, and it happened today briefly See Kibana dashboard).

During y'days outage, that:

  • CPU maxed out,
  • unlike the other timeout events where the problems resolves on its own when the master process kills the timed out workers (as happened with all the load spike events I referenced above),
  • we don't have a smoking gun set of pages logged in Kibana

makes me wonder if Gabriel is on the right track about GC pressure. Let us continue discussion on IRC / emails and post summary of findings here once we are done. I thought I would dig into this this evening / tonight but I am exhausted after another day of badminton .. so, has to wait for next week.

Turns out the reason for the really tight fit was simply because I was doing the wrong thing (smoothening out 2 varying curves and fitting them visually, instead of dividing values and smoothing that value). So, that mystery is explained as a result of bad statistical munging.

http://grafana.wikimedia.org/#/dashboard/db/parsoid-times-vs-doc-size?panelId=14&fullscreen now shows that as expected, there is a fair amount variation in "output bytes / millisececond" rate. p95 values are between 40 and 60 with a daily cyclical variation. p99 values vary a bit more wildly but also have a daily cyclical variation. Not sure if this "output bytes / second" is a good measure for Parsoid's parsing efficiency, but all other things being equal, it may be a good proxy measure.

Here is the summary of my findings so far:

  1. I took a dump from Parsoid CPU timeouts dashboard as well as the Parsoid Request timeouts dashboard. There is nothing that shows up in the form of repeating titles there (which is the pattern we see when the offender is a page on which parsoid barfs). I anyway replayed all the titles on my laptop (with batching enabled) and they are all fairly small pages. All of them parse under 20 secs and all but 7 titles parse under 10 secs. So, it looks like the cpu and request timeouts logged in Kibana are a *result* of the outage rather than being a *cause* of the outage. So, nothing to see there.
  1. Based on T114558#1699440, I took a dump of requests from 08:30 - 08:36 on wtp1001 and replayed all 2000+ titles on my laptop, and except for 4 titles that took 10-11 secs, everything else finished in under 10 secs. So, nothing to see there either.
  1. I then look at all the titles that started parsing and didn't finish parsing. The common title between the 08:20 - 08:29 timerange and unfinished titles from the entire day is T75412: OCG Attribution request times out reguarly. See T75412#987623 specifically. I look at the frequency of that title (independent of what wiki it came from) at every minute of the day on wtp1001, wtp1003, wtp1005, wtp1020 and all of them have multiple minutes in the 8:20 - 8:30 timeframe when there 10+ reqs to that interface page (which probably is a wrapper over the set of pages that have to be PDF-rendered). At other times in the day, there are all usually in the single digits. So, I don't know this for sure, but I suspect that we saw some PDF_rendering related spike to the entire Parsoid cluster that Parsoid couldn't handle and saturated the memory. This may be specific to the specific set of pages that was being rendered to PDF. I am just fitting a theory to the pattern, but don't know for sure. Something @cscott can help prove / disprove by looking at OCG logs and see what we find there in that timeframe.

Here is the script I ran on different production server (it is either parsoid.log.2.gz or parsoid.log.3.gz depending on how the logs getted rolled up).

$ gunzip < /var/log/parsoid/parsoid.log.2.gz | grep "MediaWiki:Coll-attribution-page" | grep 'started parsing' | cut -f12 -d"," | sed 's/:..\..*$//g;' | grep "10-03" | sort | uniq -c | less

Commands used for grabbing other sets of titles.

$ gunzip < /var/log/parsoid/parsoid.log.3.gz | grep "10-03" | egrep -i '08:[2][0-9]' | grep 'started parsing' | cut -f20,24,27 -d'"' | sort > /tmp/oct03.0820-0829.titles
$ gunzip < /var/log/parsoid/parsoid.log.3.gz | grep "10-03"  | grep 'started parsing' | cut -f20,24,27 -d'"' | sort > /tmp/oct03.started
$ gunzip < /var/log/parsoid/parsoid.log.3.gz | grep "10-03"  | grep 'completed parsing' | cut -f20,24,27 -d'"' | sort > /tmp/oct03.completed

Dumping some IRC conversation:
(06:51:28 PM) cscott-free: yeah, it's because for certain long lived articles the number of contributors is huge.
(06:53:32 PM) cscott-free: hm, i wonder if there's a bad interaction with batching?
(06:54:02 PM) cscott-free: there are some nested template calls in OCG to do the attribution rendering, perhaps batching means that we're handling them in a very suboptimal order now, causing memory blowup.
(06:56:44 PM) cscott-free: subbu: i think this would log parsoid timeouts, since they would cause the bundler to never complete: https://logstash.wikimedia.org/#/dashboard/elasticsearch/ocg-cpu-leak
(06:57:32 PM) cscott-free: [...] the ocg-cpu-leak search above displays only 3 ocg timeouts in the last seven days.
(06:58:08 PM) subbu: yes. so, they may have completed, but caused GC pressure that prevented later reqs from completing.
(06:58:15 PM) subbu: because of memory spike.
(06:58:39 PM) cscott-free: i'm not sure i believe that.
(07:01:53 PM) cscott-free: [...] i agree there might be some smoke there, but the OCG attribution page behavior has been nonideal but constant for over a year now.
(07:01:53 PM) subbu: but, i didn't find such spikes across all servers. but, on that day, I found this 8:20 - 8:40 and 9:10 -.. spike on at (07:04:22 PM) cscott-free: collections [does its] best to store the actual collection being requested, but logstash is lossy and UDP
(07:04:42 PM) cscott-free: so the largest collection jsons are the least likely to get logged
(07:05:09 PM) cscott-free: but we can cross our fingers and hope that if OCG is responsible, it's a simple collection/article that just happens to have a very large number of contributors.
(07:07:44 PM) cscott-free: TimStarling: it's https://www.mediawiki.org/wiki/Offline_content_generator
(07:08:07 PM) cscott-free: TimStarling: with most content at https://wikitech.wikimedia.org/wiki/OCG still. It's the backend for https://www.mediawiki.org/wiki/Extension:Collection
(07:08:50 PM) cscott-free: TimStarling: the code generating the requests would be at https://github.com/wikimedia/mediawiki-extensions-Collection-OfflineContentGenerator-bundler/blob/master/lib/attribution.js#L233 if this theory is correct.
(07:10:30 PM) cscott-free: it's invokving the wt2html endpoint on {{int:Coll-attribution-page|%s|%s|%s}} where each %s is a largish collection of <ul><li>{{int:Coll-image-attribution....}}<li>....</ul> or <ul><li>{{int:Coll-article-attribution<li>...</ul>
(07:07:10 PM) cscott-free: https://logstash.wikimedia.org/#/dashboard/elasticsearch/OCG%20Backend%20requests has all the requests, it's the job.metabook field in the logged event.
(07:11:48 PM) cscott-free: subbu: if you click on the 'inspect' button in the event list for https://logstash.wikimedia.org/#/dashboard/elasticsearch/OCG%20Backend%20requests you'll get a longish CURL query.
(07:12:08 PM) cscott-free: subbu: you can tweak that to get all the jobs from the date range required (after converting the times to unix timestamps)
(07:12:24 PM) subbu: yup. that is how i pulled out the titles from the cpu and request timeout logs from kibana.
(07:13:15 PM) cscott-free: so, same thing. except with the caveat, as I mentioned, that largish job.metabook values tend to get dropped by UDP and don't show up here.
(07:16:32 PM) cscott-free: unfortunately we don't record exactly what wiki page triggered the collection request. since users can create their own ad hoc collections of pages, doing so is a little tricky: T97030
(07:16:59 PM) cscott-free: but you can redo the request using the logged json file on the command line using mw-ocg-bundler, hopefully that will be enough to reproduce.

ssastry renamed this task from All parsoid servers almost unresponsive, under high cpu load to Investigate Oct 3 outage of the Parsoid cluster due to high cpu usage + high memory usage (sharp spike in both) around 08:35 UTC.Oct 5 2015, 11:31 PM
ssastry set Security to None.

Note that MediaWiki:Coll-attribution-page is just the arbitrary title OCG provides for a /transform/wikitext/to/html request. VE and Flow do these as well, but they usually have a reasonable title to associate with the request (even though we can't strictly guarantee that the wikitext provided has any relation to the contents of that title). Collections doesn't always have a good title to associate with the collection, but where T97030 manages to come up with one we really ought to propagate it into the wt2html request.

@ssastry, @GWicke: This task is great, but could you guys please also turn this info into an incident report to be posted on https://wikitech.wikimedia.org/wiki/Incident_documentation ? Thanks :)

I could use some help translating the time period in question into a unix timestamp value appropriate for feeding to logstash. Has anyone done this conversion already? I want to make sure I don't make a mistake here and end up pulling the wrong range of OCG queries.

@ssastry, @GWicke: This task is great, but could you guys please also turn this info into an incident report to be posted on https://wikitech.wikimedia.org/wiki/Incident_documentation ? Thanks :)

Yes, will do.

This comment was removed by GWicke.

Pagebundle request rates around the time of the outage:

pasted_file (1×1 px, 303 KB)

Here is a break-down of parsoid requests failing with ETIMEDOUT in the outage period, from the restbase logs:

pasted_file (5×2 px, 2 MB)

Distribution of all requests to /en.wikipedia.org/v1/transform/wikitext/to/html/MediaWiki%3AColl-attribution-page around that time (timed out or not):

pasted_file (5×2 px, 1 MB)

Another screenshot with timeouts sorted by timestamp ascending, showing that the first burst of timeouts is dominated by the attribution pages, followed by lots of Chinese pages:

pasted_file (5×2 px, 1 MB)

I think this supports the theory that the outage correlates with a burst of OCG attribution page wt2html requests.

Here is a break-down of parsoid requests failing with ETIMEDOUT in the outage period, from the restbase logs:

...

Distribution of all requests to /en.wikipedia.org/v1/transform/wikitext/to/html/MediaWiki%3AColl-attribution-page around that time (timed out or not):

...

Another screenshot with timeouts sorted by timestamp ascending, showing that the first burst of timeouts is dominated by the attribution pages, followed by lots of Chinese pages:

...

I think this supports the theory that the outage correlates with a burst of OCG attribution page wt2html requests.

I posited this exact scenario to Scott y'day afternoon but then realized that the timeouts are a result of, rather than a cause of the already seized up servers. The cpu and memory spike started around 8:33 and the effect was in full force by 8:37. So, the timeouts you are seeing are a result of that. Look at this request timeout logs and the huge spike in the same time period from which you posted screenshots. The attribution page wt2html reqs are just part of everything that was timing out around then. Given that we have 3 reqs / sec to the PDF service, it just happens that that the attribute page wt2html reqs stand out since they all have the same "title".

I have not yet dismissed the OCG attribution page theory. Scott was replaying the pdf requests y'day, but stopped since he was done for the day and he is working today. I think we will know once he gets to the 8:33 time .. he was at 8:26/8:27 when he stopped. He'll resume tomorrow.

Requests timing out at 8:37 would have been started for the first time at 8:33, considering RESTBase's two-minute timeout and single retry. That, in combination with the first batch of timeouts in that entire time frame being clearly dominated by attribution page requests, I think makes it clear that those attribution pages were the first to timeout, and are likely the trigger for the outage. The zhwiki requests around the same time might have contributed additionally, but since they started to really time out later it is possible that they were slowed by workers low on memory by then.

Requests timing out at 8:37 would have been started for the first time at 8:33, considering RESTBase's two-minute timeout and single retry. That, in combination with the first batch of timeouts in that entire time frame being clearly dominated by attribution page requests, I think makes it clear that those attribution pages were the first to timeout, and are likely the trigger for the outage.

Aha! Good point.

I got to #1714 of the #3274 requests between 8:20 and 8:40. Interpolating, that's probably 8:30 or so. I didn't want to let it continue to run when I wasn't monitoring it, in case it brought down the Parsoid cluster again while we were all sleeping. I'm taking today (Wednesday) as a flex day for Columbus day, but I'll continue replaying the results Thursday morning and should get them finished in that time.

There is a biggish spike in requests to OCG every 12 hours or so -- somebody has a cron job set up -- but OCG has a queue and only three workers (IIRC they each process 4 or so requests in parallel), so even a large spike in requests doesn't immediately translate to a large spike in restbase requests. And because there is caching and limited retry, it *ought* to be hard for a single bad request to bring down the entire parsoid cluster: we deliberately prevent retry of collection requests which fail for a period of an hour or so.

Which isn't to say that OCG is guiltless --- just that it's going to be an interesting failure mode when we find it. Eg, if there's a killer piece of wikitext, I expect to find it in a template which is repeated across several books, all of which were being rendered, since I don't think a single bad book would have enough parallelism to kill the whole cluster.

And there were certainly some interesting requests during that time period. One of the books being rendered was a book of 2,000 or so Portuguese recipes, each a single article. Luckily attributions are per-article! But it's certainly the case that some of the wikibooks and wikisource renderings are quite large. But again, that's why there's an OCG queue: even a large book should spread its requests out in time.

Looking forward, T97030 will help to distinguish (some of) the wt2html requests in the future by using better titles, so OCG wouldn't seem like such a "point source".

Pasting here for the record:

(11:18:26 AM) cscott-free: hm, graphite shows two huge OCG request spikes in the past 24 hr.
(11:19:26 AM) cscott-free: huh. the spikes are periodic. somebody's got a cron job running every 12 hours, or something like that.
(11:20:10 AM) cscott-free: http://graphite.wikimedia.org/S/D
(11:20:37 AM) cscott-free: unfortunately, i have no idea what the units on the Y axis are.
(11:20:50 AM) cscott-free: but cache rate is about 50%
(11:20:54 AM) cscott-free: cache hit rate, rather.

For the time period in question:
http://graphite.wikimedia.org/S/E shows a request rate of about 3/s - 6/s, of which about 2/s hit in the cache. again, assuming the units are "request per second", graphite is infuriatingly vague about units.

Not terribly unusual.

Since we didn't take a ganglia snapshot on the day of, here is a recreated graph from graphite (I only picked wtp1001 - wtp1012, but the cpu spike is fairly clear -- the rest of the servers had similar cpu graphs). I am adding it here for referencing it from the incident report @ https://wikitech.wikimedia.org/wiki/Incident_documentation/20151003-Parsoid

oct03.parsoid.cpu.spike.png (767×1 px, 316 KB)

See T75412#1711585 which I think explains the Oct 3 outage.

See T75412#1711585 which I think explains the Oct 3 outage.

Something I noticed on enwiki/User_talk:Bam123456789/Archive_4 is that parsing yields at an appropriate time to send the request timeout, but then goes happily on draining resources until the process is out of memory. In other words, the request timeout doesn't actually halt processing, it just clears the cpu timeout and returns a response, which ends up being more harmful than helpful.

Maybe we should rearchitect the api server so that the master dispatches jobs to workers, rather than merely enabling a shared port to listen on. The benefit being that multiple, equivalent requests can wait on the same job, and killing a worker won't take down collateral request / present any confusion about which was the problematic job. I believe mw-ocg-service works like this. A downside being the loss of concurrency in the workers.

Was any maintenance happening on the servers around that time?

In other words, the request timeout doesn't actually halt processing, it just clears the cpu timeout and returns a response, which ends up being more harmful than helpful.

If the intention is to kill the worker instead, then service-worker might be able to help. We now have fairly solid support for killing workers cleanly, but it took some work due to various edge cases (see for example this work-around).

The main built-in triggers in service-worker are currently a heartbeat (not per-request) and heap limits, so for parsoid we might have to add per-request timers.

ssastry claimed this task.

The main task of investigating this is done -- we have found whatever we could and filed a whole bunch of tasks to work on which are listed in this incident report.

Closing this as resolved now. Please file additional tasks for anything else that needs to be worked on.