Description
Related Objects
- Mentioned In
- T148663: Drop in iOS app pageviews since version 5.2.0
T135299: Backfill Android Apps pageviews from May 2nd hour 21 - Mentioned Here
- T133204: Client values inbound in X-analytics header (pageview and preview) are reflected in outbound X-Analytics on varnish
T128612: Count requests to RESTBase from the Android app
T128887: Add x-analytics header for page view and preview requests
Event Timeline
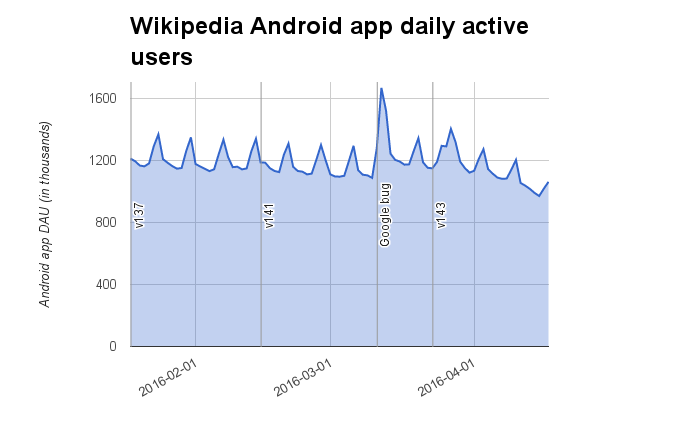
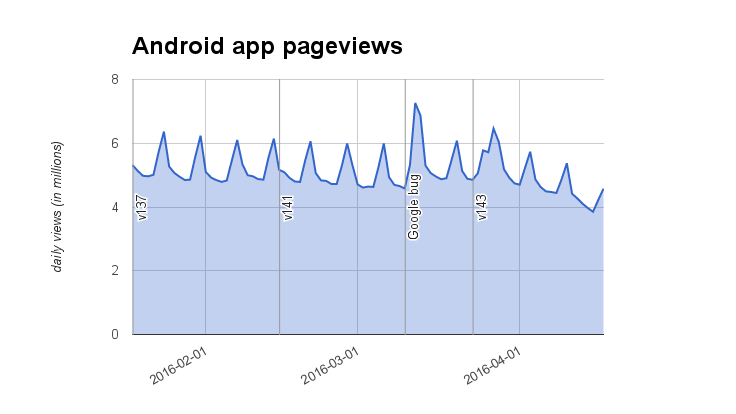
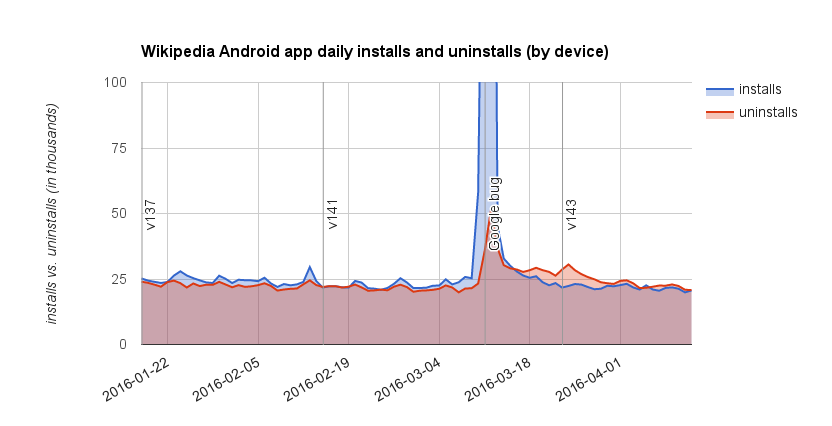
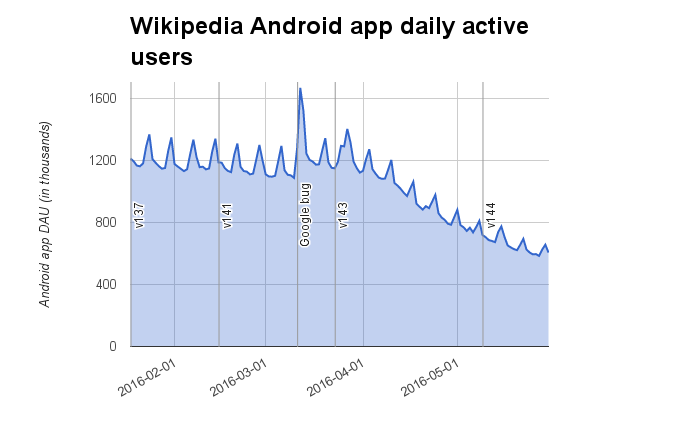
And it does not seem to be related to the to the Google bug around March 11, which caused about 600k new installs, many of which we lost again in subsequent weeks as expected (higher uninstall rate).
This decline is more recent, and going below the levels before the Google incident. And it is *not* mainly driven by app uninstalls:
Data sources:
SELECT CONCAT(year,"-",LPAD(month,2,"0"),"-",LPAD(day,2,"0")) as date, unique_count AS Android_DAU FROM wmf.mobile_apps_uniques_daily WHERE platform = 'Android';
SELECT year, month, day, CONCAT(year,"-",LPAD(month,2,"0"),"-",LPAD(day,2,"0")) as date, SUM(view_count)
FROM wmf.pageview_hourly
WHERE year = 2016 AND access_method = 'mobile app' AND access_method = 'mobile app'
 AND user_agent_map['os_family'] = 'Android' AND agent_type = 'user'
GROUP BY year, month, day ORDER BY year, month, day LIMIT 1000;
SELECT year, month, day, CONCAT(year,"-",LPAD(month,2,"0"),"-",LPAD(day,2,"0")) as date, user_agent_map['wmf_app_version'] AS app_version, SUM(view_count) AS views
FROM wmf.pageview_hourly
WHERE year = 2016 AND month > 2 AND access_method = 'mobile app' AND access_method = 'mobile app'
 AND user_agent_map['os_family'] = 'Android' AND agent_type = 'user' AND user_agent_map['wmf_app_version'] LIKE '%-r-%'
GROUP BY year, month, day, user_agent_map['wmf_app_version']  ORDER BY year, month, day, app_version  LIMIT 10000;
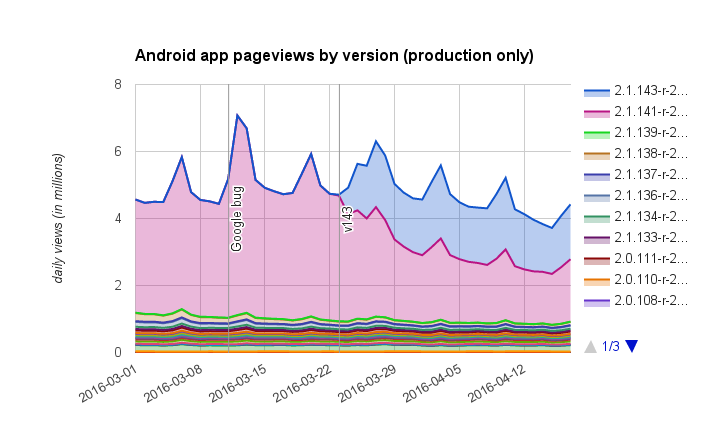
Update, just so that people reading along here know: There has been extensive internal discussion about this (the accompanying thread with people from the Android, Analytics, Services and Ops teams has > 35 emails now), zooming in on the handling of the X-Analytics header in connection with RESTBase and the recent rollout of Content Service in the app. I.e. there is reason to assume the decline is an artefact. But there is no fix yet.
While this is being sorted out (any updates?), I have added an annotation to the Vital Signs dashboard, where this artificial decrease in app pageviews is very visible now (click "data breakdowns" on the left, then unselect all except "Mobile App")
Does https://gerrit.wikimedia.org/r/#/c/285051/ (T133204: Client values inbound in X-analytics header (pageview and preview) are reflected in outbound X-Analytics on varnish ) address the header enrichment? What do the stats say now?
@dr0ptp4kt : yes, varnish code publishes appropriate headers to x_analytics field, I confirmed those are present in cluster data.
It did not. Nuria observed on the email thread last week that there has to be a bug due to which pageviews to the REST endpoint are not counted.
What do the stats say now?
On the Vital Signs dashboard (cf. T132965#2288226 ), app pageviews reached a record low last week.
Bug is fixed on code: https://gerrit.wikimedia.org/r/#/c/288458/
We are in the process of backfilling pagebviews for apps: cc @JAllemandou
Code has been deployed the day before yesterday at 17:00 UTC.
Yesterday number for enwiki mobile apps in vital signs seems aligned with before-bug number.
Backfill for the period 2016-05-03 - 2016-05-17 is in progress.
Data has been backfilled from bug correction date (2016-05-03 for a full day). It looks correct in Vital signs.
It does not look like the daily active users (wmf.mobile_apps_uniques_daily) have been fixed yet:
Data source:
SELECT CONCAT(year,"-",LPAD(month,2,"0"),"-",LPAD(day,2,"0")) as date, unique_count AS Android_DAU FROM wmf.mobile_apps_uniques_daily WHERE platform = 'Android';
mmm.. given that daily users relies on app install id and that at least 1 request must have been sent to the regular php endpoint (correct?) as app cannot function only with the new restbase API (correct?) I do not see why daily users would be affected in the same way that pageviews were cc @Dbrant to confirm whether app can function only with rest endpoint.
@Tbayer: I'm sorry I have been too fast in assuming just the pageview check was incorrect.
I have found the culprit and I'm currently sending a patch for review.
@Nuria It's entirely possible for the app to use RestBase entirely (at least for viewing pages). The only instances where the app still uses the php endpoint is for search and miscellaneous page properties (e.g. image gallery).
Data backfilled and checked !
There is a decline, but very similar to previous periods in time.
Cool, thanks! I agree that the Android DAUs look plausible now, so let's close this ticket. (For the record, the table was accidentally deleted and then restored from previously retrieved data, but this hopefully did not introduce any inaccuracies.)
